| Param | Original file | Final file |
|---|---|---|
| Filename | modeM0/AS1C07_001T10_9000005890_43602cztM0_level2.fits | modeM0/AS1C07_001T10_9000005890_43602cztM0_level2_quad_clean.evt |
| Size (bytes) | 1,115,856,000 | 66,389,760 |
| Size | 1.0 GB | 63.3 MB |
| Events in quadrant A | 4,555,887 | 681,615 |
| Events in quadrant B | 7,376,218 | 651,313 |
| Events in quadrant C | 15,196,298 | 184,487 |
| Events in quadrant D | 13,720,015 | 72,065 |
| Mode SS | |||
|---|---|---|---|
| Quadrant | BADHDUFLAG | Total packets | Discarded packets |
| A | 0 | 122 | 0 |
| B | 0 | 122 | 0 |
| C | 0 | 122 | 0 |
| D | 0 | 122 | 0 |
| Mode M9 | |||
|---|---|---|---|
| Quadrant | BADHDUFLAG | Total packets | Discarded packets |
| A | 0 | 10 | 0 |
| B | 0 | 10 | 0 |
| C | 0 | 10 | 0 |
| D | 0 | 10 | 0 |
| Mode M0 | |||
|---|---|---|---|
| Quadrant | BADHDUFLAG | Total packets | Discarded packets |
| A | 0 | 17833 | 14 |
| B | 0 | 26065 | 17 |
| C | 0 | 49280 | 51 |
| D | 0 | 44898 | 24 |
| Quadrant | Total seconds | Saturated seconds | Saturation percentage |
|---|---|---|---|
| A | 5927 | 213 | 3.593724% |
| B | 5929 | 1138 | 19.193793% |
| C | 5925 | 5857 | 98.852321% |
| D | 5928 | 5928 | 100.000000% |
Noise dominated data is calculated using 1-second bins in cleaned event files. If a bin has >2000 counts, and if more than 50% of those come from <1% of pixels, then it is considered to be noise-dominated and hence unusable.
| Quadrant | # 1 sec bins | Bins with >0 counts | Bins with >2000 counts | High rate bins dominated by noise | Noise dominated (total time) | Noise dominated (detector-on time) | Marked lightcurve |
|---|---|---|---|---|---|---|---|
| A | 6946 | 5930 | 88 | 88 | 1.27% | 1.48% | 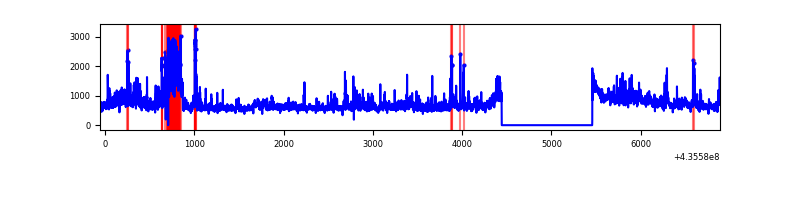 |
| B | 6946 | 5931 | 900 | 900 | 12.96% | 15.17% | 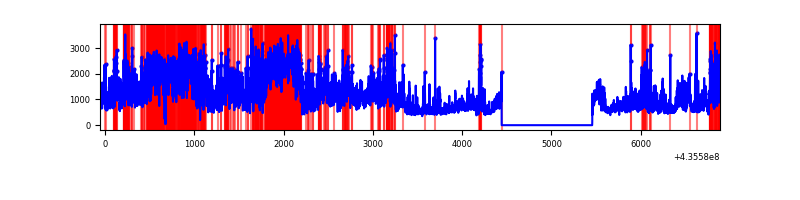 |
| C | 6946 | 5924 | 5666 | 5666 | 81.57% | 95.64% |  |
| D | 6945 | 5927 | 4749 | 4749 | 68.38% | 80.12% | 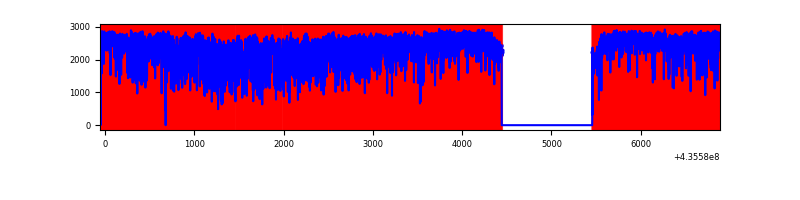 |
Top three noisy pixels from each quadrant. If the there are fewer than three noisy pixels in the level2.evt file, extra rows are filled as -1
| Pixel properties | Quadrant properties | ||||||
|---|---|---|---|---|---|---|---|
| Quadrant | DetID | PixID | Counts | Sigma | Mean | Median | Sigma |
| A | 10 | 83 | 773360 | 5683.08 | 667 | 654 | 136.0 |
| A | 14 | 63 | 462797 | 3398.96 | 667 | 654 | 136.0 |
| A | 12 | 189 | 367203 | 2695.89 | 667 | 654 | 136.0 |
| B | 4 | 206 | 3348368 | 27597.04 | 628 | 611 | 121.3 |
| B | 5 | 235 | 638187 | 5255.82 | 628 | 611 | 121.3 |
| B | 0 | 219 | 215692 | 1773.01 | 628 | 611 | 121.3 |
| C | 15 | 142 | 7504750 | 164290.02 | 192 | 193 | 45.7 |
| C | 15 | 126 | 2549946 | 55819.28 | 192 | 193 | 45.7 |
| C | 15 | 157 | 1927996 | 42203.53 | 192 | 193 | 45.7 |
| D | 8 | 192 | 8043762 | 256600.28 | 95 | 91 | 31.3 |
| D | 4 | 212 | 2281107 | 72766.45 | 95 | 91 | 31.3 |
| D | 4 | 216 | 967320 | 30855.47 | 95 | 91 | 31.3 |
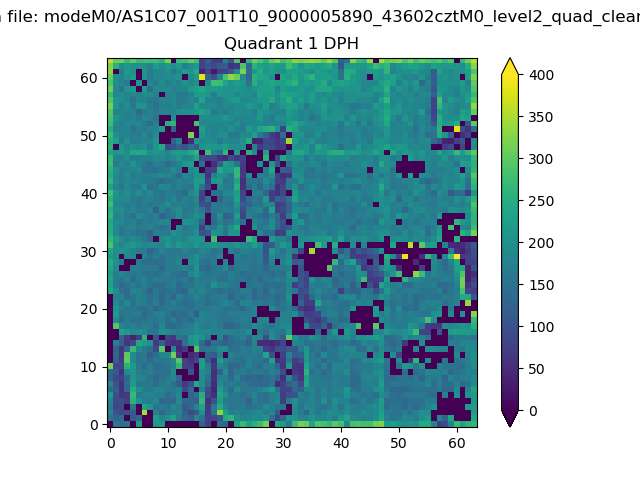
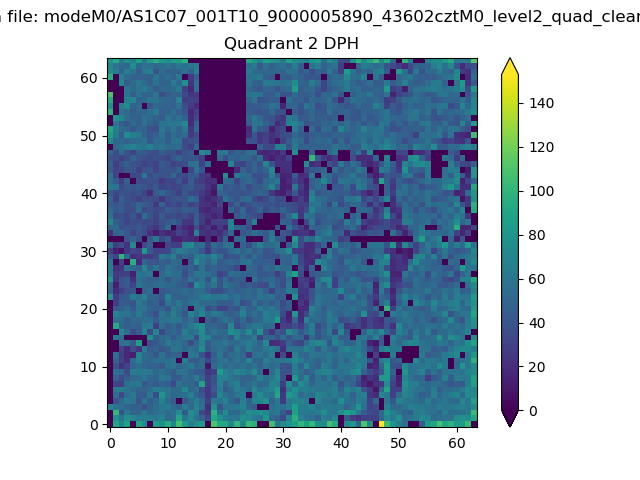
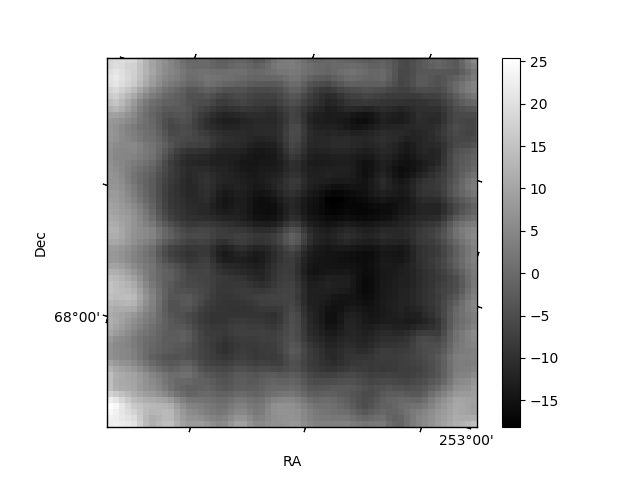
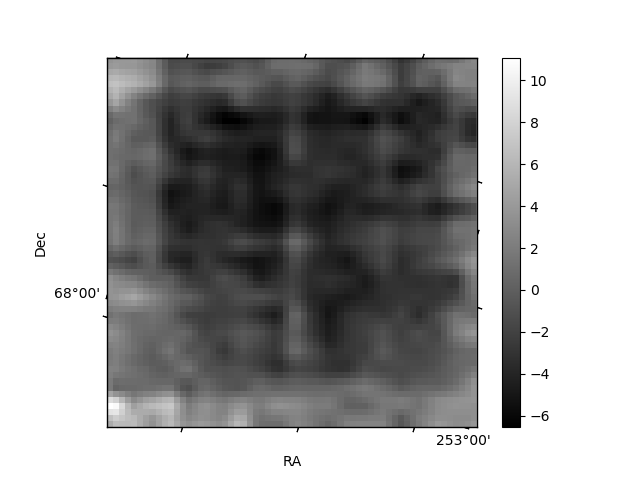
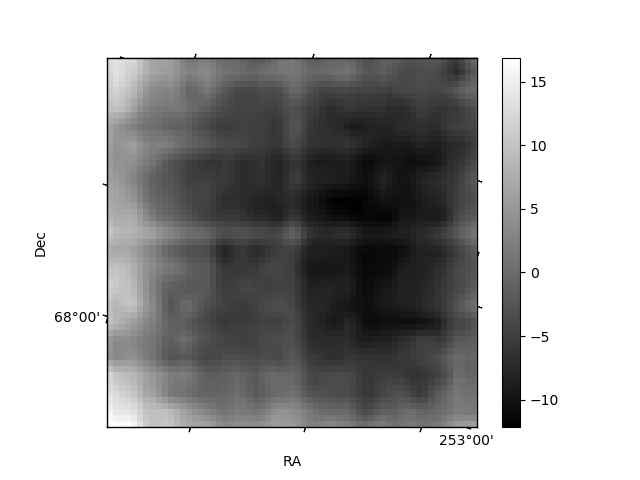
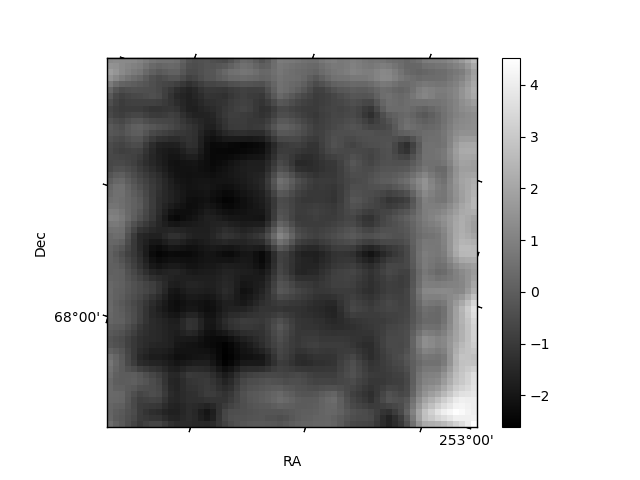
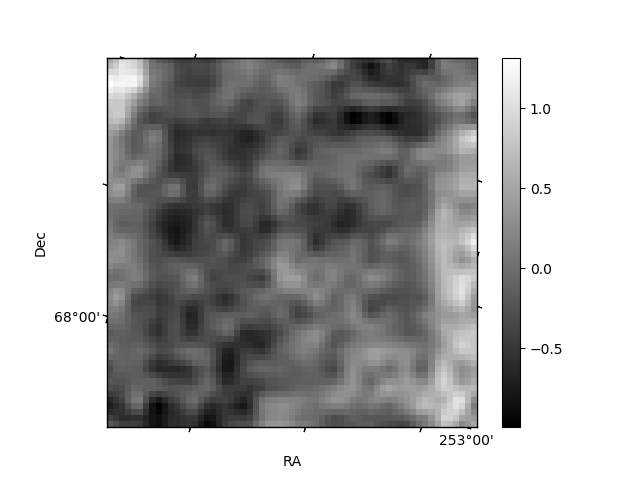
Histogram calculated using DETX and DETY for each event in the final _common_clean file
| Quadrant A | 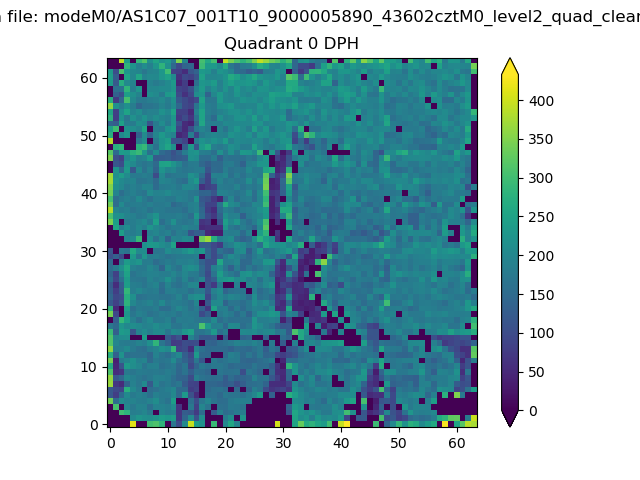 |
 |
Quadrant B |
|---|---|---|---|
| Quadrant D | 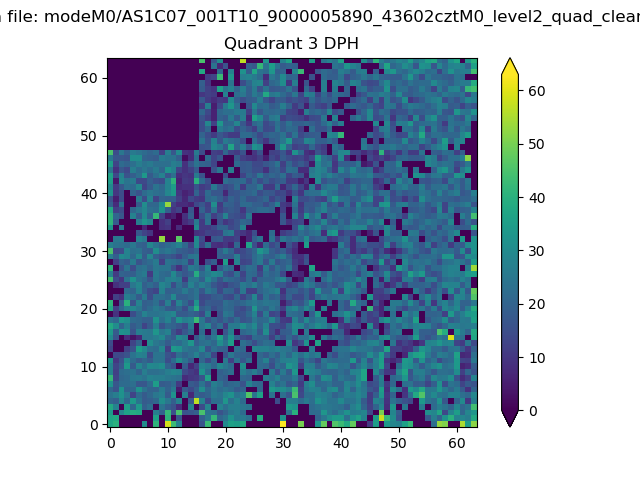 |
 |
Quadrant C |
| Plot type | Count rate plots | Images |
|---|---|---|
| Comparison with Poisson distribution Blue bars denote a histogram of data divided into 1 sec bins. Red curve is a Poisson curve with rate = median count rate of data. |
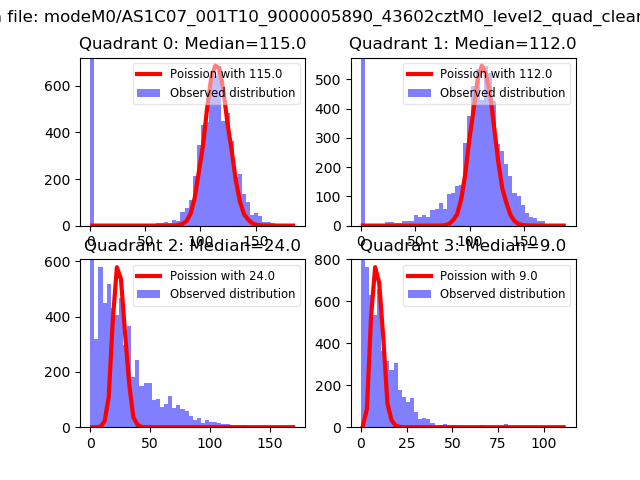 |
 |
| Quadrant-wise count rates Data is divided into 100 sec bins |
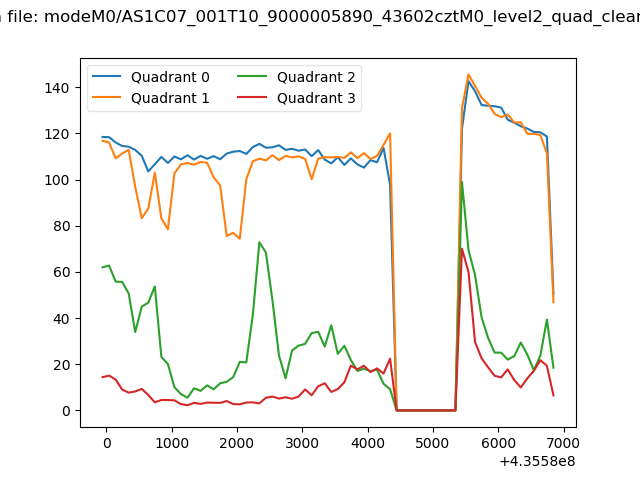 |
|
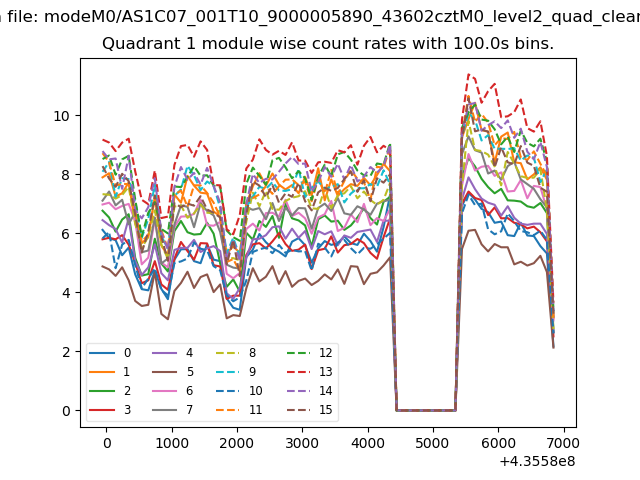
| Module-wise count rates for Quadrant A Data is divided into 100 sec bins |
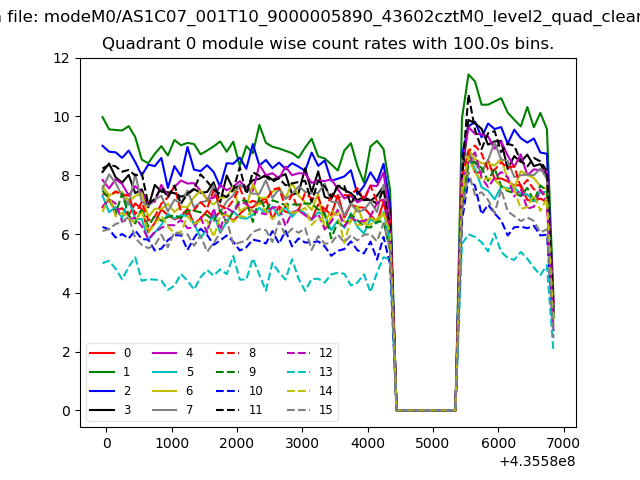 |
 |
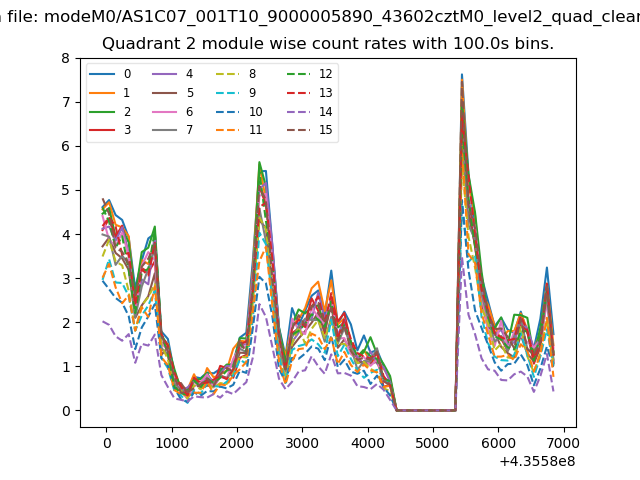
| Module-wise count rates for Quadrant B Data is divided into 100 sec bins |
 |
 |
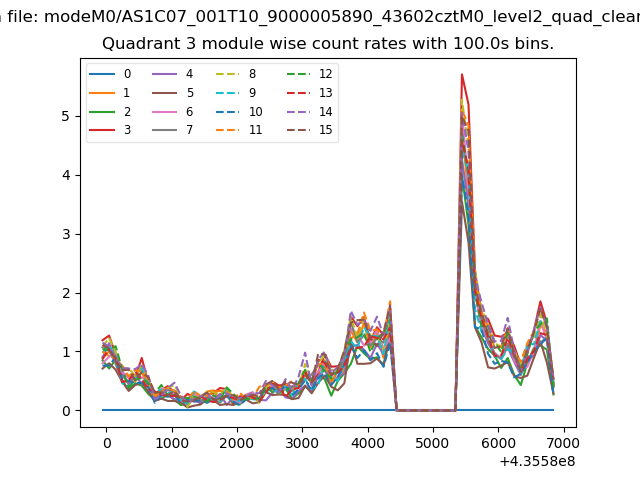
| Module-wise count rates for Quadrant C Data is divided into 100 sec bins |
 |
 |
| Module-wise count rates for Quadrant D Data is divided into 100 sec bins |
 |
 |
| Parameter | Plot |
|---|---|
| CZT HV Monitor | 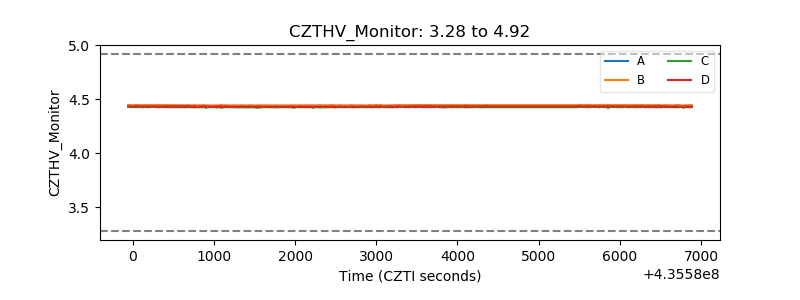 |
| D_VDD | 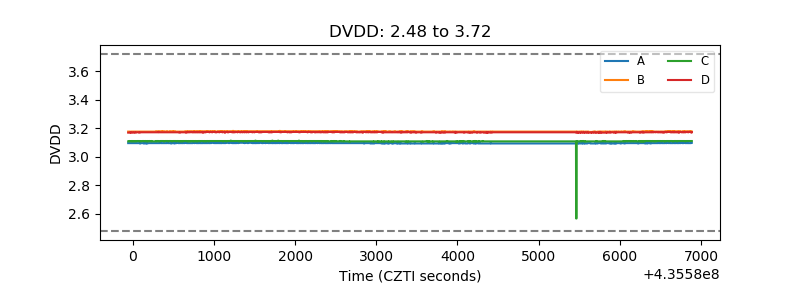 |
| Temperature 1 | 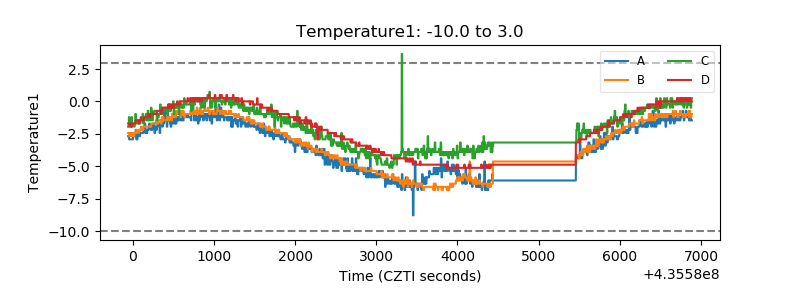 |
| Veto HV Monitor | 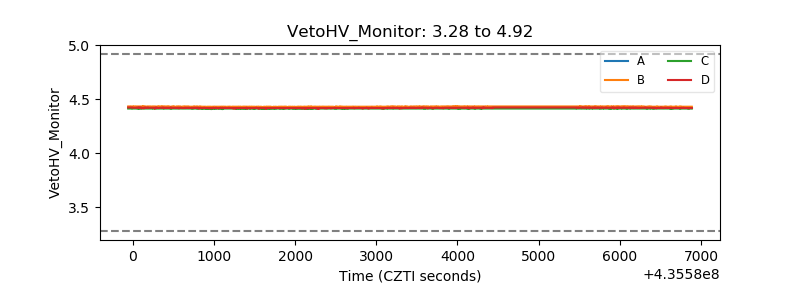 |
| Veto LLD | 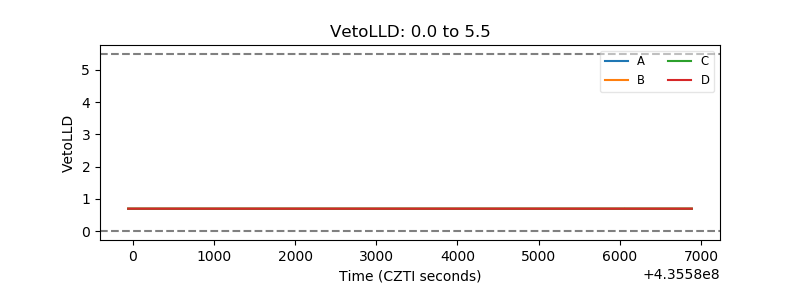 |
| Alpha Counter | 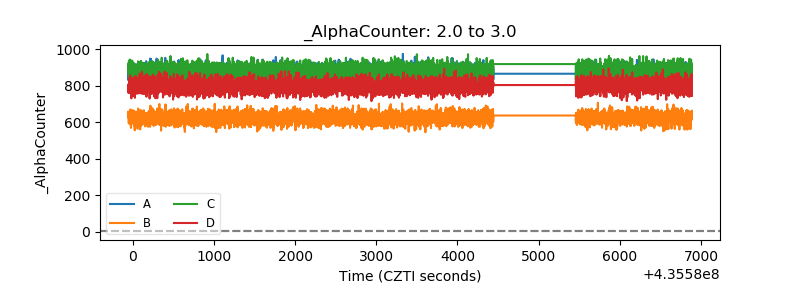 |
| _CPM_Rate | 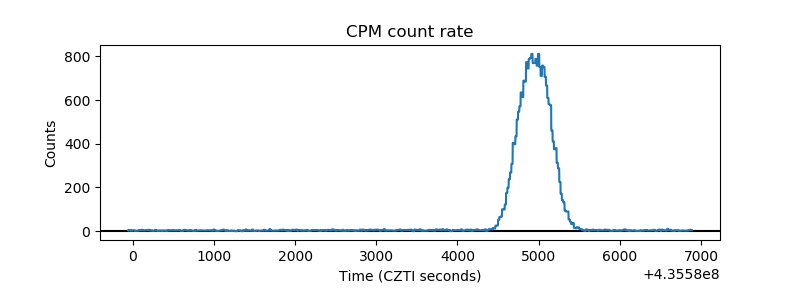 |
| CZT Counter | 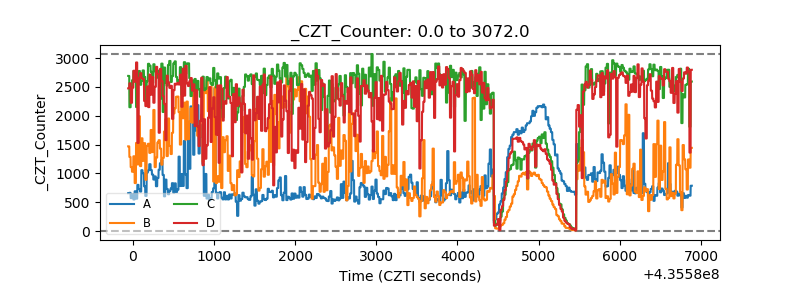 |
| +2.5 Volts monitor | 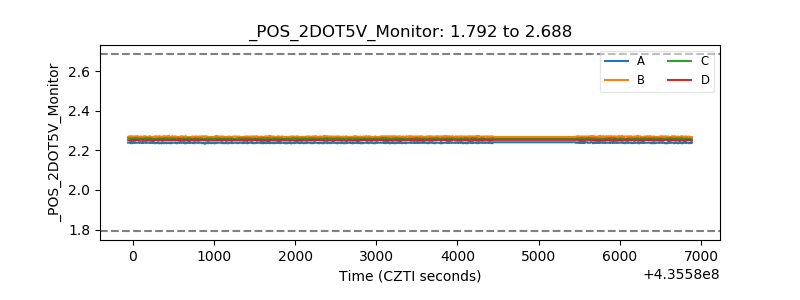 |
| +5 Volts monitor | 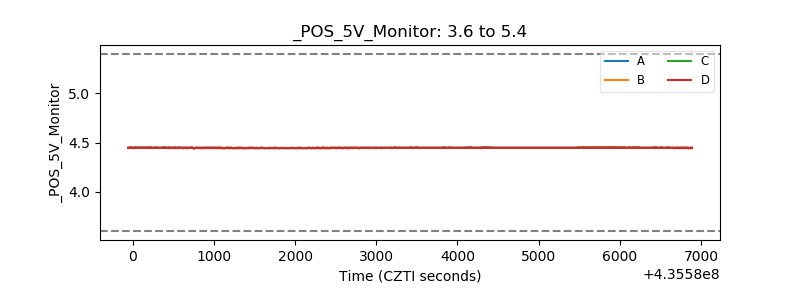 |
| _ROLL_ROT | 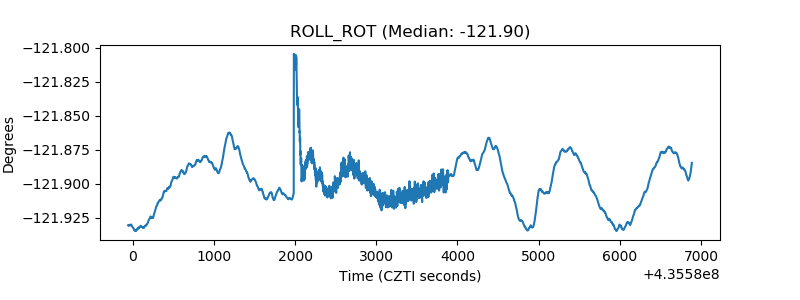 |
| _Roll_DEC | 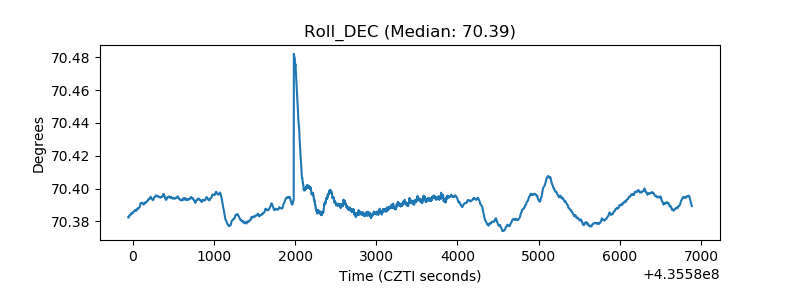 |
| _Roll_RA | 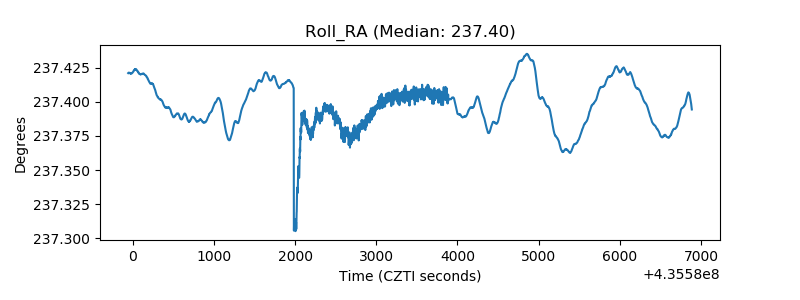 |
| Veto Counter | 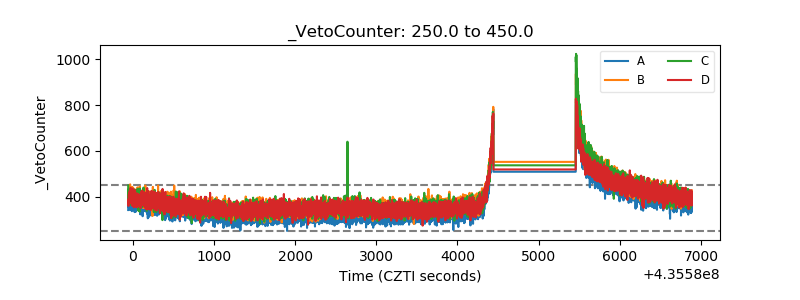 |