| Param | Original file | Final file |
|---|---|---|
| Filename | modeM0/AS1C07_001T10_9000005890_43603cztM0_level2.fits | modeM0/AS1C07_001T10_9000005890_43603cztM0_level2_quad_clean.evt |
| Size (bytes) | 1,264,394,880 | 67,991,040 |
| Size | 1.2 GB | 64.8 MB |
| Events in quadrant A | 4,507,746 | 762,975 |
| Events in quadrant B | 10,556,440 | 640,080 |
| Events in quadrant C | 16,268,942 | 147,316 |
| Events in quadrant D | 14,978,932 | 55,167 |
| Mode SS | |||
|---|---|---|---|
| Quadrant | BADHDUFLAG | Total packets | Discarded packets |
| A | 0 | 130 | 0 |
| B | 0 | 130 | 0 |
| C | 0 | 130 | 0 |
| D | 0 | 130 | 0 |
| Mode M9 | |||
|---|---|---|---|
| Quadrant | BADHDUFLAG | Total packets | Discarded packets |
| A | 0 | 11 | 0 |
| B | 0 | 11 | 0 |
| C | 0 | 11 | 0 |
| D | 0 | 11 | 0 |
| Mode M0 | |||
|---|---|---|---|
| Quadrant | BADHDUFLAG | Total packets | Discarded packets |
| A | 0 | 18249 | 3 |
| B | 0 | 35791 | 1 |
| C | 0 | 52718 | 1 |
| D | 0 | 48859 | 1 |
| Quadrant | Total seconds | Saturated seconds | Saturation percentage |
|---|---|---|---|
| A | 6386 | 113 | 1.769496% |
| B | 6387 | 2787 | 43.635510% |
| C | 6387 | 6316 | 98.888367% |
| D | 6387 | 6387 | 100.000000% |
Noise dominated data is calculated using 1-second bins in cleaned event files. If a bin has >2000 counts, and if more than 50% of those come from <1% of pixels, then it is considered to be noise-dominated and hence unusable.
| Quadrant | # 1 sec bins | Bins with >0 counts | Bins with >2000 counts | High rate bins dominated by noise | Noise dominated (total time) | Noise dominated (detector-on time) | Marked lightcurve |
|---|---|---|---|---|---|---|---|
| A | 7516 | 6386 | 18 | 18 | 0.24% | 0.28% | 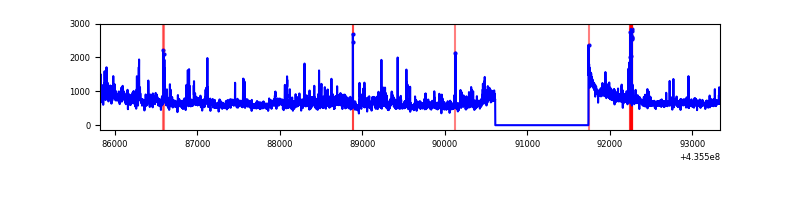 |
| B | 7517 | 6387 | 2393 | 2393 | 31.83% | 37.47% | 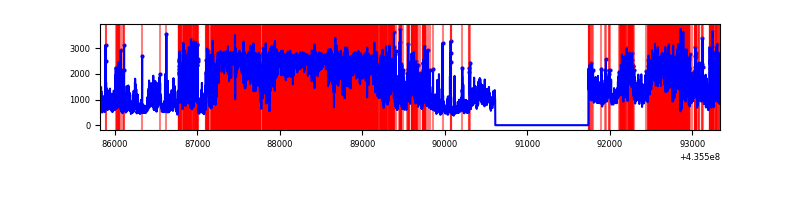 |
| C | 7516 | 6386 | 6106 | 6106 | 81.24% | 95.62% | 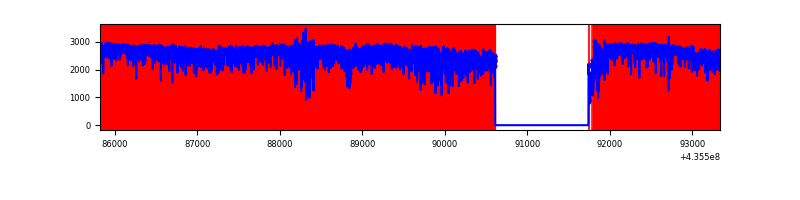 |
| D | 7516 | 6386 | 5290 | 5290 | 70.38% | 82.84% | 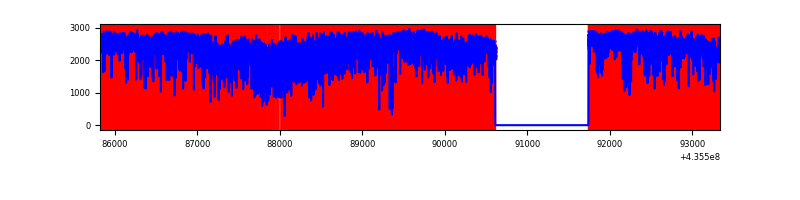 |
Top three noisy pixels from each quadrant. If the there are fewer than three noisy pixels in the level2.evt file, extra rows are filled as -1
| Pixel properties | Quadrant properties | ||||||
|---|---|---|---|---|---|---|---|
| Quadrant | DetID | PixID | Counts | Sigma | Mean | Median | Sigma |
| A | 10 | 83 | 848407 | 5712.49 | 734 | 721 | 148.4 |
| A | 12 | 189 | 261762 | 1759.13 | 734 | 721 | 148.4 |
| A | 15 | 222 | 164983 | 1106.95 | 734 | 721 | 148.4 |
| B | 4 | 206 | 6447201 | 55046.21 | 611 | 594 | 117.1 |
| B | 5 | 235 | 724471 | 6181.03 | 611 | 594 | 117.1 |
| B | 0 | 183 | 142990 | 1215.89 | 611 | 594 | 117.1 |
| C | 15 | 142 | 8133535 | 221945.8 | 154 | 156 | 36.6 |
| C | 15 | 174 | 3558685 | 97106.08 | 154 | 156 | 36.6 |
| C | 15 | 126 | 1720919 | 46956.64 | 154 | 156 | 36.6 |
| D | 8 | 192 | 10114501 | 364385.81 | 78 | 73 | 27.8 |
| D | 4 | 212 | 1940375 | 69901.98 | 78 | 73 | 27.8 |
| D | 4 | 216 | 808998 | 29142.61 | 78 | 73 | 27.8 |
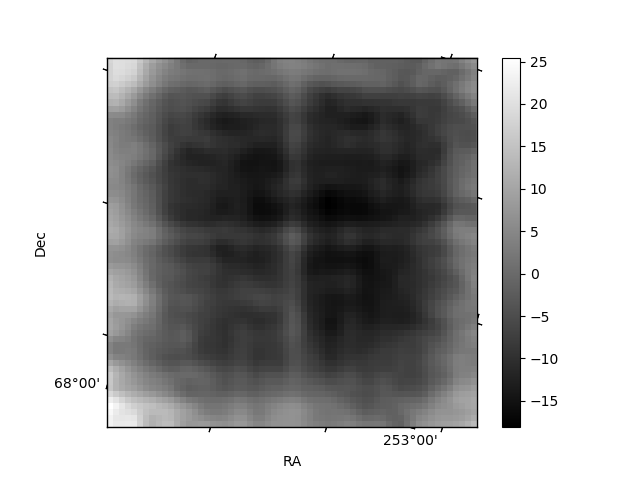
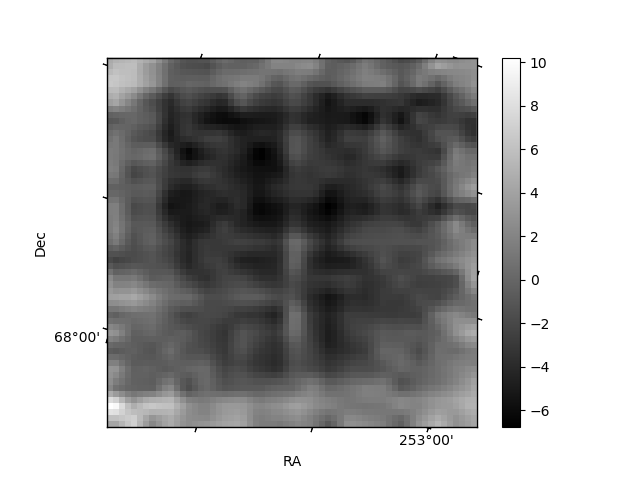
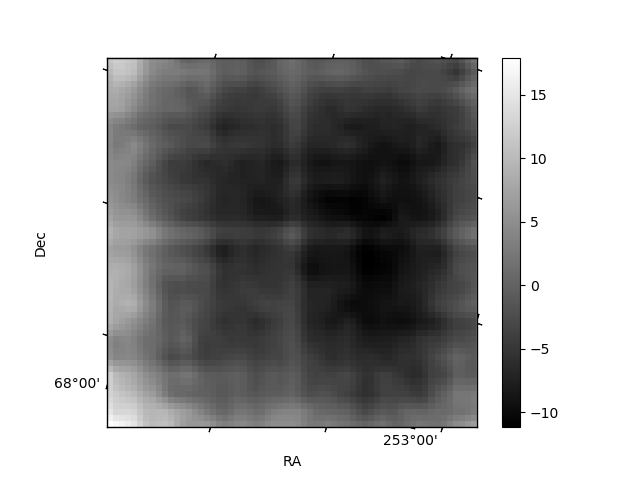
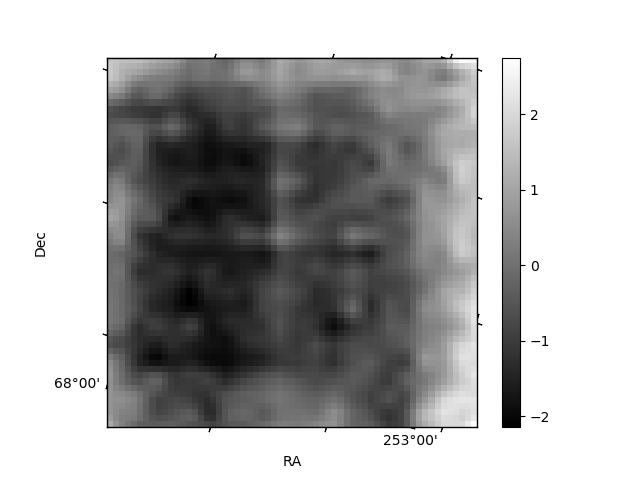
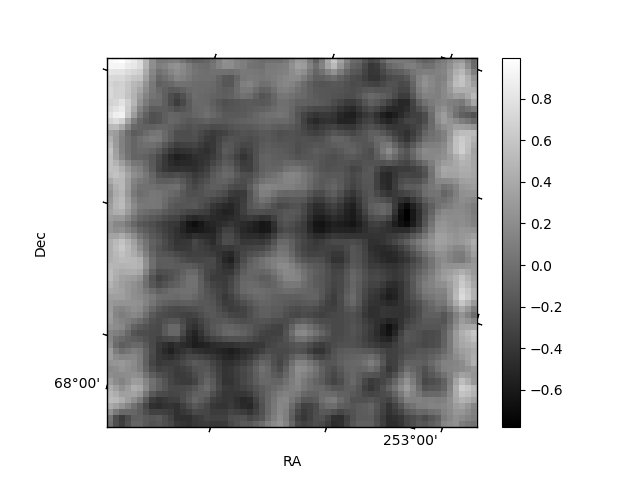
Histogram calculated using DETX and DETY for each event in the final _common_clean file
| Quadrant A | 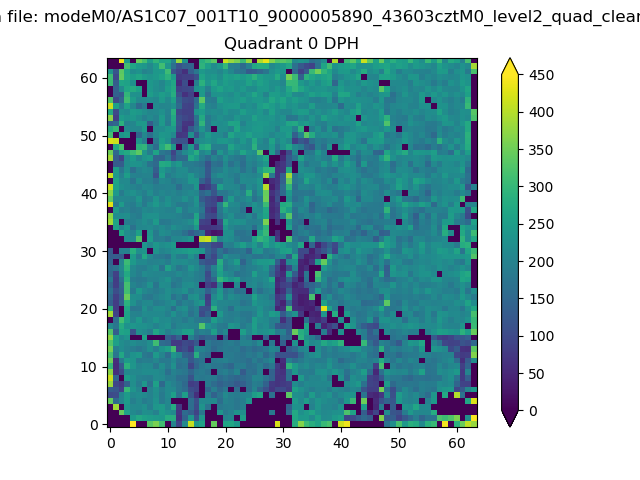 |
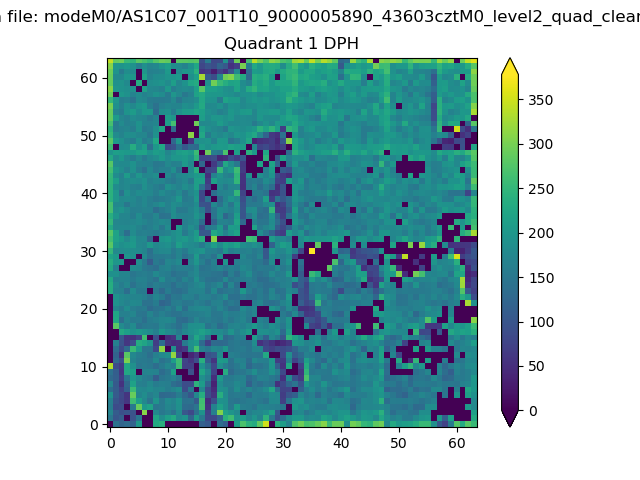 |
Quadrant B |
|---|---|---|---|
| Quadrant D | 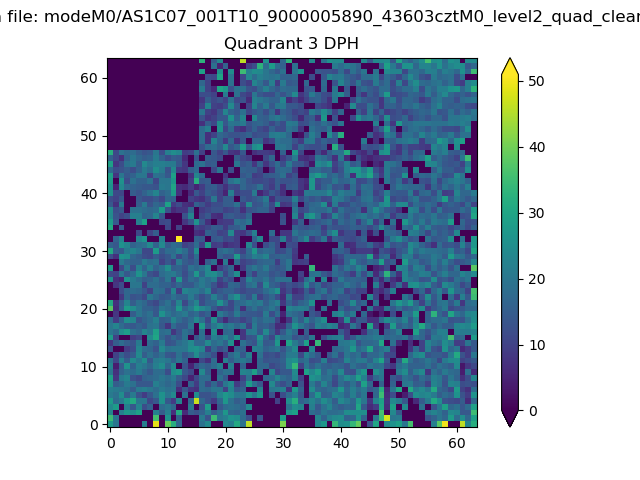 |
 |
Quadrant C |
| Plot type | Count rate plots | Images |
|---|---|---|
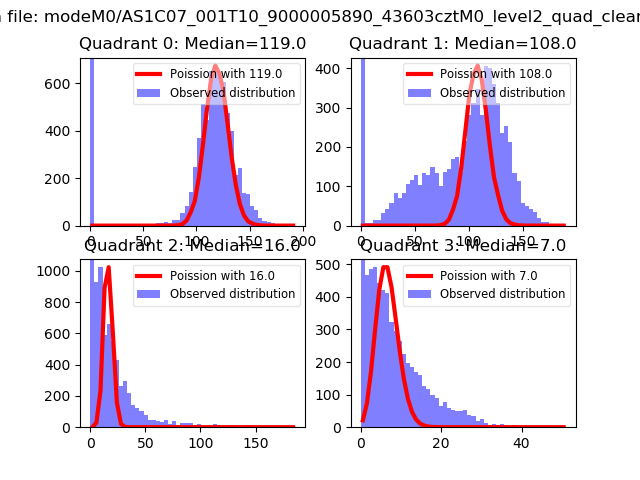
| Comparison with Poisson distribution Blue bars denote a histogram of data divided into 1 sec bins. Red curve is a Poisson curve with rate = median count rate of data. |
 |
 |
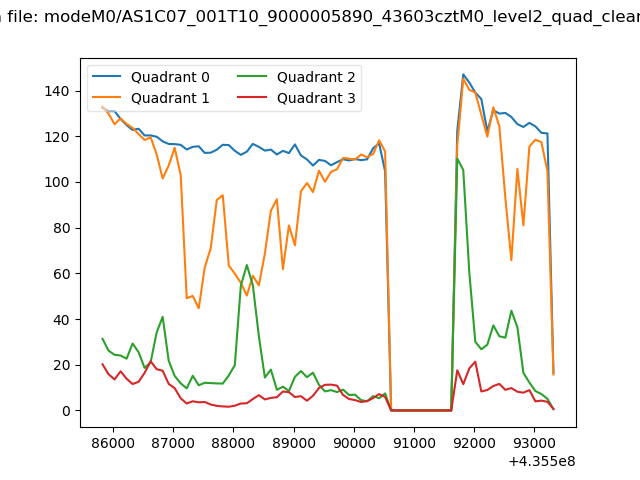
| Quadrant-wise count rates Data is divided into 100 sec bins |
 |
|
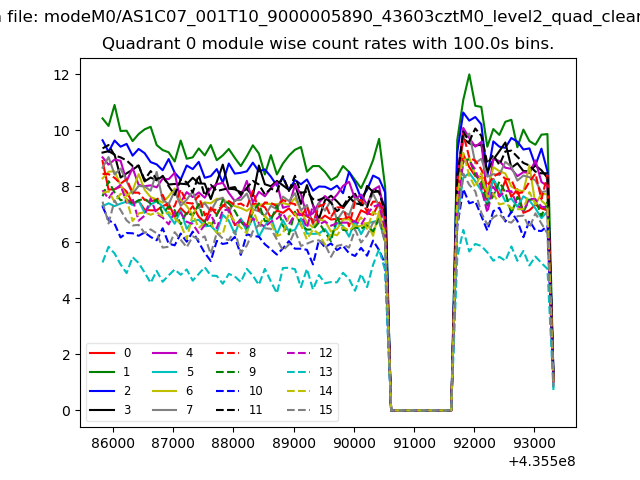
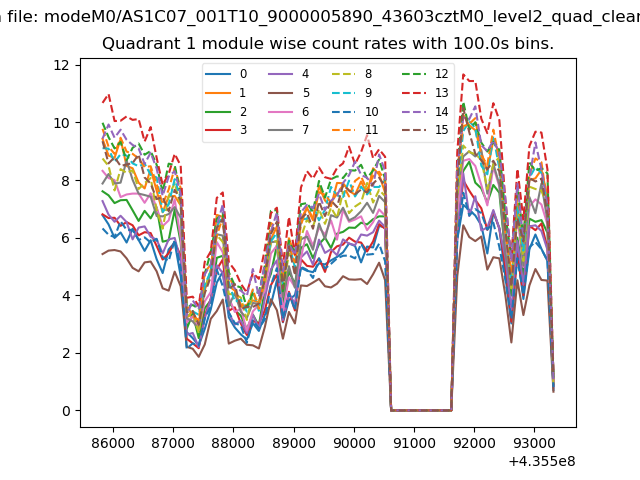
| Module-wise count rates for Quadrant A Data is divided into 100 sec bins |
 |
 |
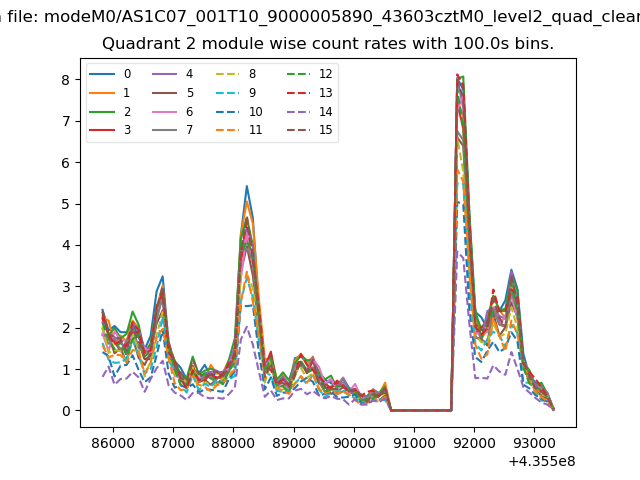
| Module-wise count rates for Quadrant B Data is divided into 100 sec bins |
 |
 |
| Module-wise count rates for Quadrant C Data is divided into 100 sec bins |
 |
 |
| Module-wise count rates for Quadrant D Data is divided into 100 sec bins |
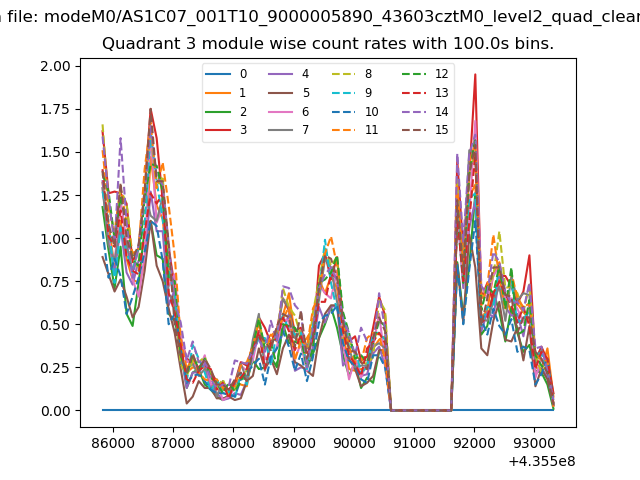 |
 |
| Parameter | Plot |
|---|---|
| CZT HV Monitor | 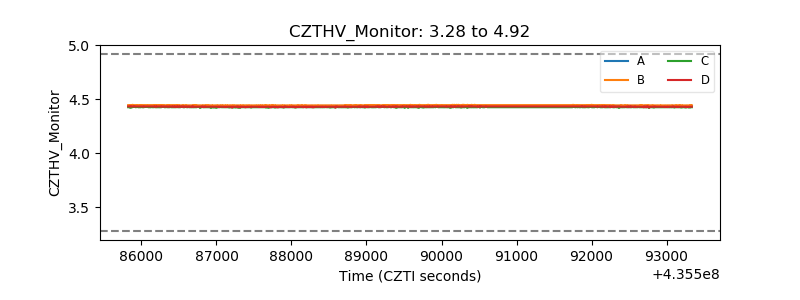 |
| D_VDD | 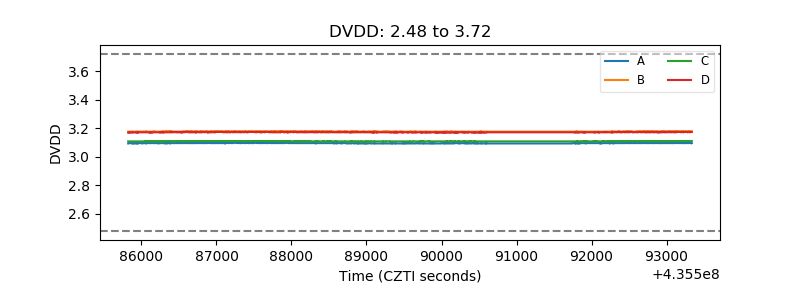 |
| Temperature 1 | 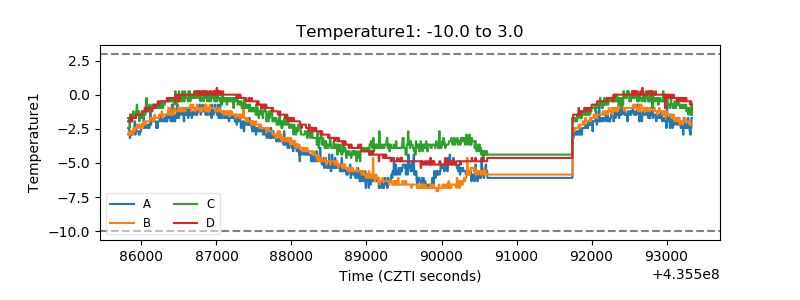 |
| Veto HV Monitor | 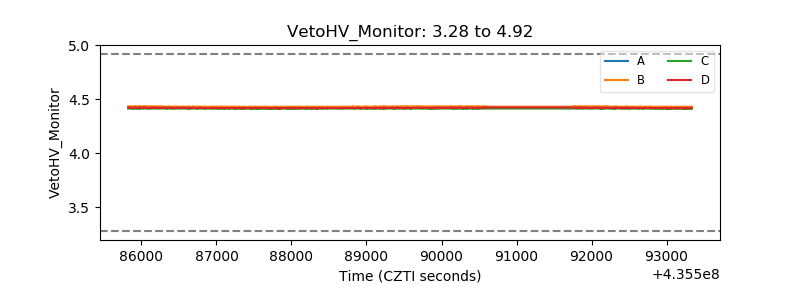 |
| Veto LLD | 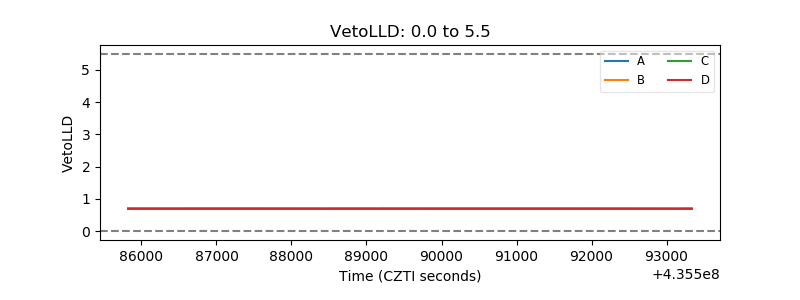 |
| Alpha Counter | 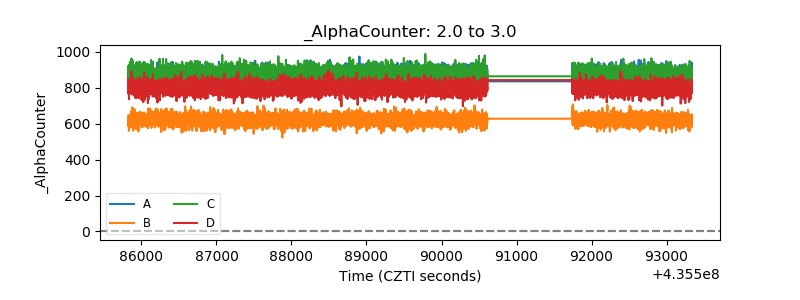 |
| _CPM_Rate | 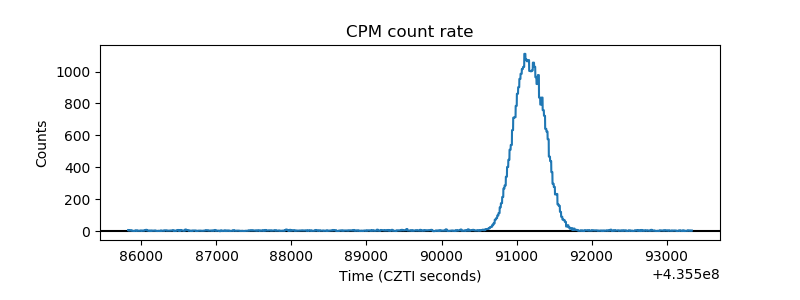 |
| CZT Counter |  |
| +2.5 Volts monitor | 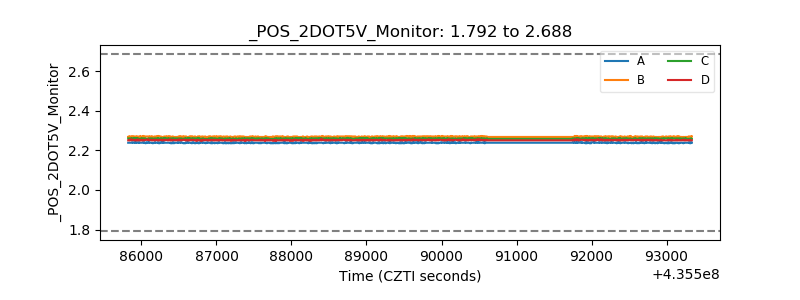 |
| +5 Volts monitor | 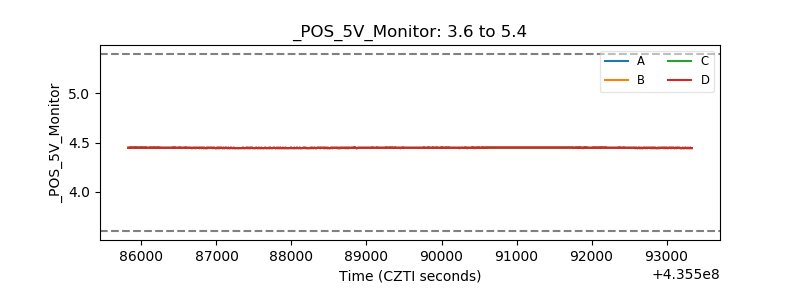 |
| _ROLL_ROT | 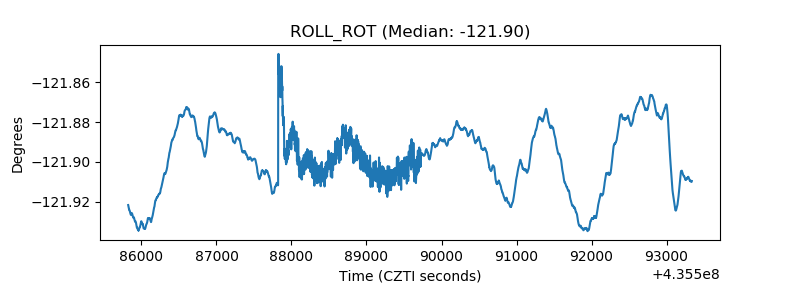 |
| _Roll_DEC | 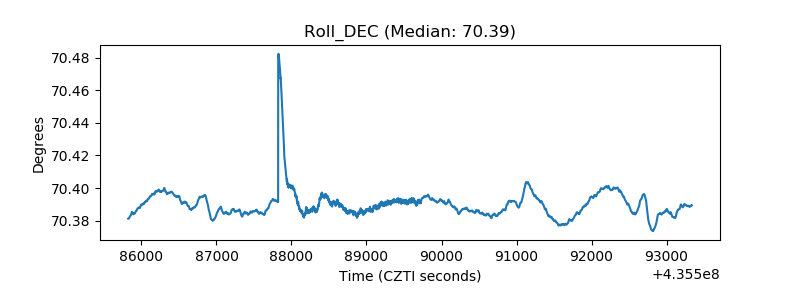 |
| _Roll_RA | 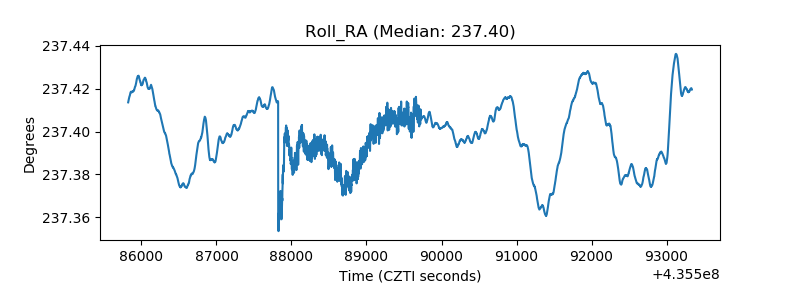 |
| Veto Counter | 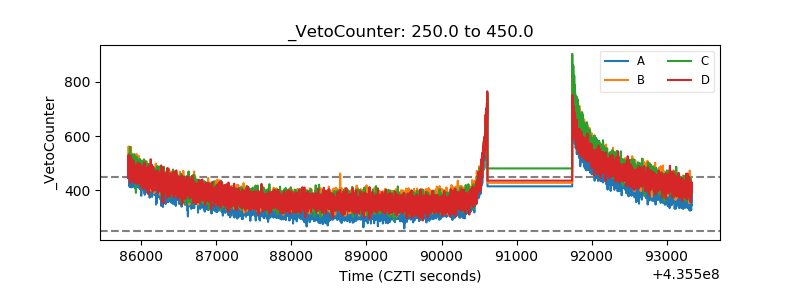 |