| Param | Original file | Final file |
|---|---|---|
| Filename | modeM0/AS1C07_001T10_9000005890_43604cztM0_level2.fits | modeM0/AS1C07_001T10_9000005890_43604cztM0_level2_quad_clean.evt |
| Size (bytes) | 1,031,590,080 | 61,695,360 |
| Size | 983.8 MB | 58.8 MB |
| Events in quadrant A | 3,777,309 | 661,707 |
| Events in quadrant B | 6,763,034 | 647,747 |
| Events in quadrant C | 14,447,247 | 111,810 |
| Events in quadrant D | 12,770,444 | 52,806 |
| Mode SS | |||
|---|---|---|---|
| Quadrant | BADHDUFLAG | Total packets | Discarded packets |
| A | 0 | 112 | 0 |
| B | 0 | 112 | 0 |
| C | 0 | 112 | 0 |
| D | 0 | 112 | 0 |
| Mode M9 | |||
|---|---|---|---|
| Quadrant | BADHDUFLAG | Total packets | Discarded packets |
| A | 0 | 12 | 0 |
| B | 0 | 12 | 0 |
| C | 0 | 12 | 0 |
| D | 0 | 12 | 0 |
| Mode M0 | |||
|---|---|---|---|
| Quadrant | BADHDUFLAG | Total packets | Discarded packets |
| A | 0 | 15056 | 1 |
| B | 0 | 24037 | 1 |
| C | 0 | 46796 | 1 |
| D | 0 | 41726 | 5 |
| Quadrant | Total seconds | Saturated seconds | Saturation percentage |
|---|---|---|---|
| A | 5550 | 101 | 1.819820% |
| B | 5551 | 784 | 14.123581% |
| C | 5551 | 5533 | 99.675734% |
| D | 5550 | 5550 | 100.000000% |
Noise dominated data is calculated using 1-second bins in cleaned event files. If a bin has >2000 counts, and if more than 50% of those come from <1% of pixels, then it is considered to be noise-dominated and hence unusable.
| Quadrant | # 1 sec bins | Bins with >0 counts | Bins with >2000 counts | High rate bins dominated by noise | Noise dominated (total time) | Noise dominated (detector-on time) | Marked lightcurve |
|---|---|---|---|---|---|---|---|
| A | 6720 | 5550 | 14 | 14 | 0.21% | 0.25% | 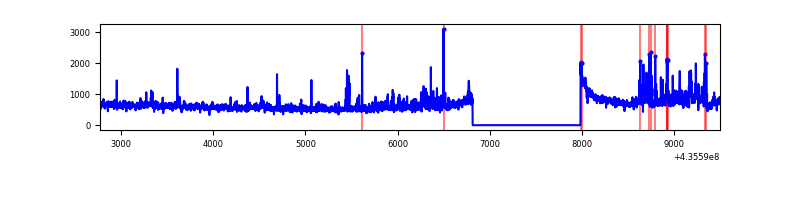 |
| B | 6721 | 5551 | 595 | 595 | 8.85% | 10.72% | 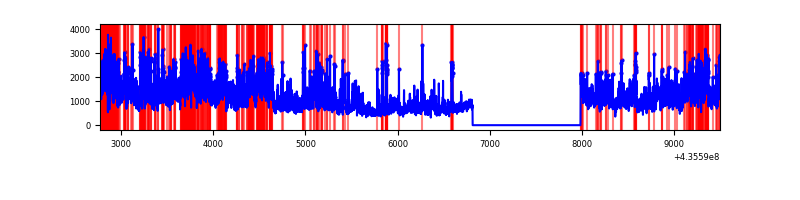 |
| C | 6720 | 5550 | 5428 | 5428 | 80.77% | 97.80% | 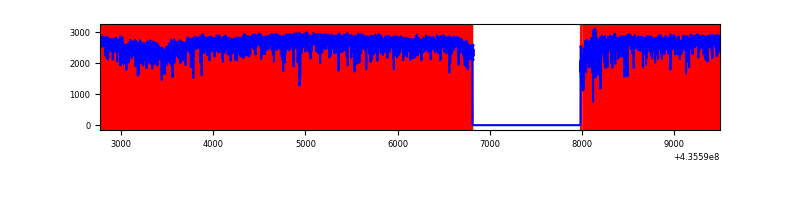 |
| D | 6719 | 5549 | 4400 | 4400 | 65.49% | 79.29% |  |
Top three noisy pixels from each quadrant. If the there are fewer than three noisy pixels in the level2.evt file, extra rows are filled as -1
| Pixel properties | Quadrant properties | ||||||
|---|---|---|---|---|---|---|---|
| Quadrant | DetID | PixID | Counts | Sigma | Mean | Median | Sigma |
| A | 10 | 83 | 744213 | 5695.49 | 635 | 622 | 130.6 |
| A | 2 | 79 | 189978 | 1450.36 | 635 | 622 | 130.6 |
| A | 15 | 222 | 108385 | 825.4 | 635 | 622 | 130.6 |
| B | 4 | 206 | 3026870 | 25984.26 | 608 | 592 | 116.5 |
| B | 5 | 235 | 584387 | 5012.59 | 608 | 592 | 116.5 |
| B | 0 | 183 | 257133 | 2202.71 | 608 | 592 | 116.5 |
| C | 15 | 142 | 7274618 | 247756.05 | 120 | 120 | 29.4 |
| C | 15 | 174 | 4765548 | 162301.73 | 120 | 120 | 29.4 |
| C | 15 | 126 | 1150271 | 39172.03 | 120 | 120 | 29.4 |
| D | 8 | 192 | 7815451 | 308015.53 | 70 | 66 | 25.4 |
| D | 4 | 212 | 1667534 | 65717.3 | 70 | 66 | 25.4 |
| D | 4 | 216 | 1435192 | 56560.37 | 70 | 66 | 25.4 |
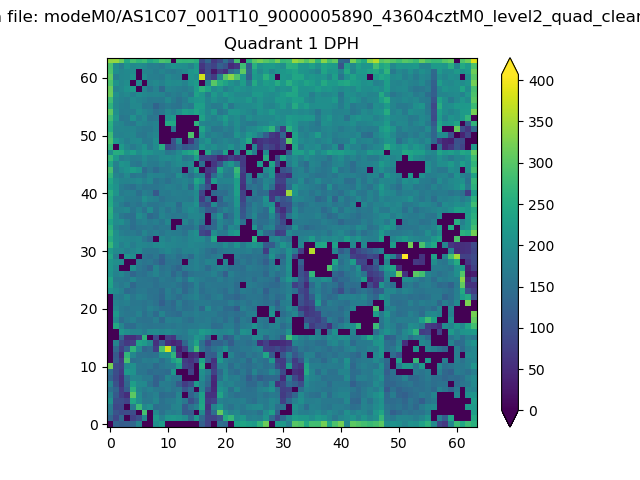
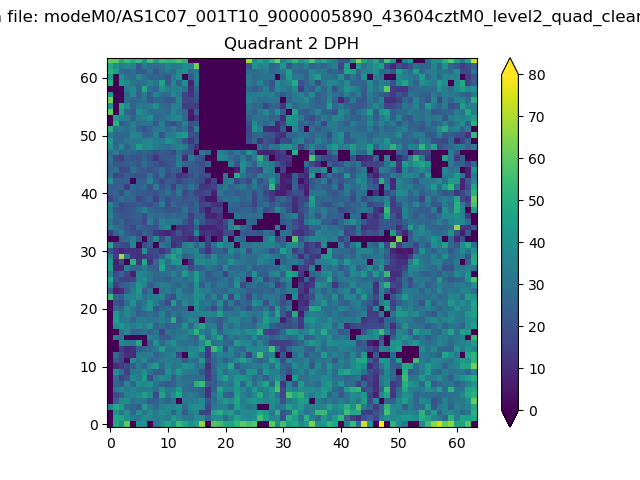
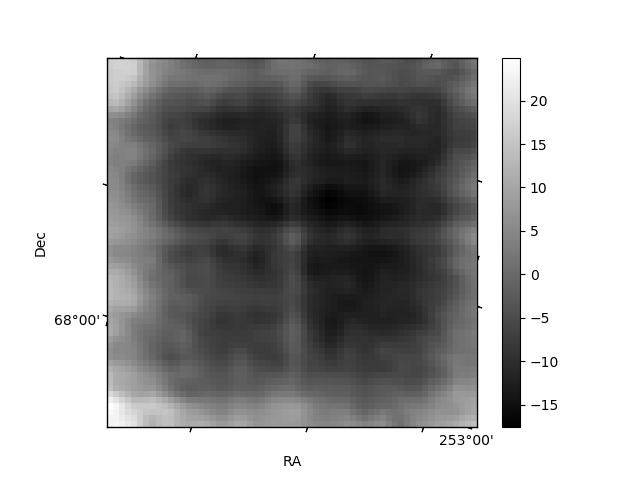
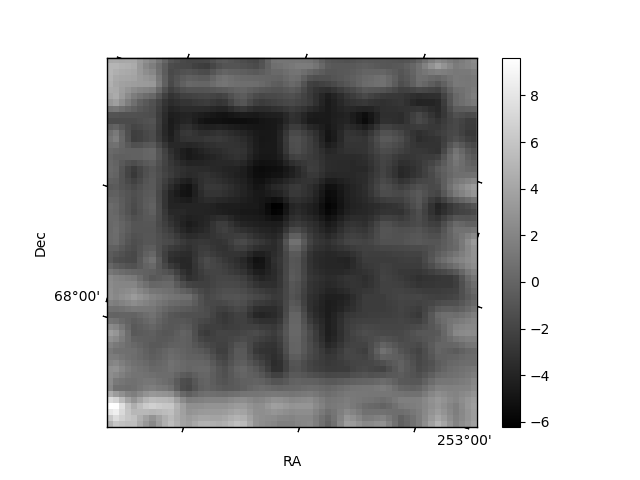
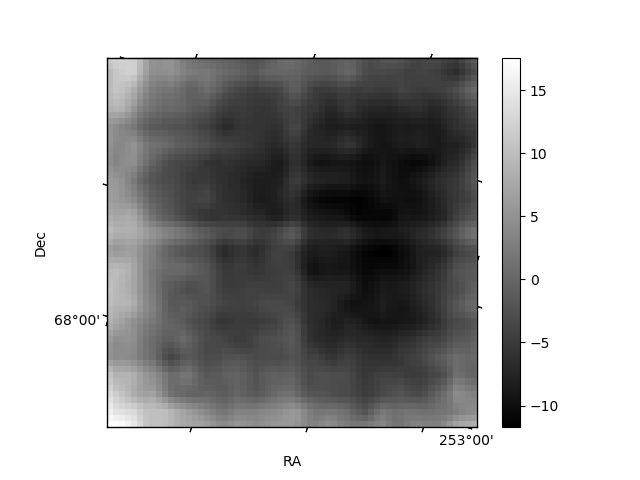
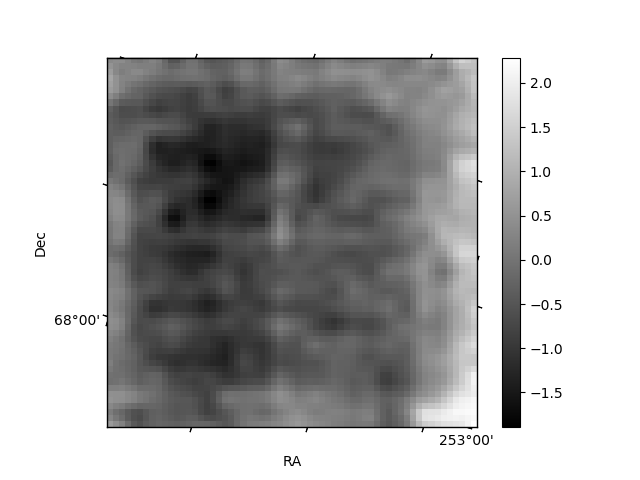
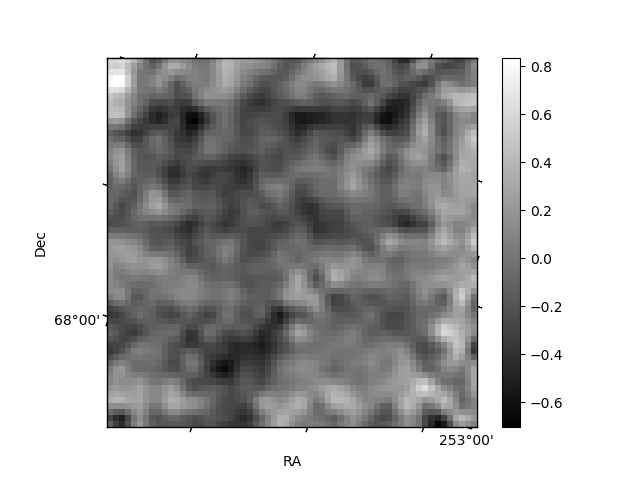
Histogram calculated using DETX and DETY for each event in the final _common_clean file
| Quadrant A | 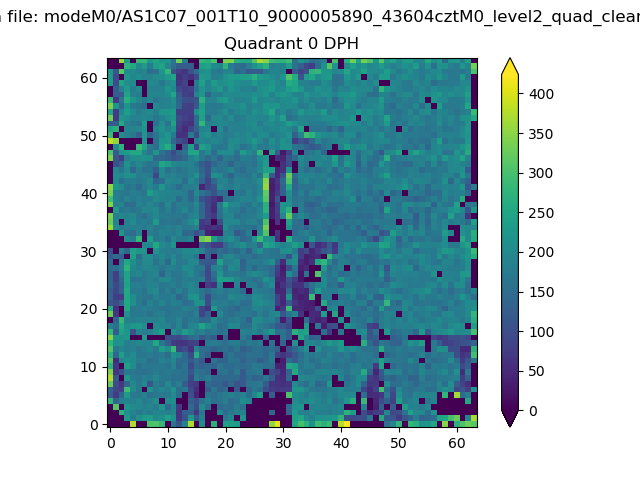 |
 |
Quadrant B |
|---|---|---|---|
| Quadrant D | 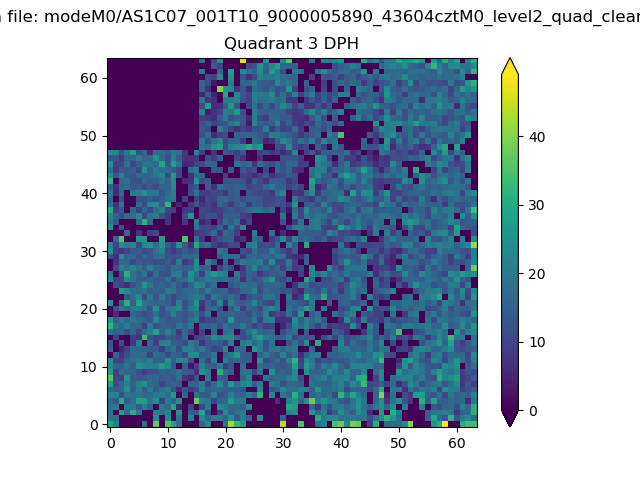 |
 |
Quadrant C |
| Plot type | Count rate plots | Images |
|---|---|---|
| Comparison with Poisson distribution Blue bars denote a histogram of data divided into 1 sec bins. Red curve is a Poisson curve with rate = median count rate of data. |
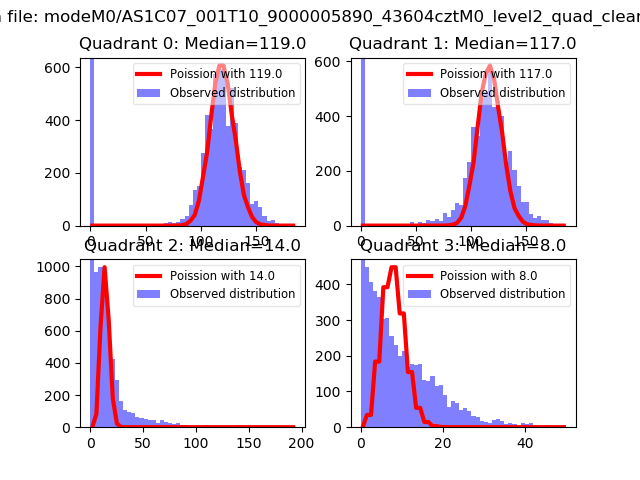 |
 |
| Quadrant-wise count rates Data is divided into 100 sec bins |
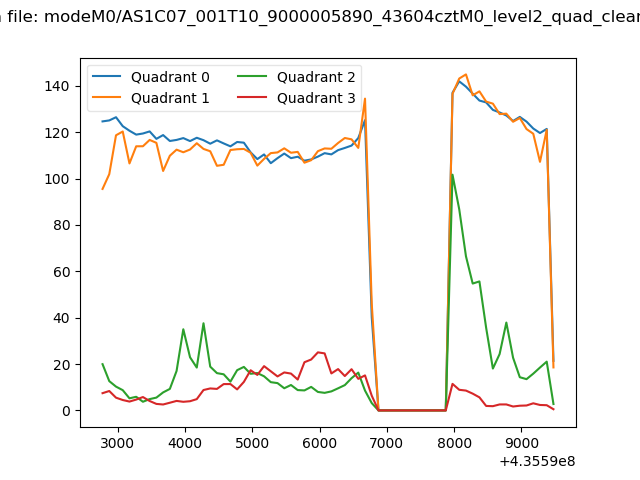 |
|
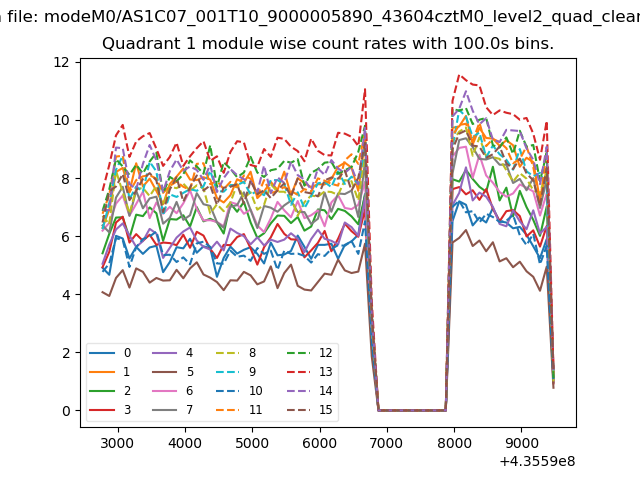
| Module-wise count rates for Quadrant A Data is divided into 100 sec bins |
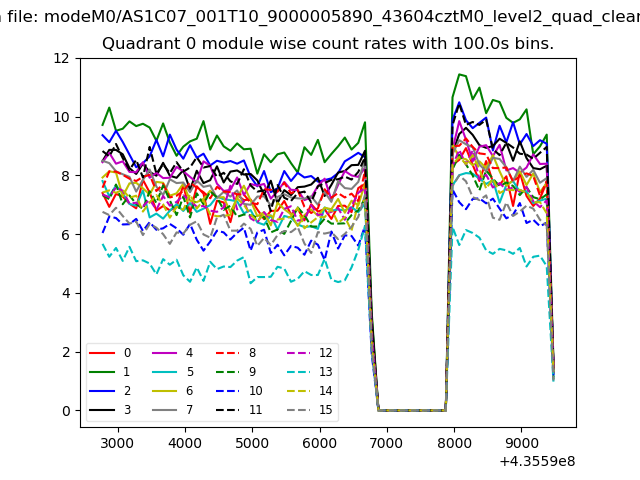 |
 |
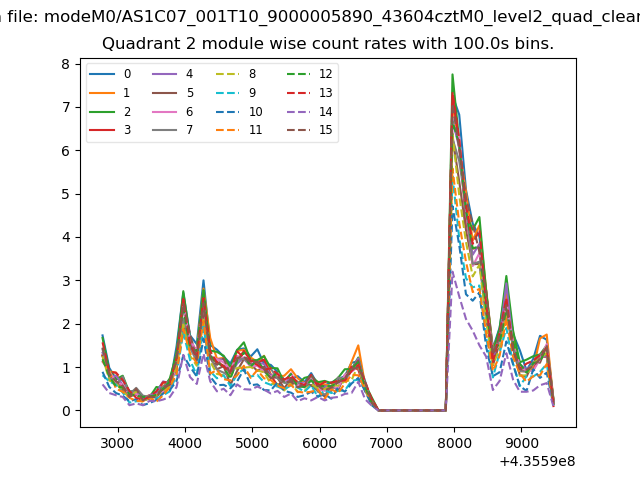
| Module-wise count rates for Quadrant B Data is divided into 100 sec bins |
 |
 |
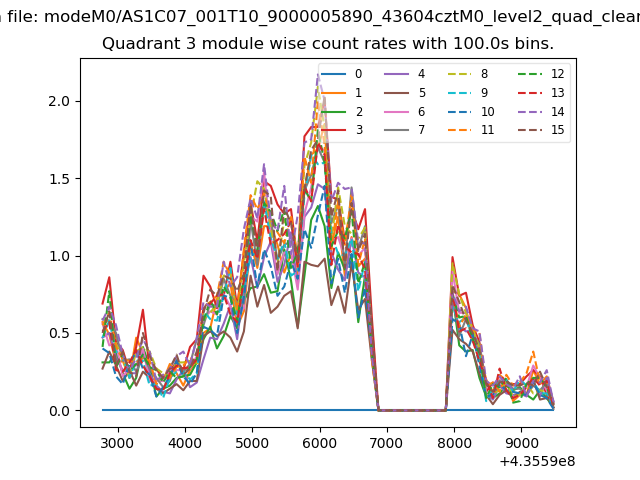
| Module-wise count rates for Quadrant C Data is divided into 100 sec bins |
 |
 |
| Module-wise count rates for Quadrant D Data is divided into 100 sec bins |
 |
 |
| Parameter | Plot |
|---|---|
| CZT HV Monitor | 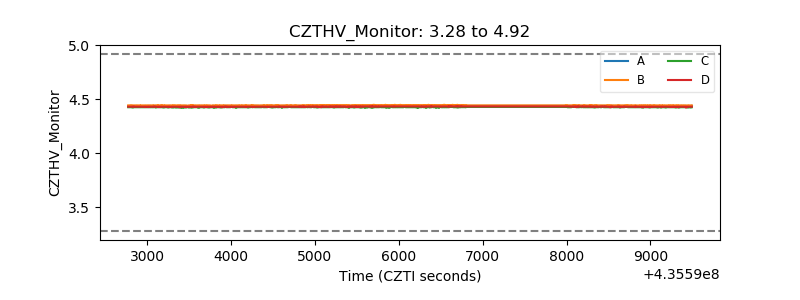 |
| D_VDD | 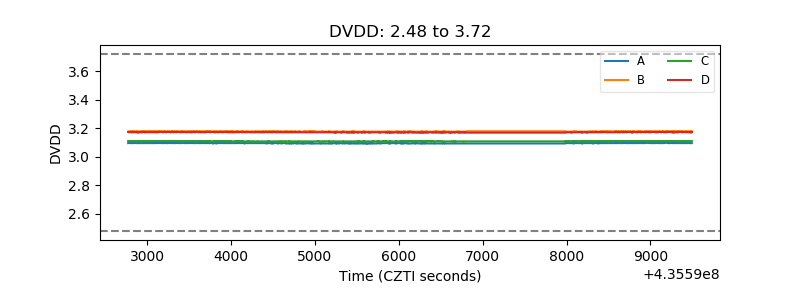 |
| Temperature 1 | 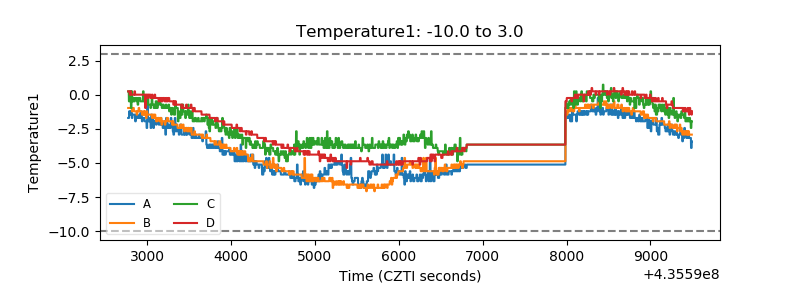 |
| Veto HV Monitor | 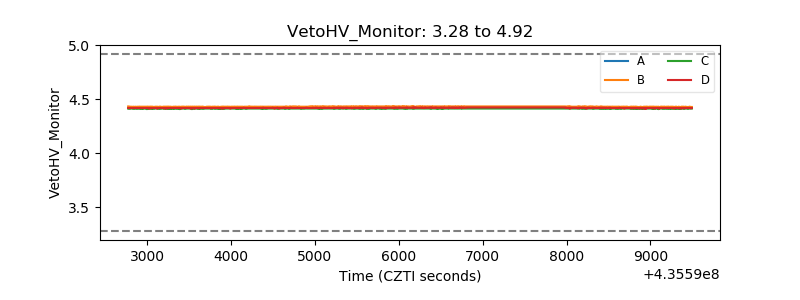 |
| Veto LLD | 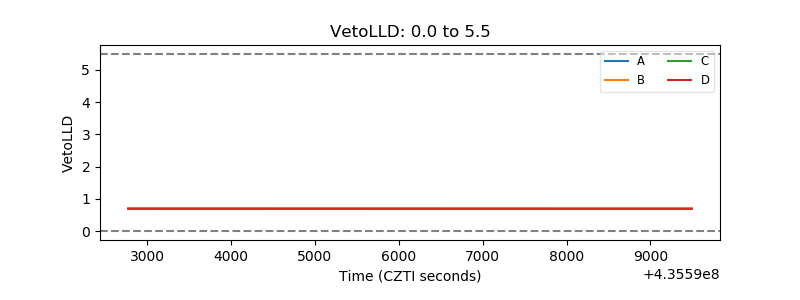 |
| Alpha Counter | 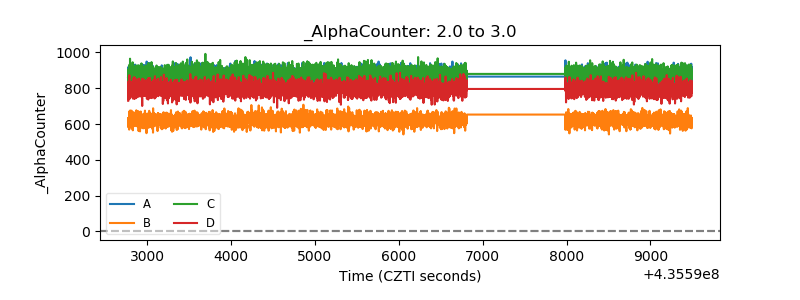 |
| _CPM_Rate | 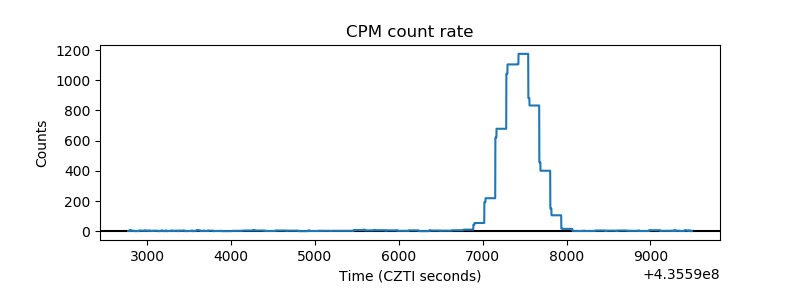 |
| CZT Counter | 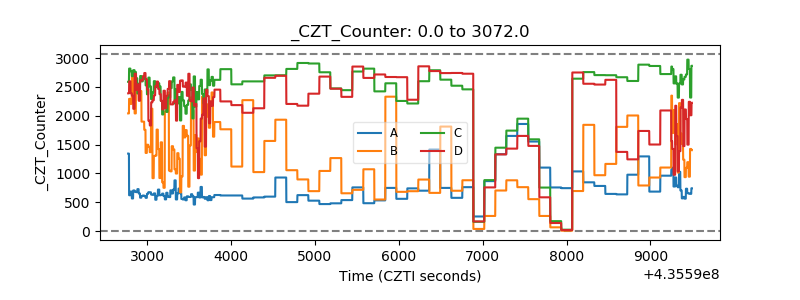 |
| +2.5 Volts monitor | 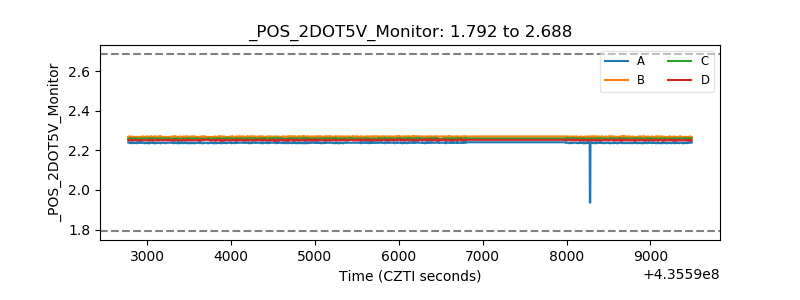 |
| +5 Volts monitor | 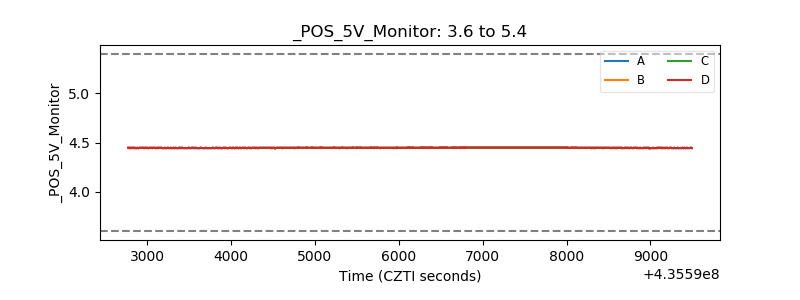 |
| _ROLL_ROT | 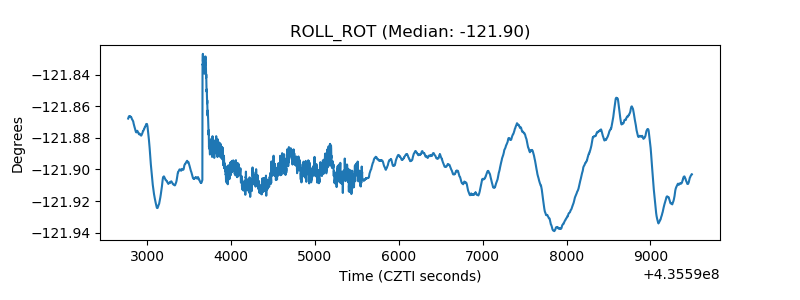 |
| _Roll_DEC | 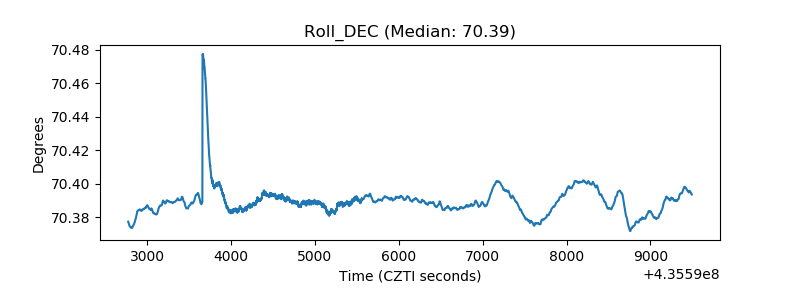 |
| _Roll_RA | 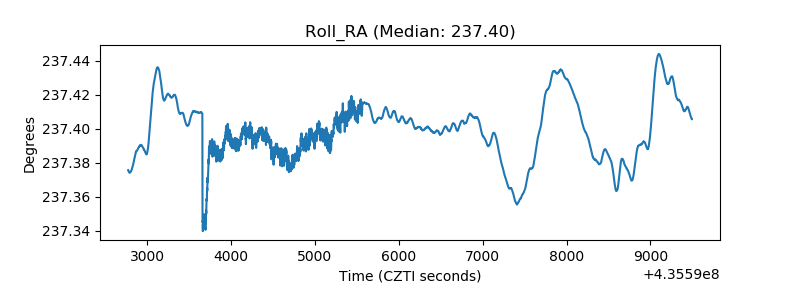 |
| Veto Counter | 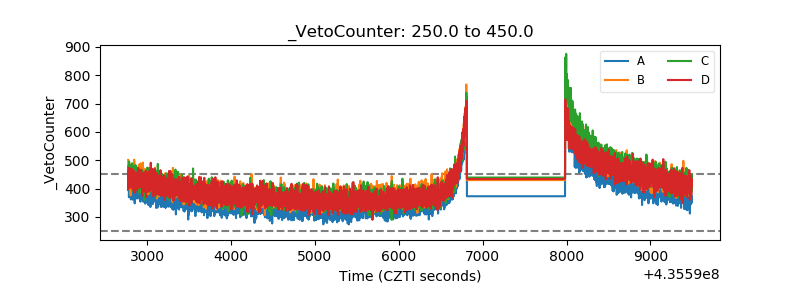 |