| Param | Original file | Final file |
|---|---|---|
| Filename | modeM0/AS1C07_001T10_9000005890_43605cztM0_level2.fits | modeM0/AS1C07_001T10_9000005890_43605cztM0_level2_quad_clean.evt |
| Size (bytes) | 1,135,552,320 | 63,397,440 |
| Size | 1.1 GB | 60.5 MB |
| Events in quadrant A | 4,492,759 | 678,017 |
| Events in quadrant B | 9,191,565 | 591,267 |
| Events in quadrant C | 14,998,207 | 171,716 |
| Events in quadrant D | 12,906,469 | 67,836 |
| Mode SS | |||
|---|---|---|---|
| Quadrant | BADHDUFLAG | Total packets | Discarded packets |
| A | 0 | 118 | 0 |
| B | 0 | 118 | 0 |
| C | 0 | 118 | 0 |
| D | 0 | 118 | 0 |
| Mode M9 | |||
|---|---|---|---|
| Quadrant | BADHDUFLAG | Total packets | Discarded packets |
| A | 0 | 12 | 0 |
| B | 0 | 12 | 0 |
| C | 0 | 12 | 0 |
| D | 0 | 12 | 0 |
| Mode M0 | |||
|---|---|---|---|
| Quadrant | BADHDUFLAG | Total packets | Discarded packets |
| A | 0 | 17571 | 1 |
| B | 0 | 31333 | 1 |
| C | 0 | 48487 | 1 |
| D | 0 | 42279 | 7 |
| Quadrant | Total seconds | Saturated seconds | Saturation percentage |
|---|---|---|---|
| A | 5780 | 242 | 4.186851% |
| B | 5781 | 2320 | 40.131465% |
| C | 5781 | 5671 | 98.097215% |
| D | 5780 | 5753 | 99.532872% |
Noise dominated data is calculated using 1-second bins in cleaned event files. If a bin has >2000 counts, and if more than 50% of those come from <1% of pixels, then it is considered to be noise-dominated and hence unusable.
| Quadrant | # 1 sec bins | Bins with >0 counts | Bins with >2000 counts | High rate bins dominated by noise | Noise dominated (total time) | Noise dominated (detector-on time) | Marked lightcurve |
|---|---|---|---|---|---|---|---|
| A | 6945 | 5780 | 83 | 83 | 1.20% | 1.44% | 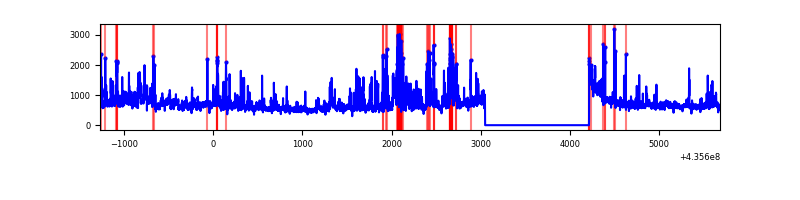 |
| B | 6946 | 5781 | 1948 | 1948 | 28.04% | 33.70% | 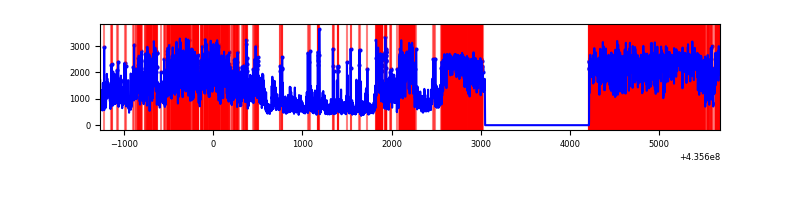 |
| C | 6946 | 5781 | 5563 | 5563 | 80.09% | 96.23% | 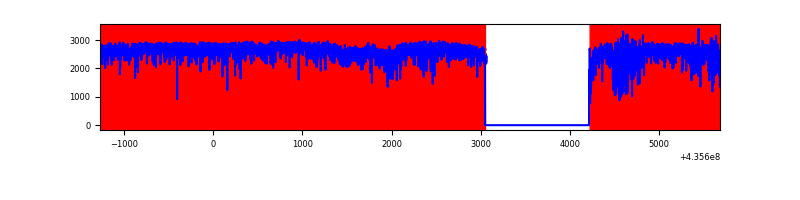 |
| D | 6944 | 5779 | 4321 | 4321 | 62.23% | 74.77% | 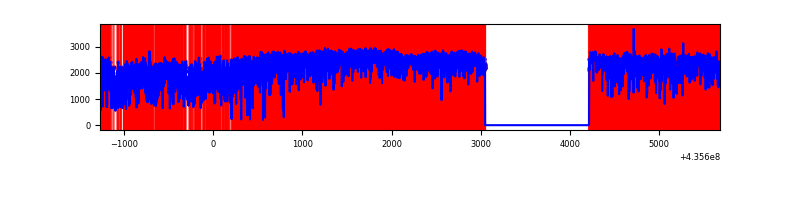 |
Top three noisy pixels from each quadrant. If the there are fewer than three noisy pixels in the level2.evt file, extra rows are filled as -1
| Pixel properties | Quadrant properties | ||||||
|---|---|---|---|---|---|---|---|
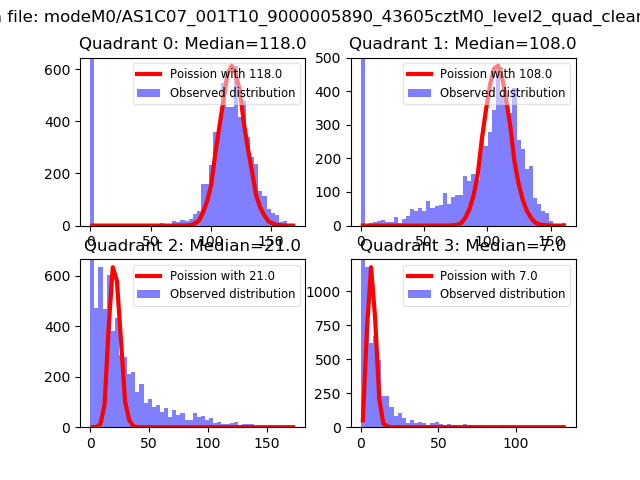
| Quadrant | DetID | PixID | Counts | Sigma | Mean | Median | Sigma |
| A | 10 | 83 | 772165 | 5797.01 | 646 | 634 | 133.1 |
| A | 2 | 79 | 665619 | 4996.46 | 646 | 634 | 133.1 |
| A | 15 | 223 | 223854 | 1677.2 | 646 | 634 | 133.1 |
| B | 4 | 206 | 4531624 | 43310.59 | 554 | 539 | 104.6 |
| B | 5 | 235 | 1695229 | 16198.77 | 554 | 539 | 104.6 |
| B | 0 | 183 | 220008 | 2097.8 | 554 | 539 | 104.6 |
| C | 15 | 142 | 8212874 | 194163.65 | 177 | 178 | 42.3 |
| C | 15 | 174 | 4006716 | 94722.13 | 177 | 178 | 42.3 |
| C | 15 | 126 | 1459709 | 34506.07 | 177 | 178 | 42.3 |
| D | 8 | 192 | 6549489 | 240641.36 | 87 | 83 | 27.2 |
| D | 4 | 212 | 2656977 | 97620.85 | 87 | 83 | 27.2 |
| D | 4 | 216 | 1257411 | 46197.34 | 87 | 83 | 27.2 |
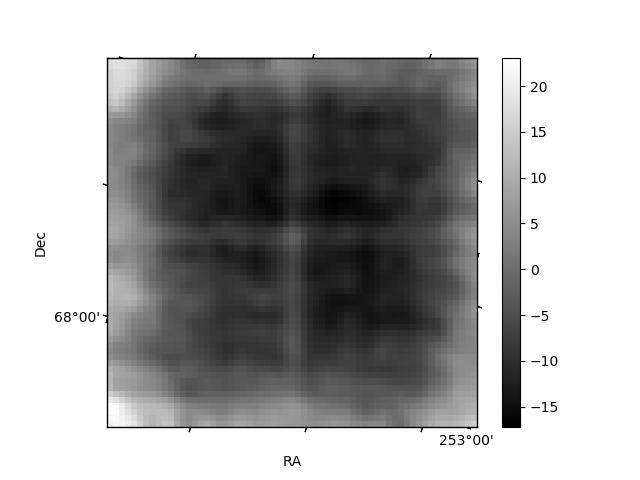
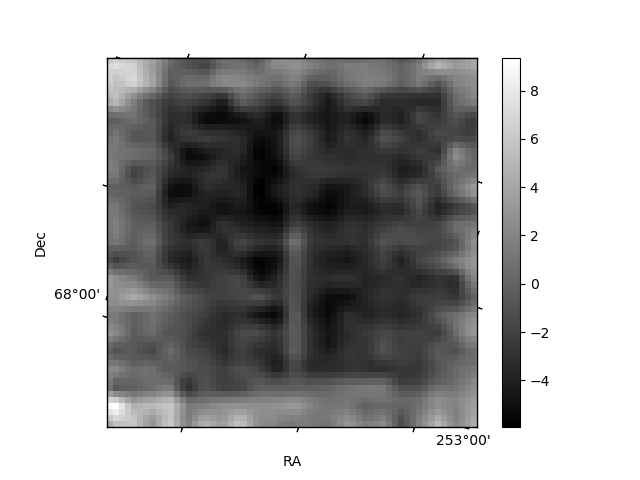
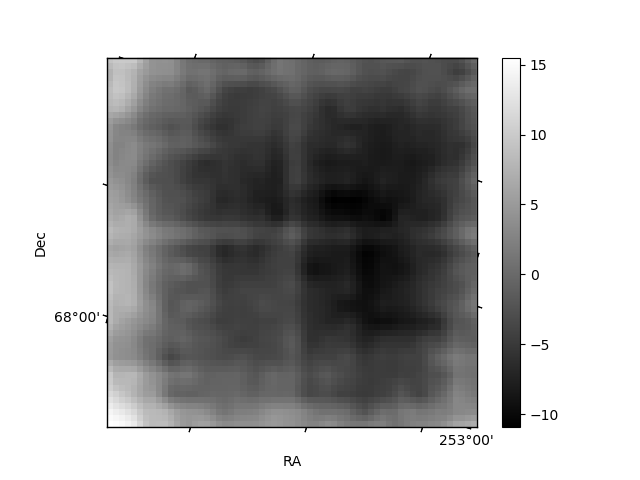
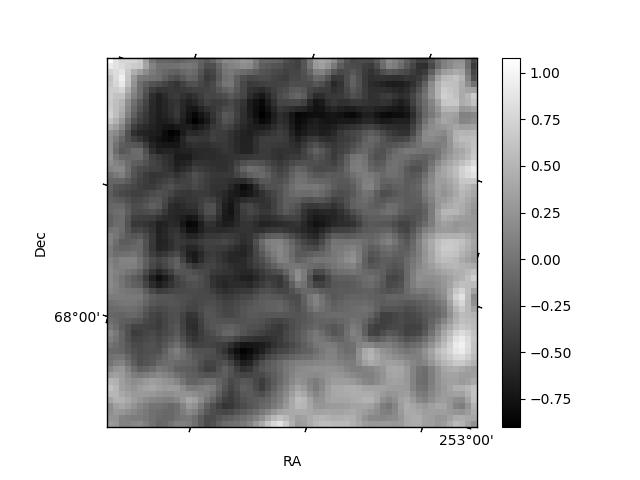
Histogram calculated using DETX and DETY for each event in the final _common_clean file
| Quadrant A | 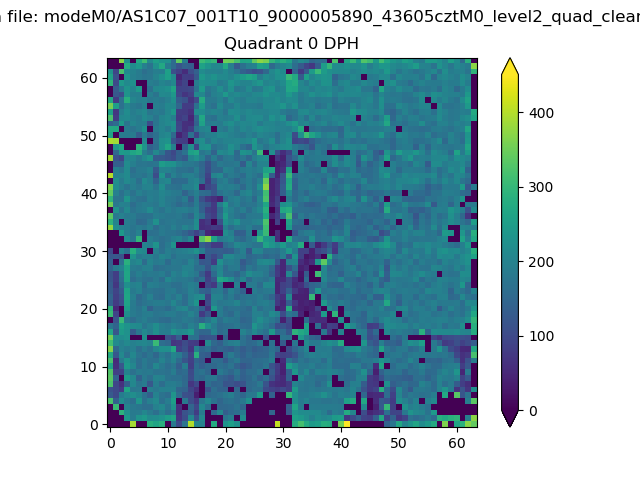 |
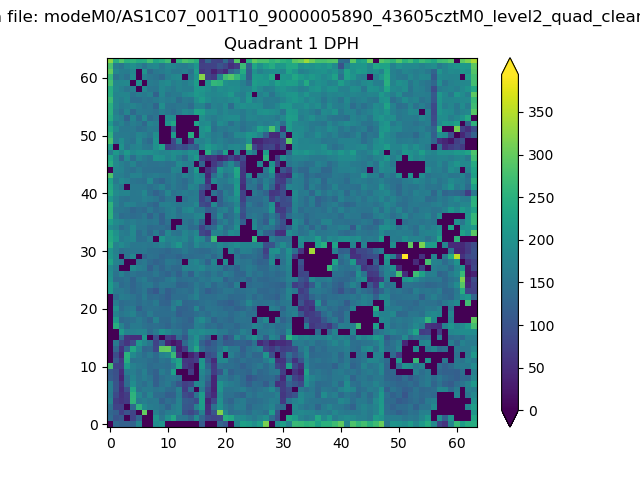 |
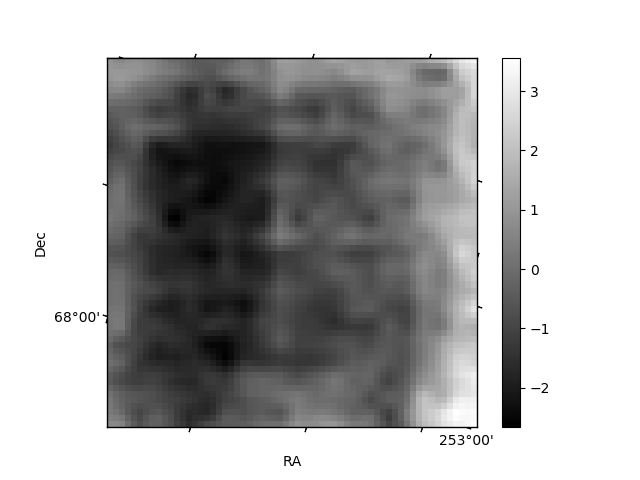
Quadrant B |
|---|---|---|---|
| Quadrant D | 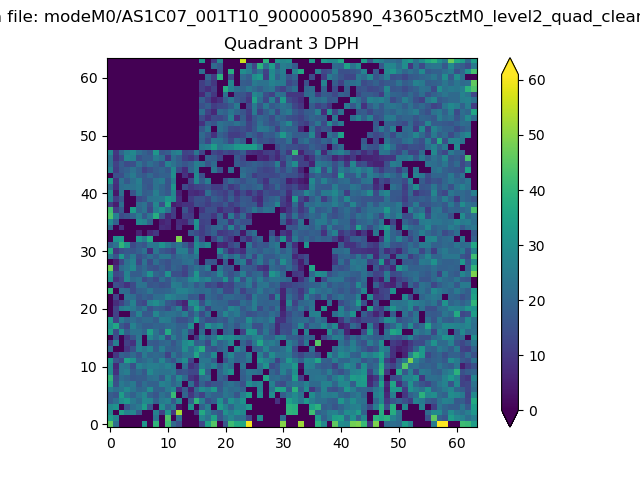 |
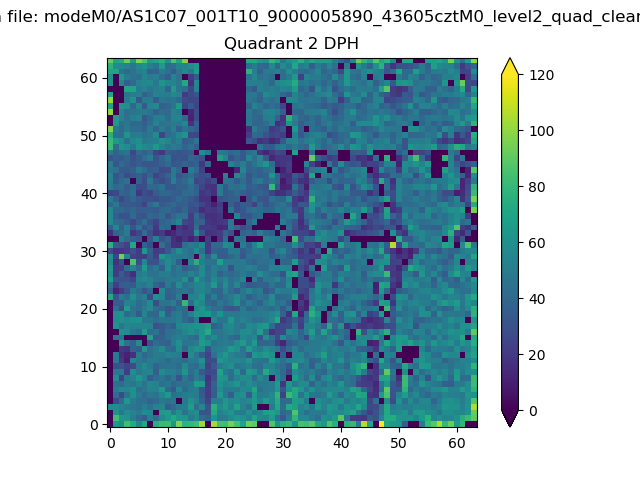 |
Quadrant C |
| Plot type | Count rate plots | Images |
|---|---|---|
| Comparison with Poisson distribution Blue bars denote a histogram of data divided into 1 sec bins. Red curve is a Poisson curve with rate = median count rate of data. |
 |
 |
| Quadrant-wise count rates Data is divided into 100 sec bins |
 |
|
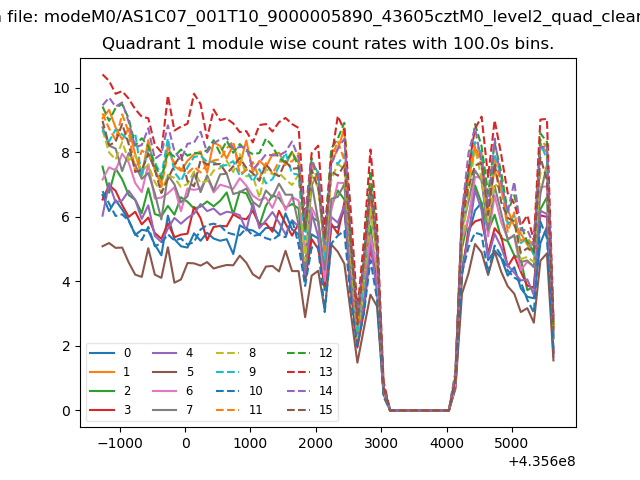
| Module-wise count rates for Quadrant A Data is divided into 100 sec bins |
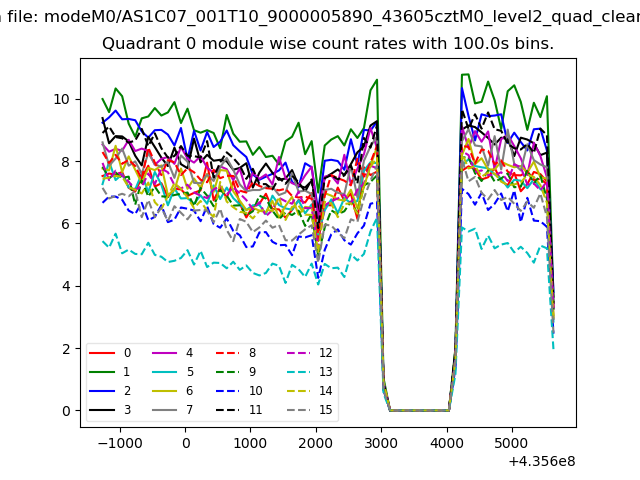 |
 |
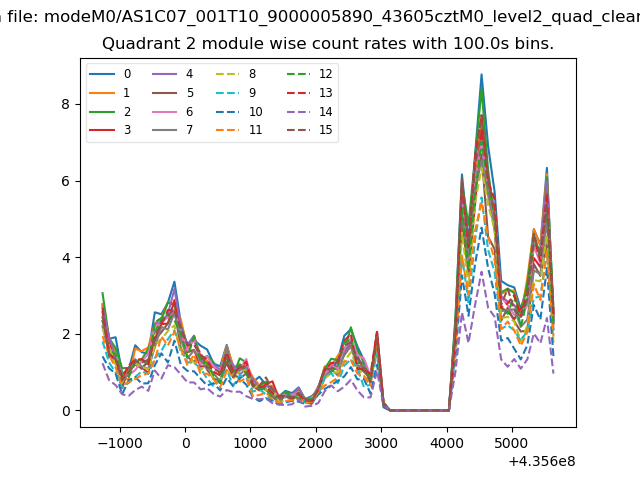
| Module-wise count rates for Quadrant B Data is divided into 100 sec bins |
 |
 |
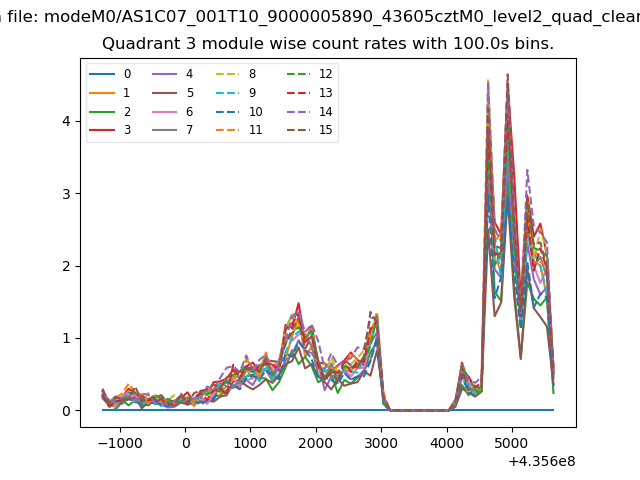
| Module-wise count rates for Quadrant C Data is divided into 100 sec bins |
 |
 |
| Module-wise count rates for Quadrant D Data is divided into 100 sec bins |
 |
 |
| Parameter | Plot |
|---|---|
| CZT HV Monitor |  |
| D_VDD | 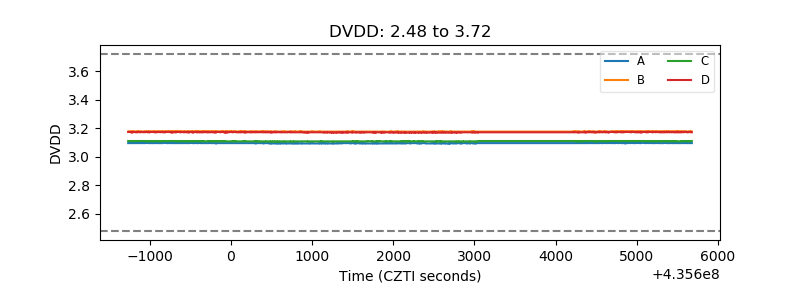 |
| Temperature 1 | 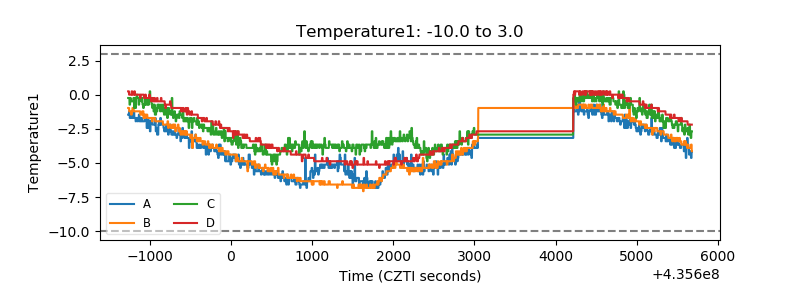 |
| Veto HV Monitor | 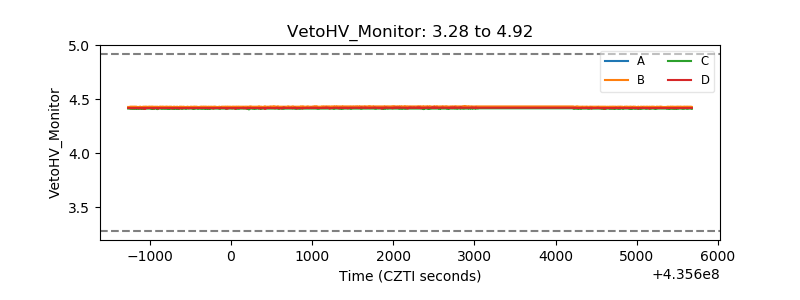 |
| Veto LLD | 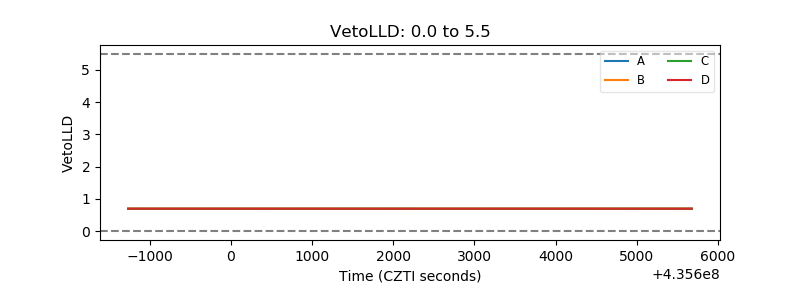 |
| Alpha Counter | 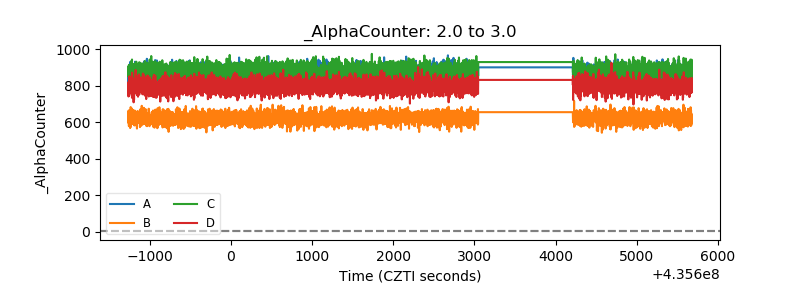 |
| _CPM_Rate | 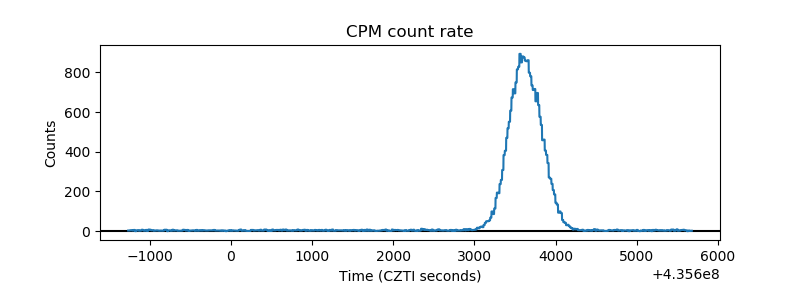 |
| CZT Counter | 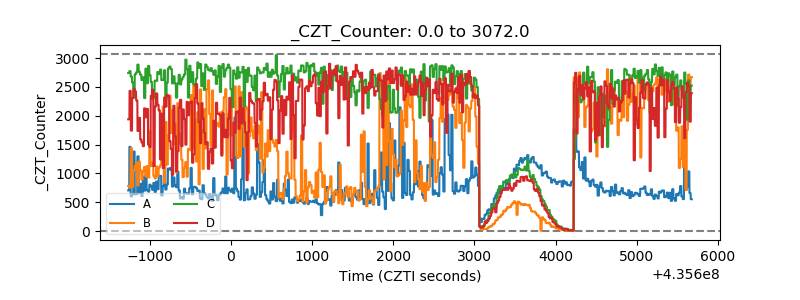 |
| +2.5 Volts monitor | 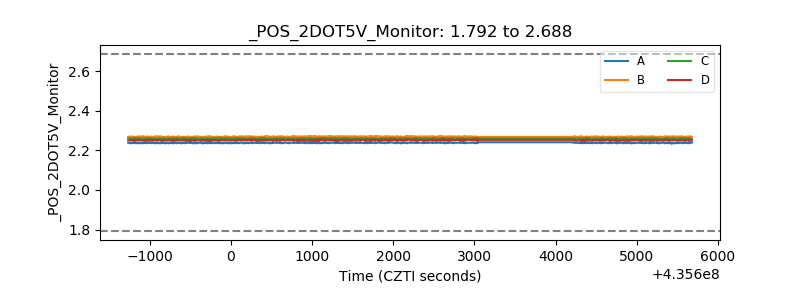 |
| +5 Volts monitor | 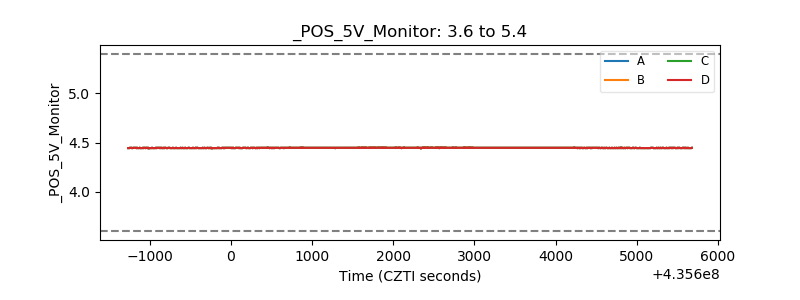 |
| _ROLL_ROT | 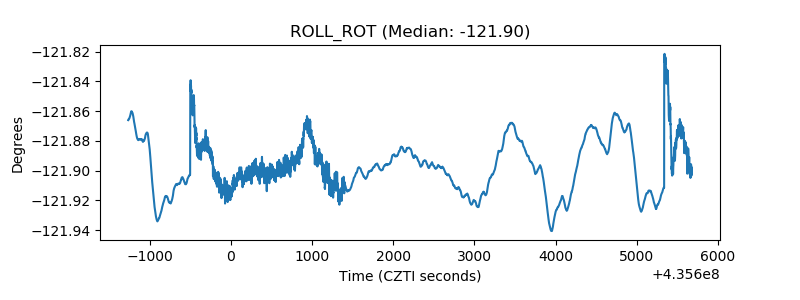 |
| _Roll_DEC | 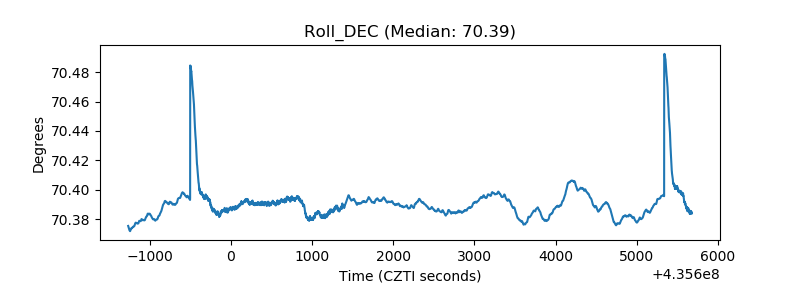 |
| _Roll_RA | 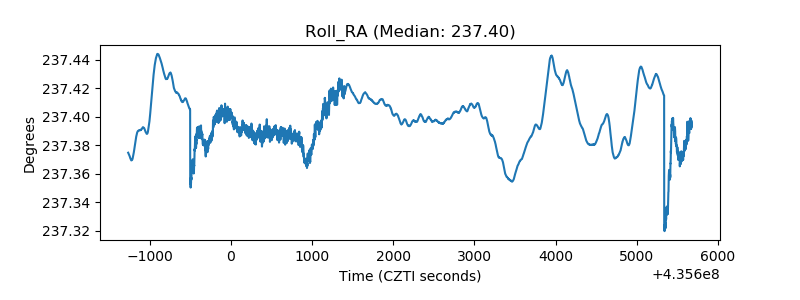 |
| Veto Counter | 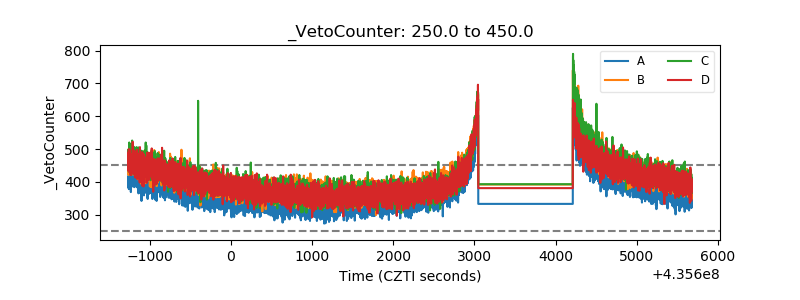 |