| Param | Original file | Final file |
|---|---|---|
| Filename | modeM0/AS1C07_001T10_9000005890_43606cztM0_level2.fits | modeM0/AS1C07_001T10_9000005890_43606cztM0_level2_quad_clean.evt |
| Size (bytes) | 1,151,544,960 | 74,687,040 |
| Size | 1.1 GB | 71.2 MB |
| Events in quadrant A | 3,967,457 | 710,897 |
| Events in quadrant B | 8,239,453 | 656,213 |
| Events in quadrant C | 15,786,028 | 294,925 |
| Events in quadrant D | 14,157,871 | 162,044 |
| Mode SS | |||
|---|---|---|---|
| Quadrant | BADHDUFLAG | Total packets | Discarded packets |
| A | 0 | 126 | 0 |
| B | 0 | 126 | 0 |
| C | 0 | 126 | 0 |
| D | 0 | 126 | 0 |
| Mode M9 | |||
|---|---|---|---|
| Quadrant | BADHDUFLAG | Total packets | Discarded packets |
| A | 0 | 10 | 0 |
| B | 0 | 10 | 0 |
| C | 0 | 10 | 0 |
| D | 0 | 10 | 0 |
| Mode M0 | |||
|---|---|---|---|
| Quadrant | BADHDUFLAG | Total packets | Discarded packets |
| A | 0 | 16185 | 1 |
| B | 0 | 28817 | 1 |
| C | 0 | 51037 | 1 |
| D | 0 | 46231 | 7 |
| Quadrant | Total seconds | Saturated seconds | Saturation percentage |
|---|---|---|---|
| A | 6168 | 96 | 1.556420% |
| B | 6168 | 1774 | 28.761349% |
| C | 6168 | 5894 | 95.557717% |
| D | 6167 | 6031 | 97.794714% |
Noise dominated data is calculated using 1-second bins in cleaned event files. If a bin has >2000 counts, and if more than 50% of those come from <1% of pixels, then it is considered to be noise-dominated and hence unusable.
| Quadrant | # 1 sec bins | Bins with >0 counts | Bins with >2000 counts | High rate bins dominated by noise | Noise dominated (total time) | Noise dominated (detector-on time) | Marked lightcurve |
|---|---|---|---|---|---|---|---|
| A | 7218 | 6169 | 14 | 14 | 0.19% | 0.23% | 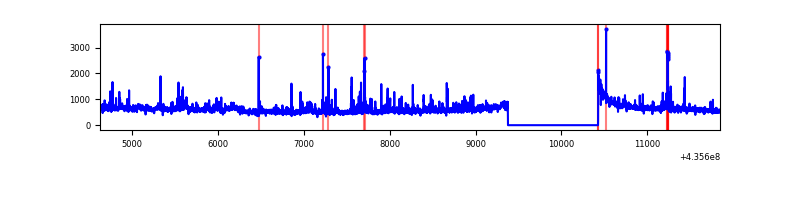 |
| B | 7218 | 6169 | 1413 | 1413 | 19.58% | 22.90% | 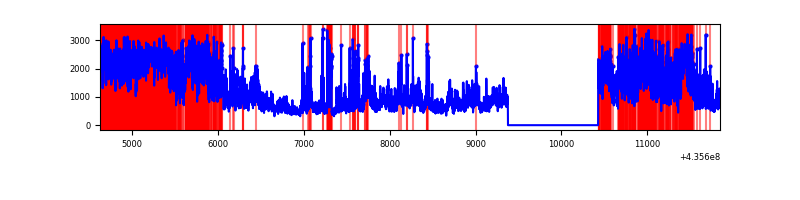 |
| C | 7217 | 6167 | 5735 | 5735 | 79.47% | 92.99% | 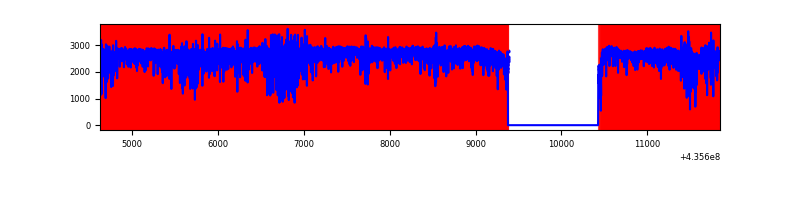 |
| D | 7216 | 6166 | 5025 | 5025 | 69.64% | 81.50% | 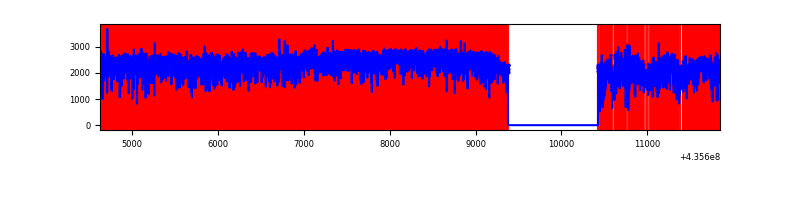 |
Top three noisy pixels from each quadrant. If the there are fewer than three noisy pixels in the level2.evt file, extra rows are filled as -1
| Pixel properties | Quadrant properties | ||||||
|---|---|---|---|---|---|---|---|
| Quadrant | DetID | PixID | Counts | Sigma | Mean | Median | Sigma |
| A | 10 | 83 | 820759 | 5885.46 | 685 | 672 | 139.3 |
| A | 2 | 79 | 156514 | 1118.42 | 685 | 672 | 139.3 |
| A | 15 | 222 | 149052 | 1064.87 | 685 | 672 | 139.3 |
| B | 4 | 206 | 4688156 | 39106.22 | 626 | 607 | 119.9 |
| B | 5 | 235 | 293151 | 2440.57 | 626 | 607 | 119.9 |
| B | 0 | 183 | 176401 | 1466.57 | 626 | 607 | 119.9 |
| C | 15 | 142 | 8380878 | 122178.54 | 292 | 295 | 68.6 |
| C | 15 | 158 | 2104977 | 30683.66 | 292 | 295 | 68.6 |
| C | 15 | 174 | 2044317 | 29799.31 | 292 | 295 | 68.6 |
| D | 4 | 212 | 7266302 | 131136.47 | 190 | 182 | 55.4 |
| D | 4 | 216 | 2432291 | 43893.88 | 190 | 182 | 55.4 |
| D | 1 | 20 | 1372714 | 24770.99 | 190 | 182 | 55.4 |
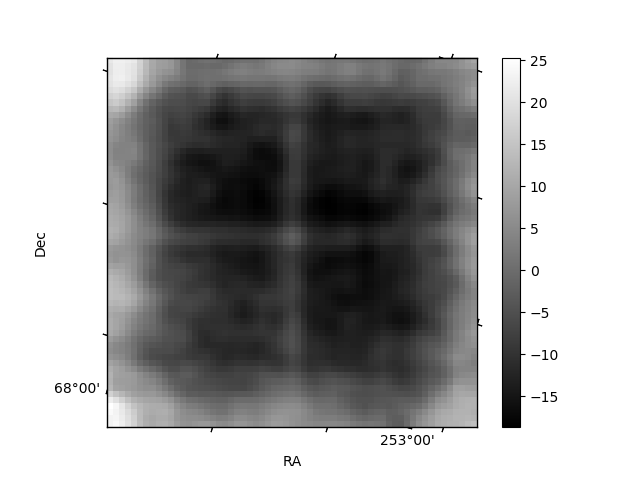
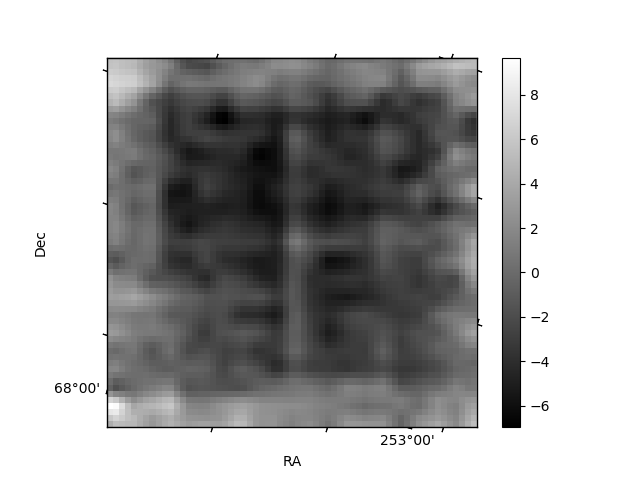
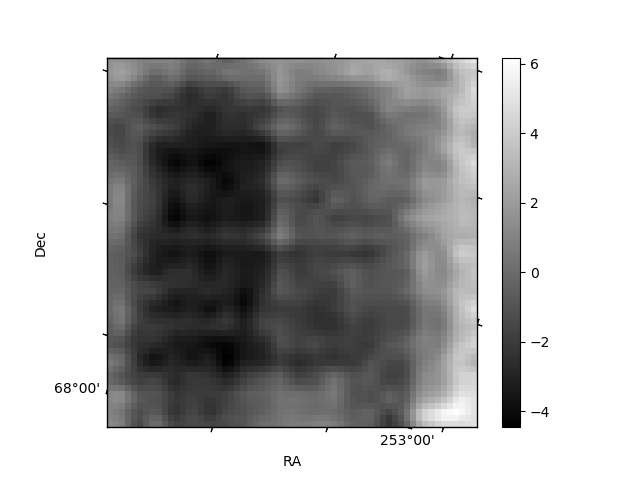
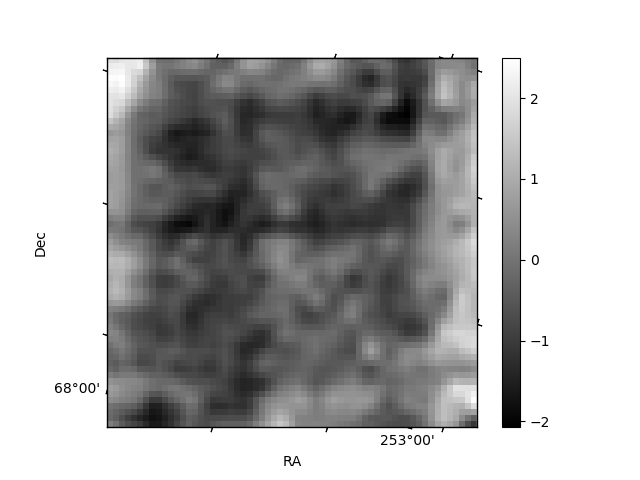
Histogram calculated using DETX and DETY for each event in the final _common_clean file
| Quadrant A | 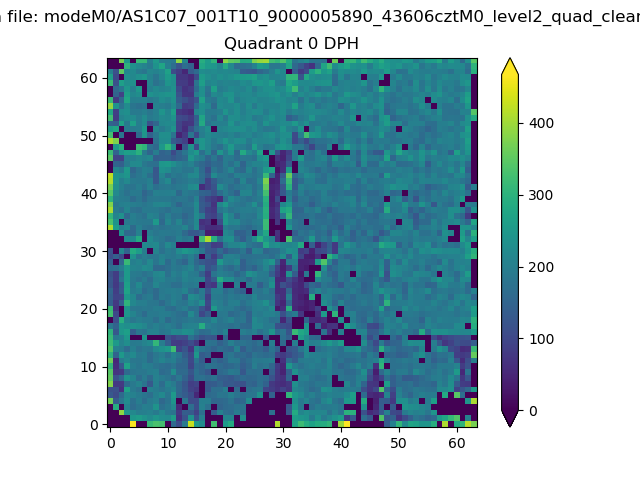 |
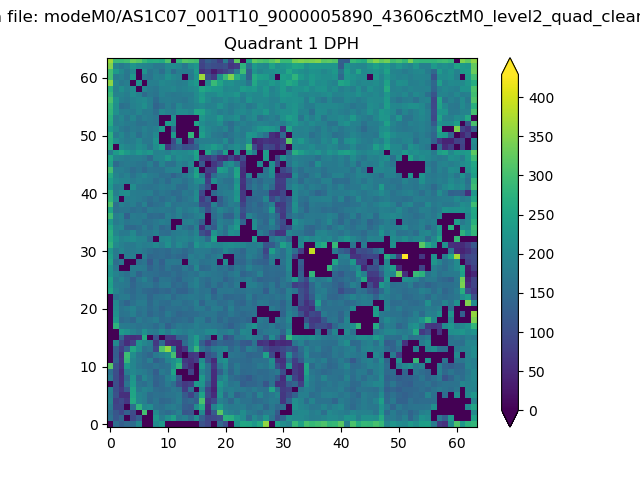 |
Quadrant B |
|---|---|---|---|
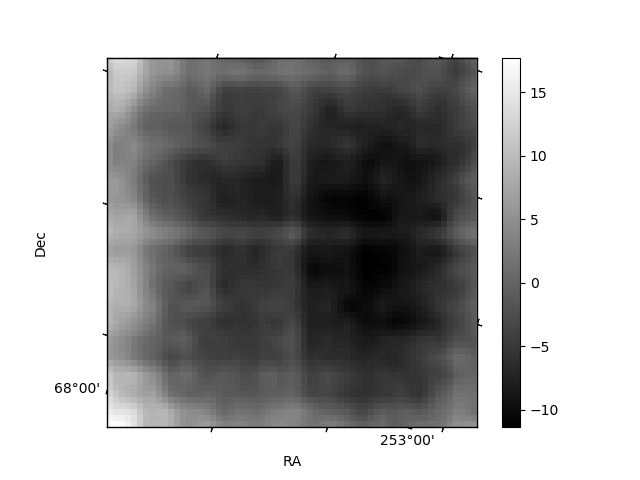
| Quadrant D | 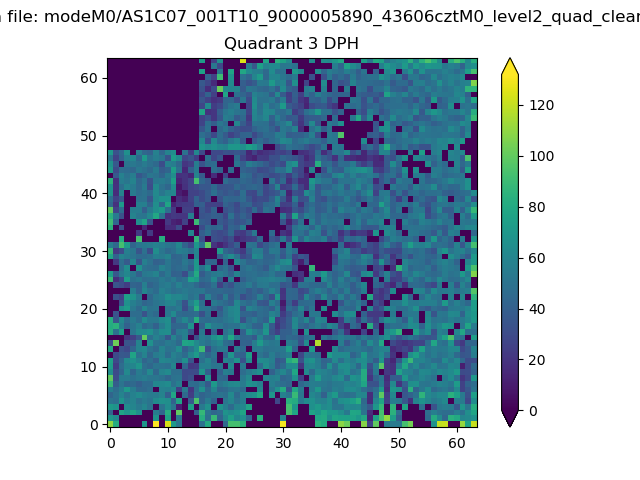 |
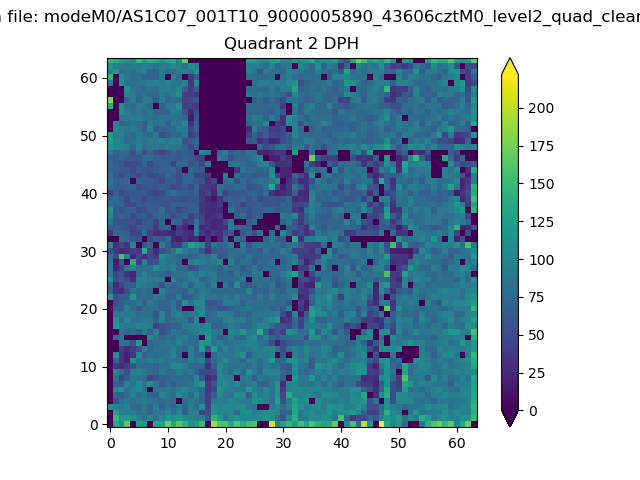 |
Quadrant C |
| Plot type | Count rate plots | Images |
|---|---|---|
| Comparison with Poisson distribution Blue bars denote a histogram of data divided into 1 sec bins. Red curve is a Poisson curve with rate = median count rate of data. |
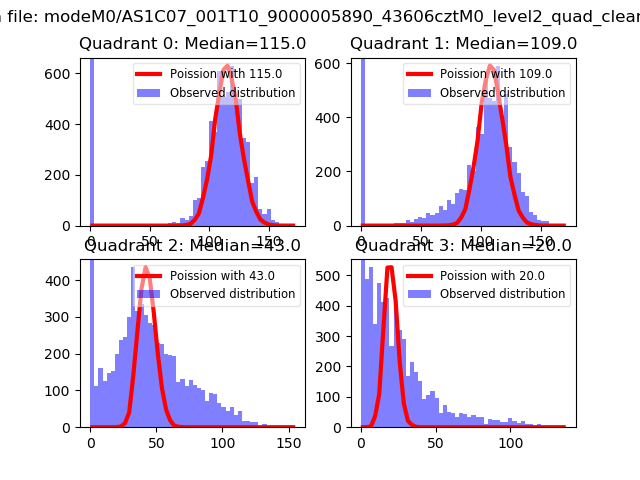 |
 |
| Quadrant-wise count rates Data is divided into 100 sec bins |
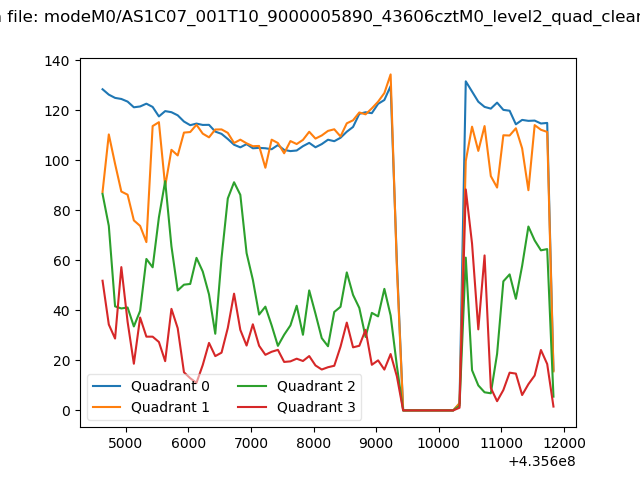 |
|
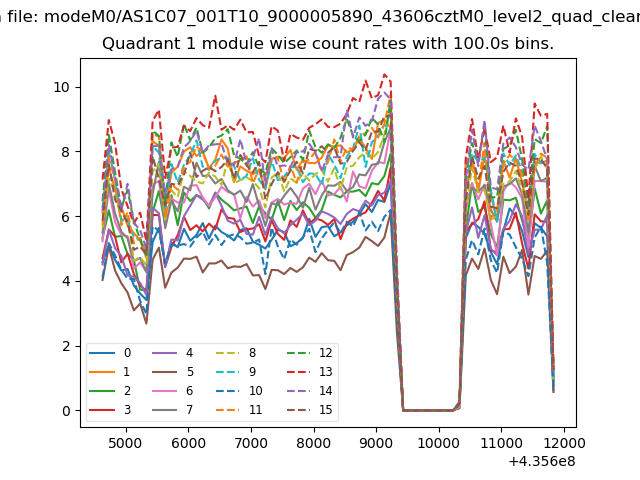
| Module-wise count rates for Quadrant A Data is divided into 100 sec bins |
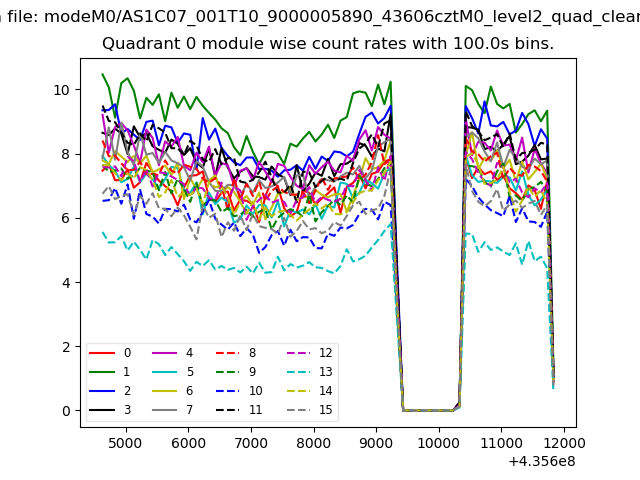 |
 |
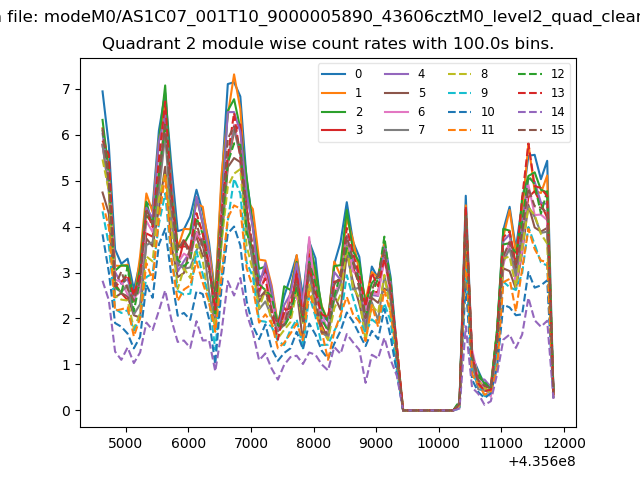
| Module-wise count rates for Quadrant B Data is divided into 100 sec bins |
 |
 |
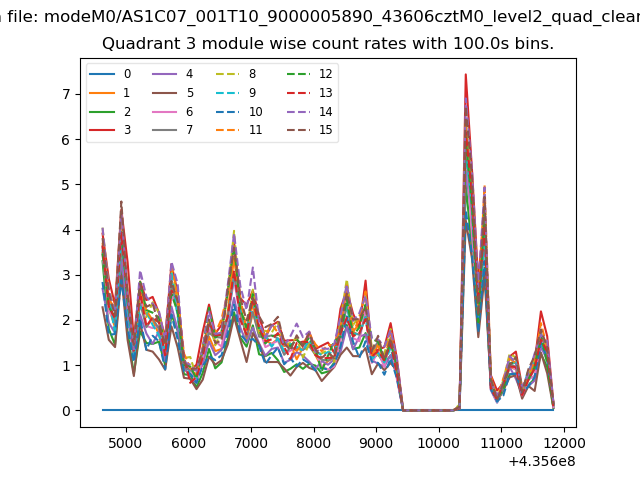
| Module-wise count rates for Quadrant C Data is divided into 100 sec bins |
 |
 |
| Module-wise count rates for Quadrant D Data is divided into 100 sec bins |
 |
 |
| Parameter | Plot |
|---|---|
| CZT HV Monitor | 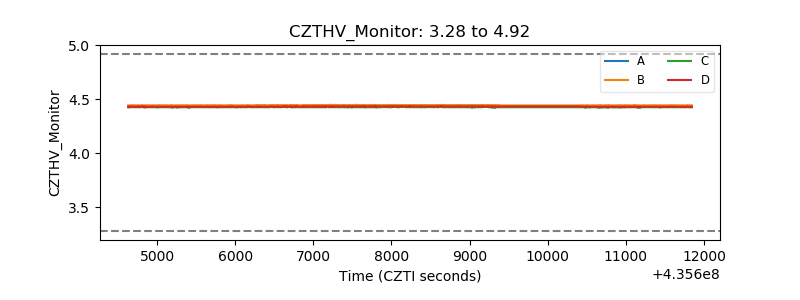 |
| D_VDD | 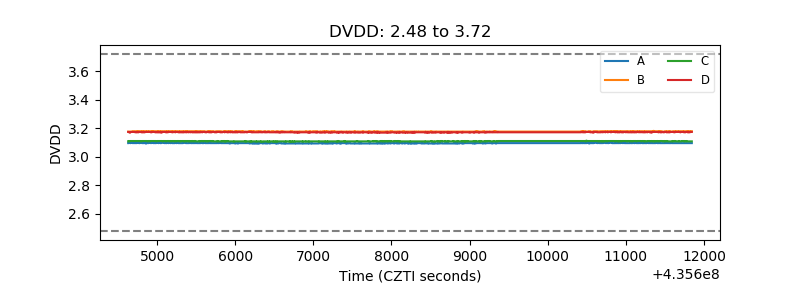 |
| Temperature 1 | 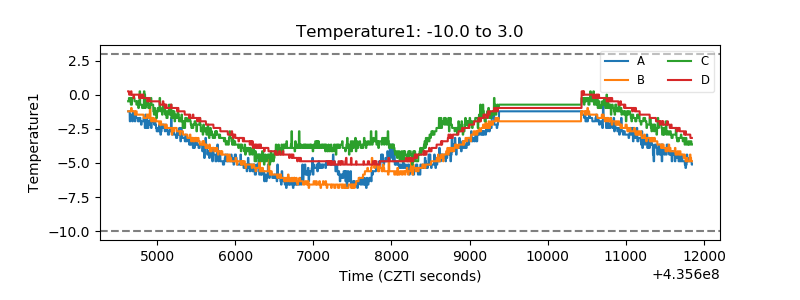 |
| Veto HV Monitor | 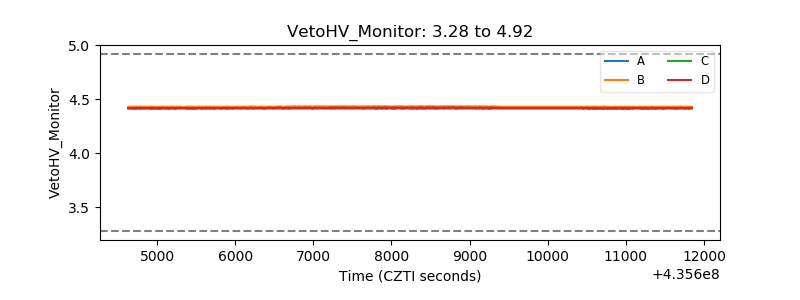 |
| Veto LLD | 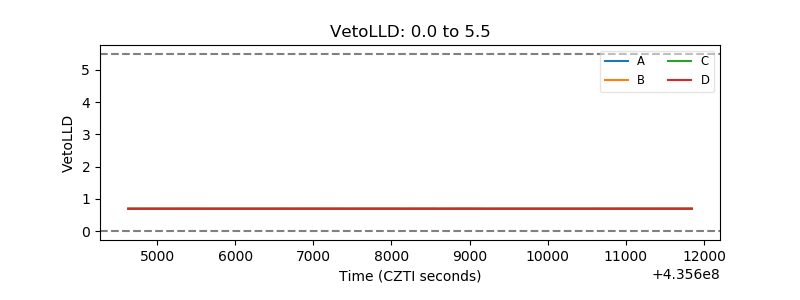 |
| Alpha Counter | 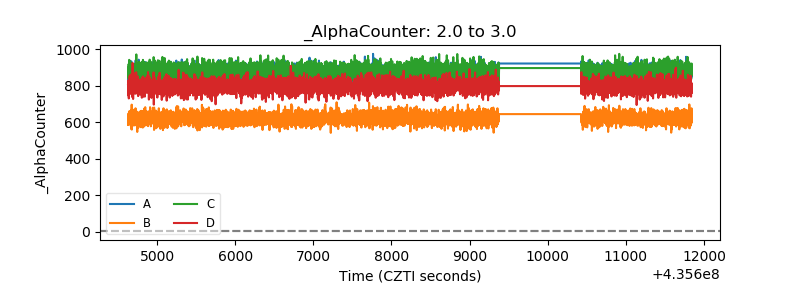 |
| _CPM_Rate | 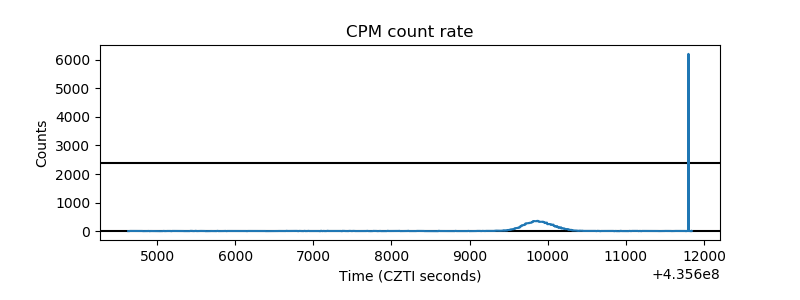 |
| CZT Counter | 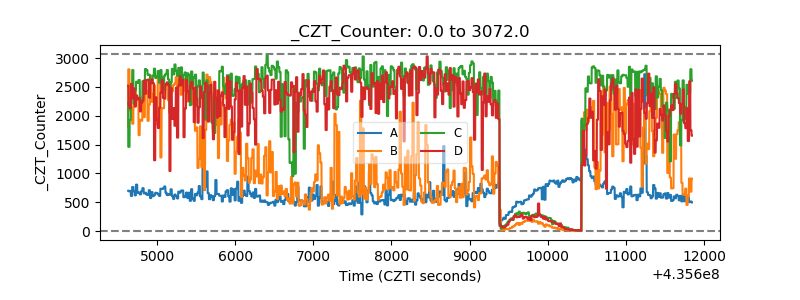 |
| +2.5 Volts monitor | 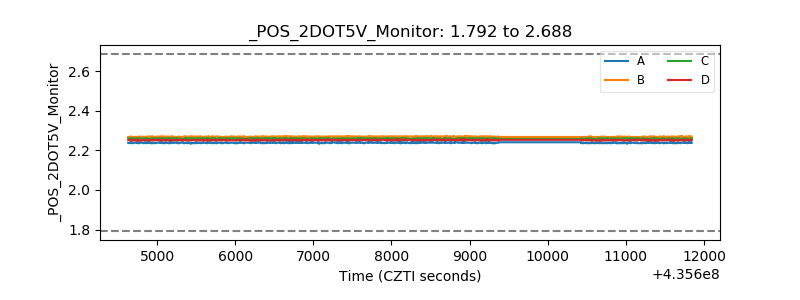 |
| +5 Volts monitor | 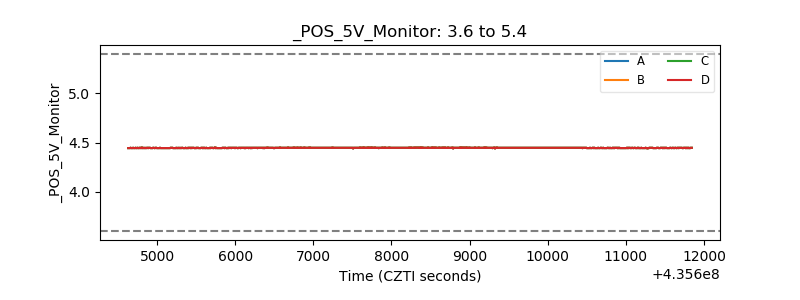 |
| _ROLL_ROT | 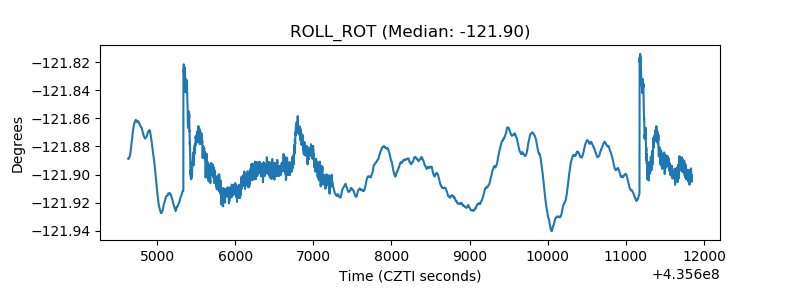 |
| _Roll_DEC |  |
| _Roll_RA | 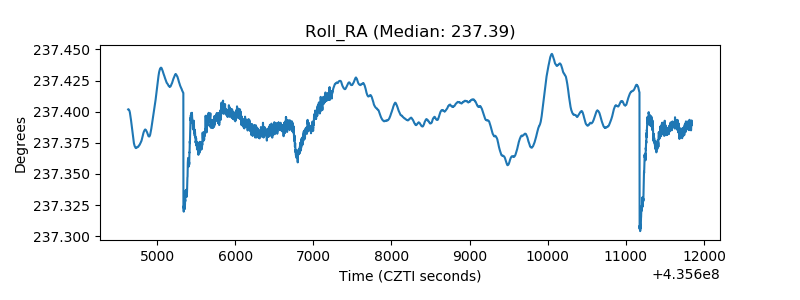 |
| Veto Counter | 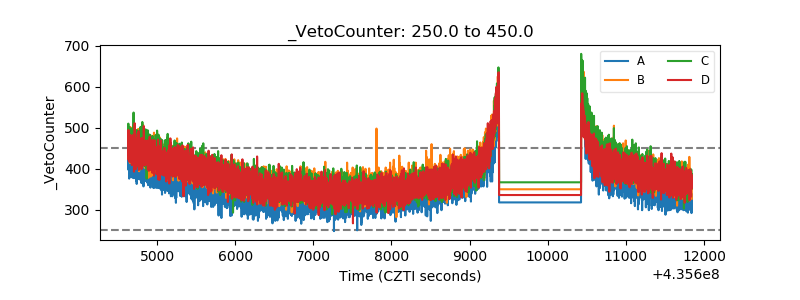 |