| Param | Original file | Final file |
|---|---|---|
| Filename | modeM0/AS1C07_001T10_9000005890_43609cztM0_level2.fits | modeM0/AS1C07_001T10_9000005890_43609cztM0_level2_quad_clean.evt |
| Size (bytes) | 2,564,159,040 | 155,494,080 |
| Size | 2.4 GB | 148.3 MB |
| Events in quadrant A | 11,113,965 | 1,515,675 |
| Events in quadrant B | 12,867,342 | 1,501,760 |
| Events in quadrant C | 37,009,983 | 244,878 |
| Events in quadrant D | 32,836,067 | 452,128 |
| Mode SS | |||
|---|---|---|---|
| Quadrant | BADHDUFLAG | Total packets | Discarded packets |
| A | 0 | 286 | 0 |
| B | 0 | 286 | 0 |
| C | 0 | 286 | 0 |
| D | 0 | 286 | 0 |
| Mode M9 | |||
|---|---|---|---|
| Quadrant | BADHDUFLAG | Total packets | Discarded packets |
| A | 0 | 4 | 0 |
| B | 0 | 5 | 0 |
| C | 0 | 5 | 0 |
| D | 0 | 5 | 0 |
| Mode M0 | |||
|---|---|---|---|
| Quadrant | BADHDUFLAG | Total packets | Discarded packets |
| A | 0 | 42532 | 3 |
| B | 0 | 48088 | 3 |
| C | 0 | 119650 | 3 |
| D | 0 | 107198 | 4 |
| Quadrant | Total seconds | Saturated seconds | Saturation percentage |
|---|---|---|---|
| A | 14176 | 1088 | 7.674944% |
| B | 14176 | 1931 | 13.621614% |
| C | 14176 | 14172 | 99.971783% |
| D | 14175 | 13594 | 95.901235% |
Noise dominated data is calculated using 1-second bins in cleaned event files. If a bin has >2000 counts, and if more than 50% of those come from <1% of pixels, then it is considered to be noise-dominated and hence unusable.
| Quadrant | # 1 sec bins | Bins with >0 counts | Bins with >2000 counts | High rate bins dominated by noise | Noise dominated (total time) | Noise dominated (detector-on time) | Marked lightcurve |
|---|---|---|---|---|---|---|---|
| A | 14296 | 14178 | 792 | 792 | 5.54% | 5.59% | 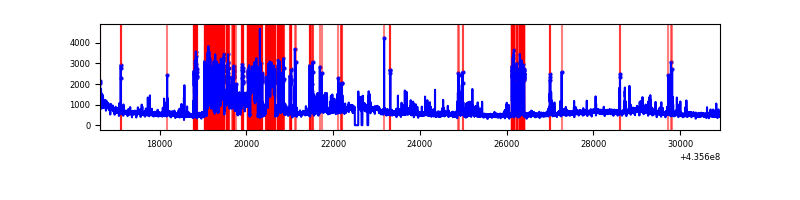 |
| B | 14296 | 14179 | 1044 | 1044 | 7.30% | 7.36% | 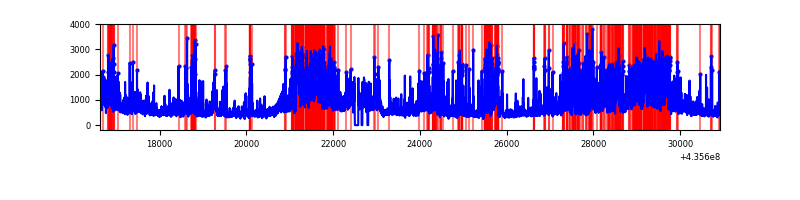 |
| C | 14295 | 14175 | 13752 | 13752 | 96.20% | 97.02% | 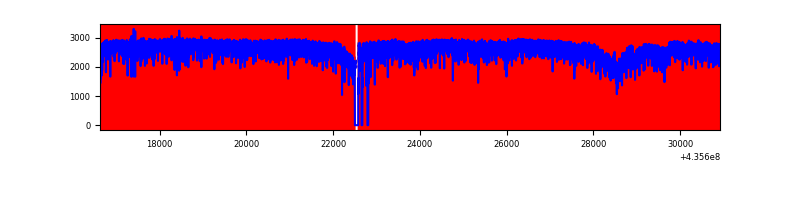 |
| D | 14294 | 14174 | 11407 | 11407 | 79.80% | 80.48% | 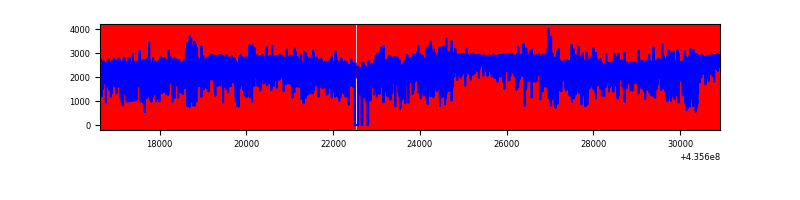 |
Top three noisy pixels from each quadrant. If the there are fewer than three noisy pixels in the level2.evt file, extra rows are filled as -1
| Pixel properties | Quadrant properties | ||||||
|---|---|---|---|---|---|---|---|
| Quadrant | DetID | PixID | Counts | Sigma | Mean | Median | Sigma |
| A | 0 | 50 | 2289680 | 7197.39 | 1546 | 1510 | 317.9 |
| A | 10 | 83 | 1626130 | 5110.21 | 1546 | 1510 | 317.9 |
| A | 15 | 223 | 449126 | 1407.97 | 1546 | 1510 | 317.9 |
| B | 4 | 206 | 3465316 | 12060.88 | 1511 | 1467 | 287.2 |
| B | 5 | 235 | 2290607 | 7970.63 | 1511 | 1467 | 287.2 |
| B | 4 | 171 | 310422 | 1075.76 | 1511 | 1467 | 287.2 |
| C | 15 | 142 | 23174551 | 357501.89 | 278 | 279 | 64.8 |
| C | 15 | 174 | 6729763 | 103813.54 | 278 | 279 | 64.8 |
| C | 15 | 126 | 4636336 | 71518.93 | 278 | 279 | 64.8 |
| D | 4 | 212 | 13600671 | 80029.59 | 571 | 552 | 169.9 |
| D | 4 | 216 | 6306152 | 37105.16 | 571 | 552 | 169.9 |
| D | 8 | 48 | 2235515 | 13151.59 | 571 | 552 | 169.9 |
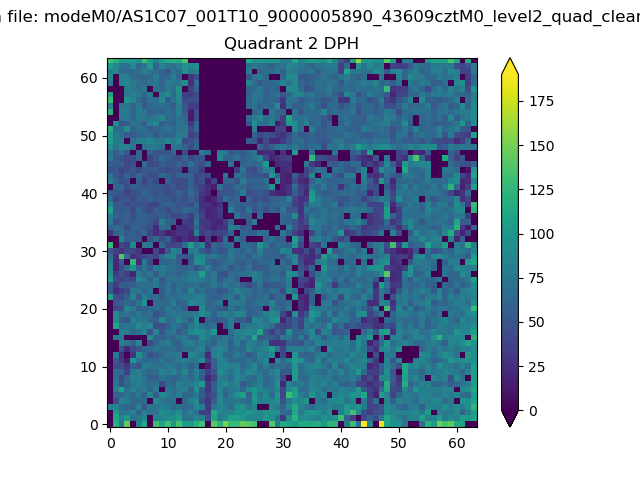
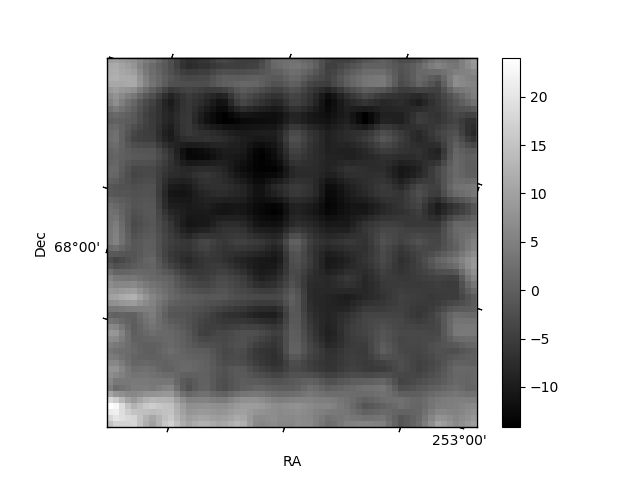
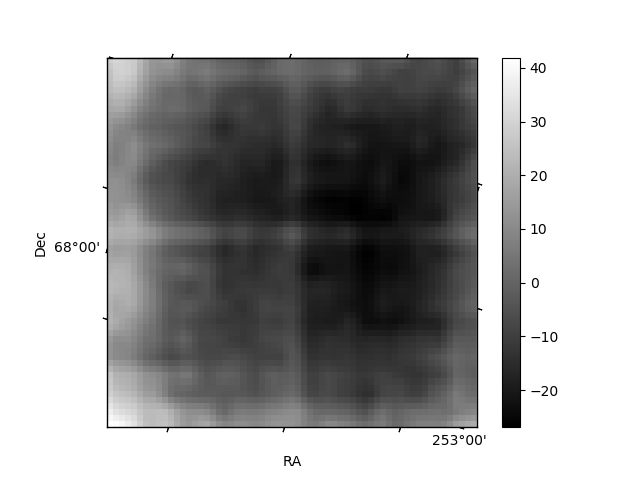
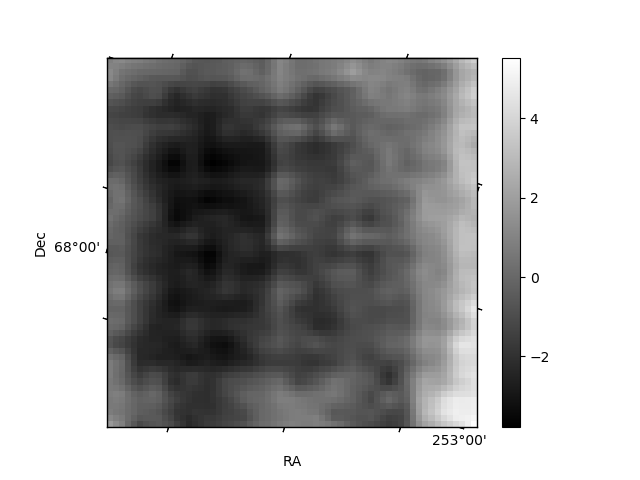
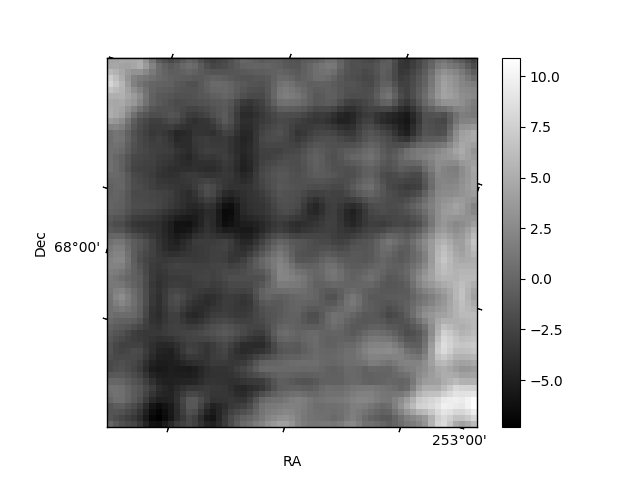
Histogram calculated using DETX and DETY for each event in the final _common_clean file
| Quadrant A | 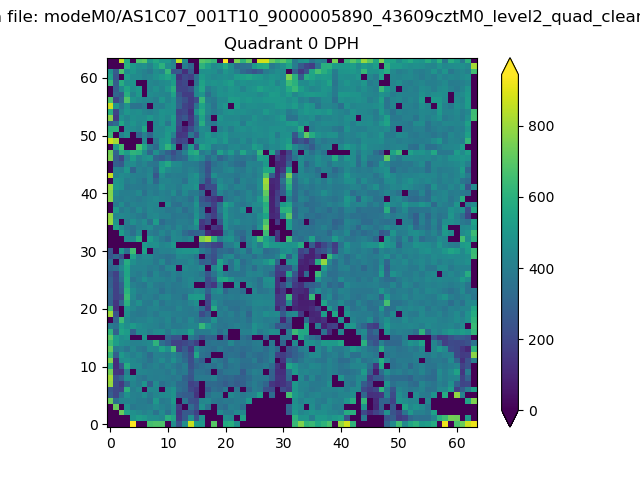 |
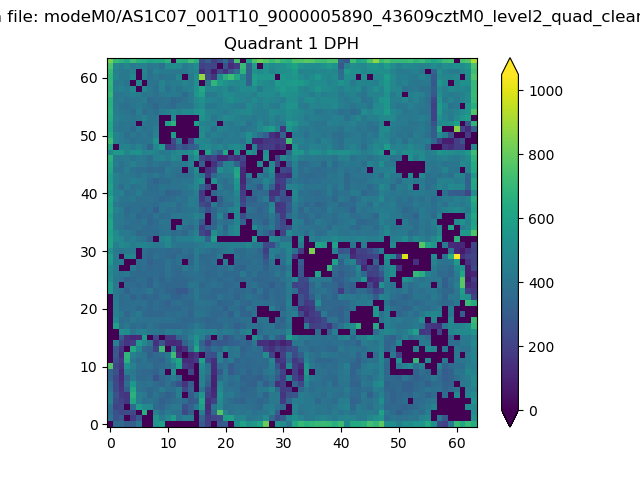 |
Quadrant B |
|---|---|---|---|
| Quadrant D | 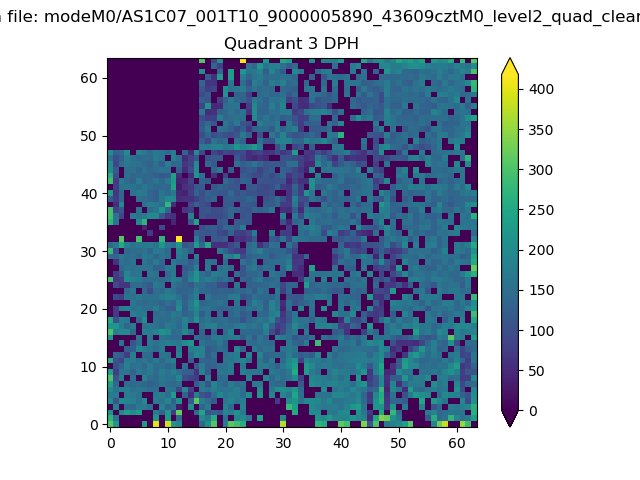 |
 |
Quadrant C |
| Plot type | Count rate plots | Images |
|---|---|---|
| Comparison with Poisson distribution Blue bars denote a histogram of data divided into 1 sec bins. Red curve is a Poisson curve with rate = median count rate of data. |
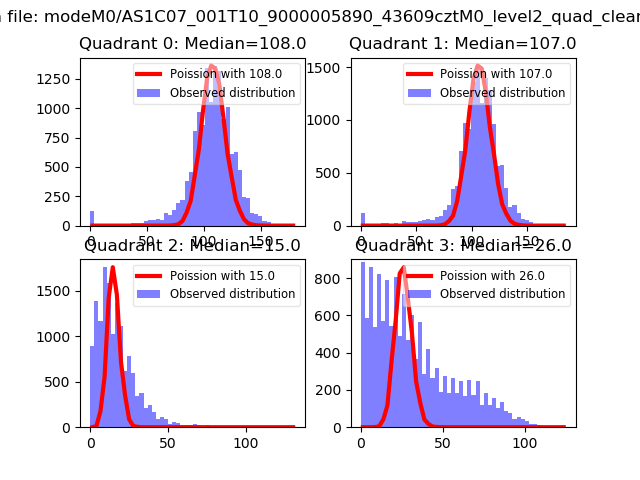 |
 |
| Quadrant-wise count rates Data is divided into 100 sec bins |
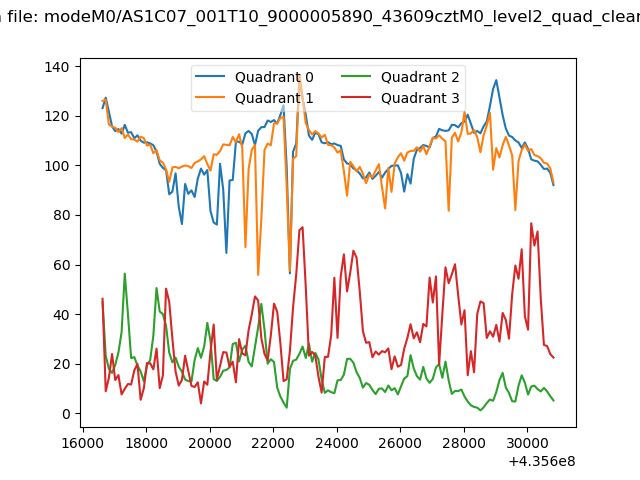 |
|
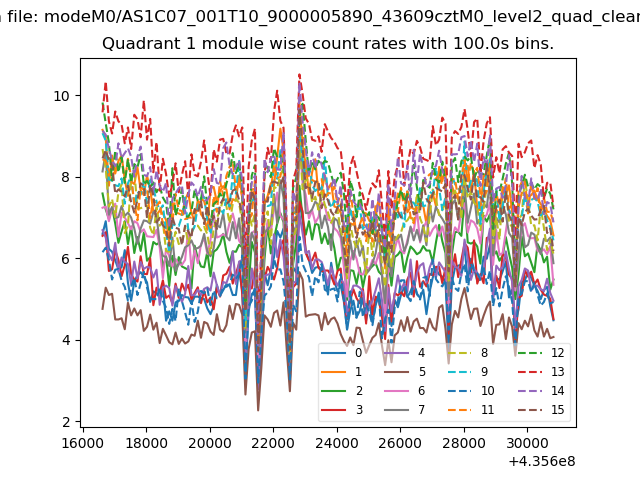
| Module-wise count rates for Quadrant A Data is divided into 100 sec bins |
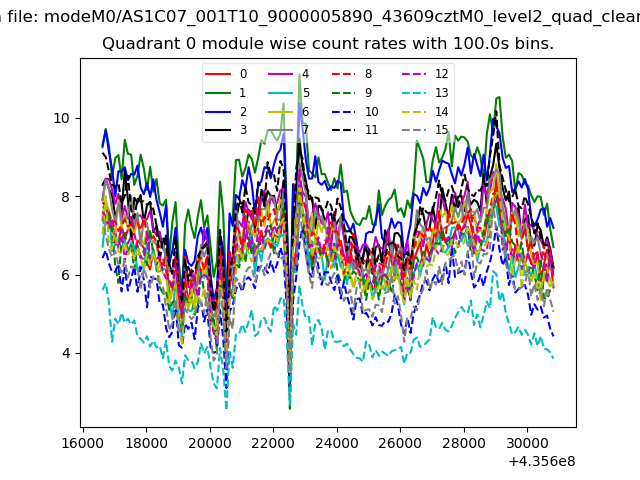 |
 |
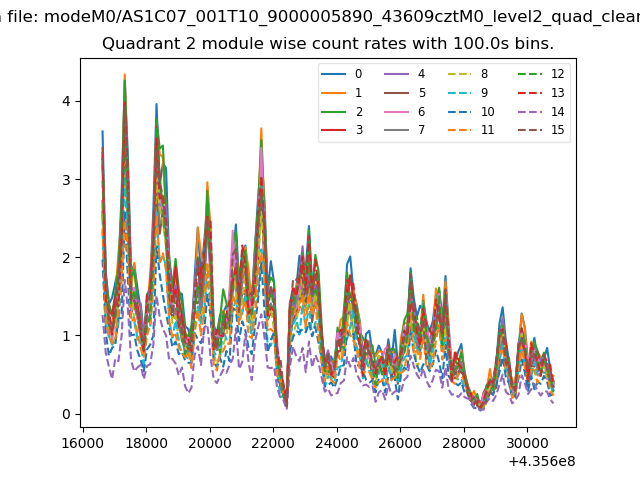
| Module-wise count rates for Quadrant B Data is divided into 100 sec bins |
 |
 |
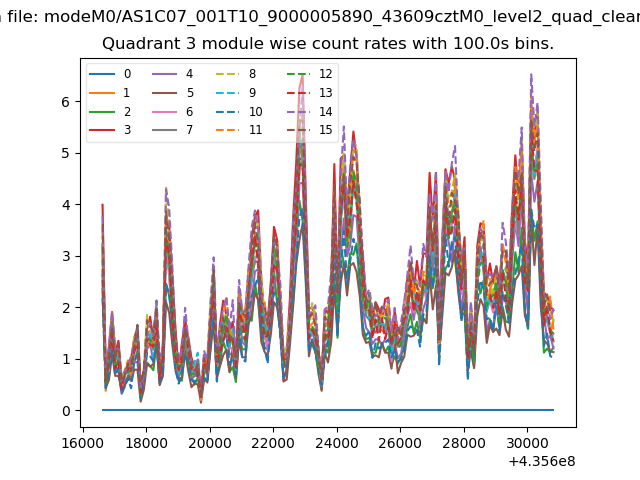
| Module-wise count rates for Quadrant C Data is divided into 100 sec bins |
 |
 |
| Module-wise count rates for Quadrant D Data is divided into 100 sec bins |
 |
 |
| Parameter | Plot |
|---|---|
| CZT HV Monitor |  |
| D_VDD | 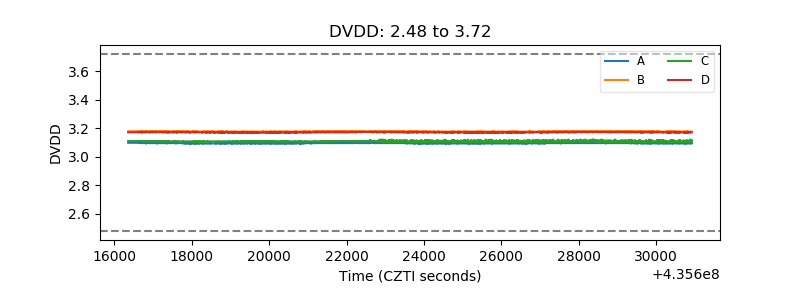 |
| Temperature 1 | 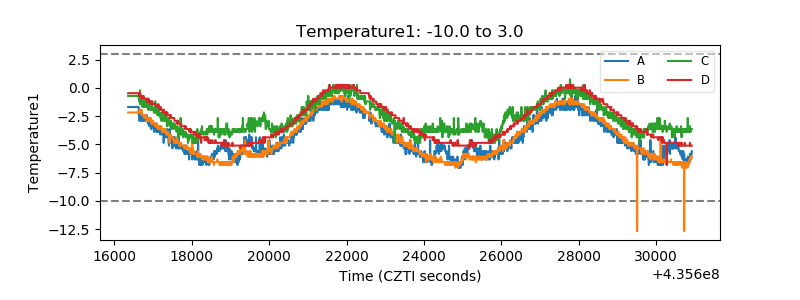 |
| Veto HV Monitor | 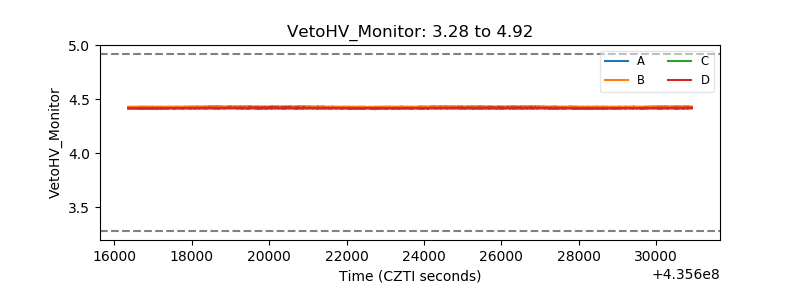 |
| Veto LLD | 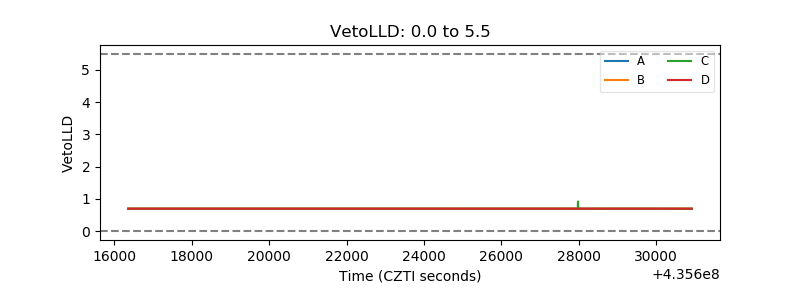 |
| Alpha Counter | 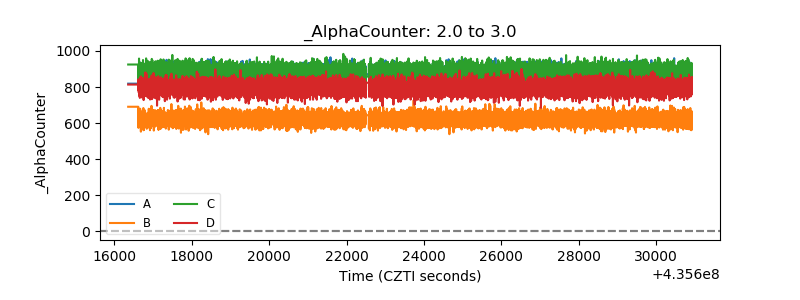 |
| _CPM_Rate | 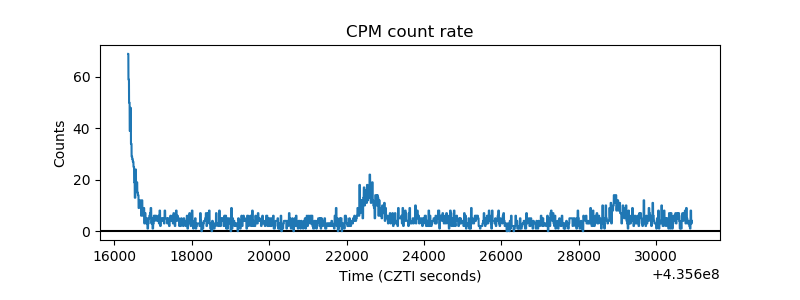 |
| CZT Counter | 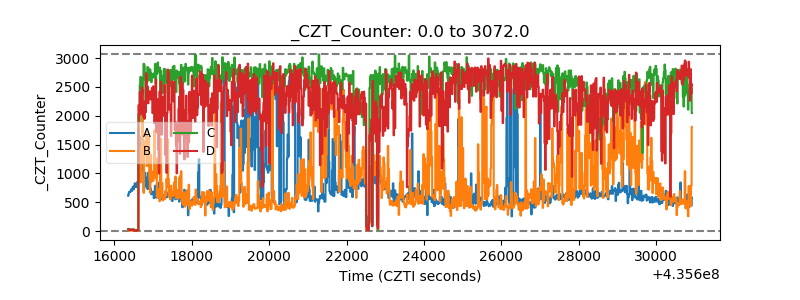 |
| +2.5 Volts monitor | 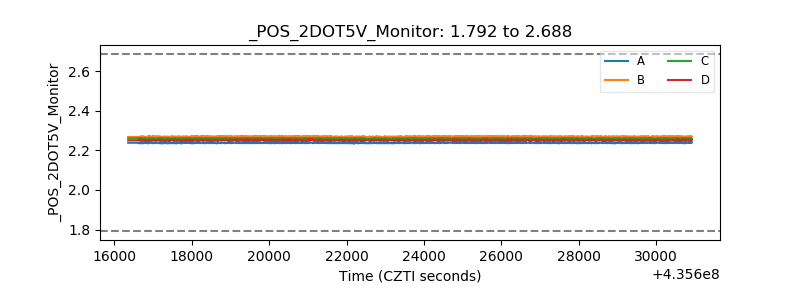 |
| +5 Volts monitor | 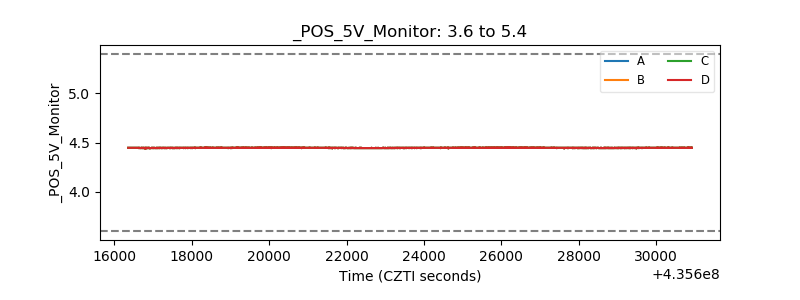 |
| _ROLL_ROT | 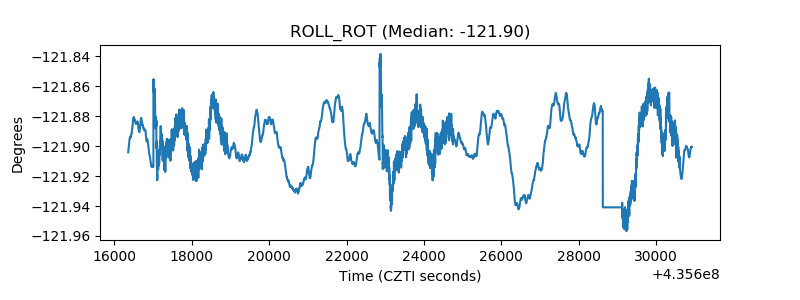 |
| _Roll_DEC | 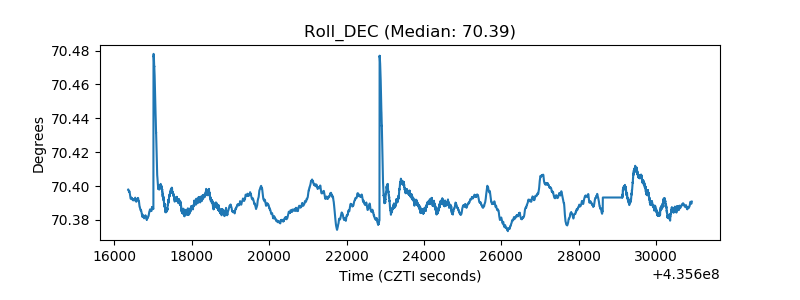 |
| _Roll_RA |  |
| Veto Counter | 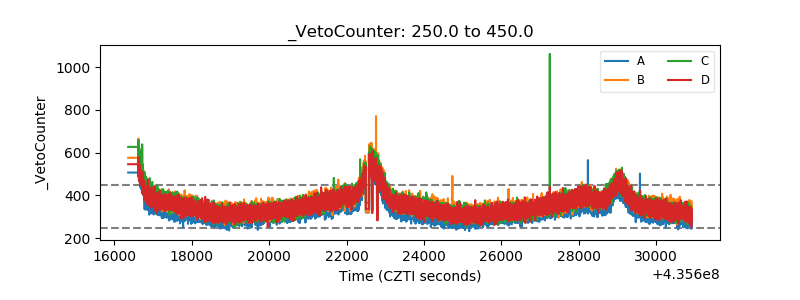 |