| Param | Original file | Final file |
|---|---|---|
| Filename | modeM0/AS1A12_095T02_9000005892_43617cztM0_level2.fits | modeM0/AS1A12_095T02_9000005892_43617cztM0_level2_quad_clean.evt |
| Size (bytes) | 1,121,181,120 | 81,731,520 |
| Size | 1.0 GB | 77.9 MB |
| Events in quadrant A | 7,670,978 | 618,452 |
| Events in quadrant B | 5,761,019 | 719,299 |
| Events in quadrant C | 14,766,124 | 345,781 |
| Events in quadrant D | 12,826,566 | 352,624 |
| Mode M9 | |||
|---|---|---|---|
| Quadrant | BADHDUFLAG | Total packets | Discarded packets |
| A | 0 | 11 | 0 |
| B | 0 | 11 | 0 |
| C | 0 | 11 | 0 |
| D | 0 | 11 | 0 |
| Mode M0 | |||
|---|---|---|---|
| Quadrant | BADHDUFLAG | Total packets | Discarded packets |
| A | 0 | 27067 | 1 |
| B | 0 | 21380 | 1 |
| C | 0 | 48154 | 8 |
| D | 0 | 42390 | 1 |
| Mode SS | |||
|---|---|---|---|
| Quadrant | BADHDUFLAG | Total packets | Discarded packets |
| A | 0 | 126 | 0 |
| B | 0 | 126 | 0 |
| C | 0 | 126 | 0 |
| D | 0 | 126 | 0 |
| Quadrant | Total seconds | Saturated seconds | Saturation percentage |
|---|---|---|---|
| A | 6200 | 1784 | 28.774194% |
| B | 6201 | 756 | 12.191582% |
| C | 6200 | 5231 | 84.370968% |
| D | 6200 | 4449 | 71.758065% |
Noise dominated data is calculated using 1-second bins in cleaned event files. If a bin has >2000 counts, and if more than 50% of those come from <1% of pixels, then it is considered to be noise-dominated and hence unusable.
| Quadrant | # 1 sec bins | Bins with >0 counts | Bins with >2000 counts | High rate bins dominated by noise | Noise dominated (total time) | Noise dominated (detector-on time) | Marked lightcurve |
|---|---|---|---|---|---|---|---|
| A | 7314 | 6199 | 1567 | 1567 | 21.42% | 25.28% | 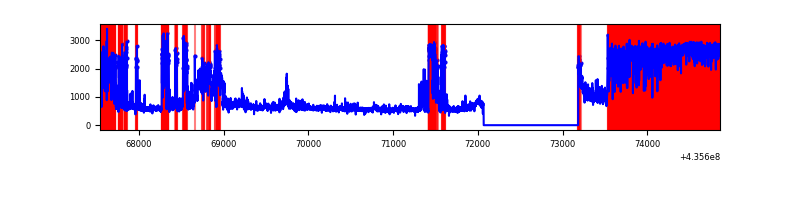 |
| B | 7316 | 6201 | 597 | 597 | 8.16% | 9.63% | 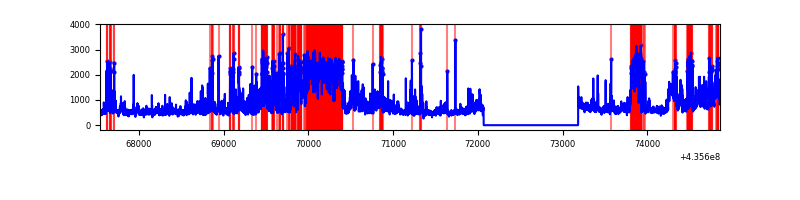 |
| C | 7314 | 6199 | 5094 | 5094 | 69.65% | 82.17% | 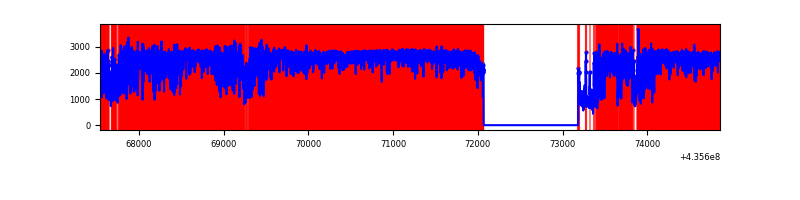 |
| D | 7315 | 6200 | 4079 | 4079 | 55.76% | 65.79% | 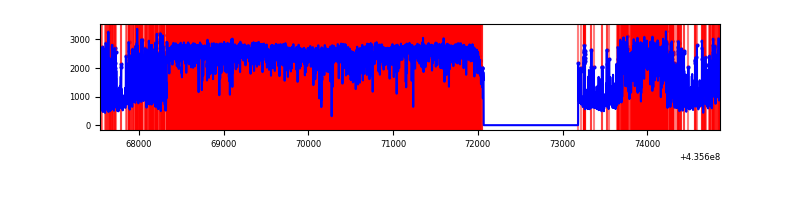 |
Top three noisy pixels from each quadrant. If the there are fewer than three noisy pixels in the level2.evt file, extra rows are filled as -1
| Pixel properties | Quadrant properties | ||||||
|---|---|---|---|---|---|---|---|
| Quadrant | DetID | PixID | Counts | Sigma | Mean | Median | Sigma |
| A | 0 | 50 | 3443921 | 26187.09 | 635 | 621 | 131.5 |
| A | 10 | 83 | 689822 | 5241.53 | 635 | 621 | 131.5 |
| A | 15 | 223 | 655776 | 4982.61 | 635 | 621 | 131.5 |
| B | 5 | 235 | 1880327 | 13880.2 | 705 | 684 | 135.4 |
| B | 4 | 206 | 435546 | 3211.23 | 705 | 684 | 135.4 |
| B | 0 | 155 | 176294 | 1296.79 | 705 | 684 | 135.4 |
| C | 15 | 174 | 4755137 | 55398.38 | 362 | 364 | 85.8 |
| C | 15 | 142 | 3992101 | 46508.16 | 362 | 364 | 85.8 |
| C | 15 | 126 | 1221990 | 14233.3 | 362 | 364 | 85.8 |
| D | 13 | 187 | 5963106 | 50379.12 | 414 | 397 | 118.4 |
| D | 4 | 216 | 865147 | 7306.3 | 414 | 397 | 118.4 |
| D | 4 | 235 | 632342 | 5339.32 | 414 | 397 | 118.4 |
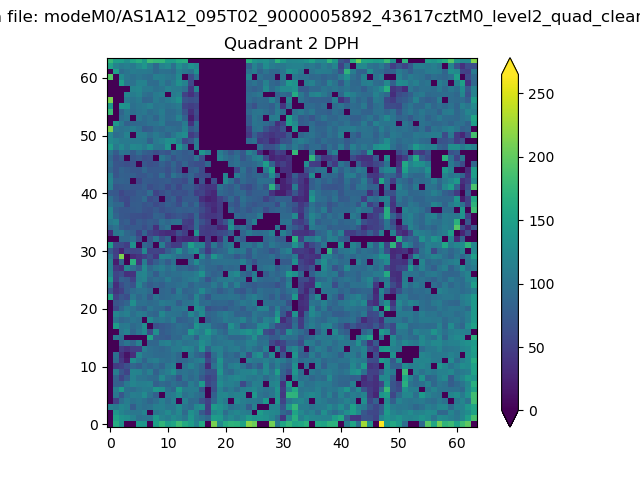
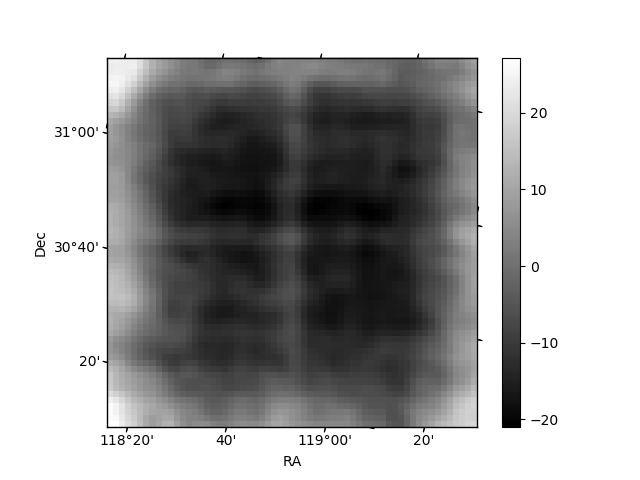
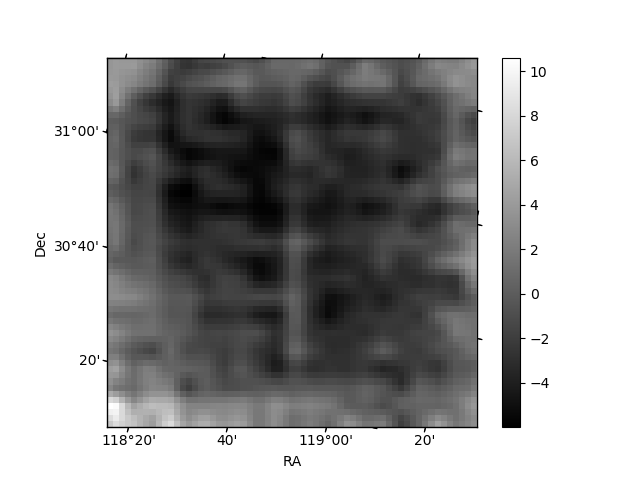
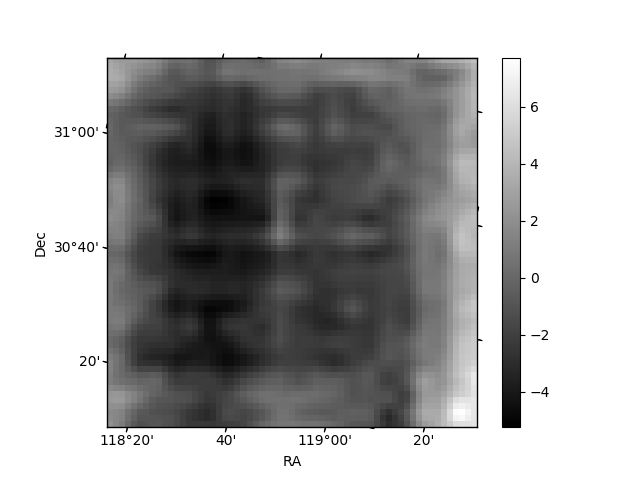
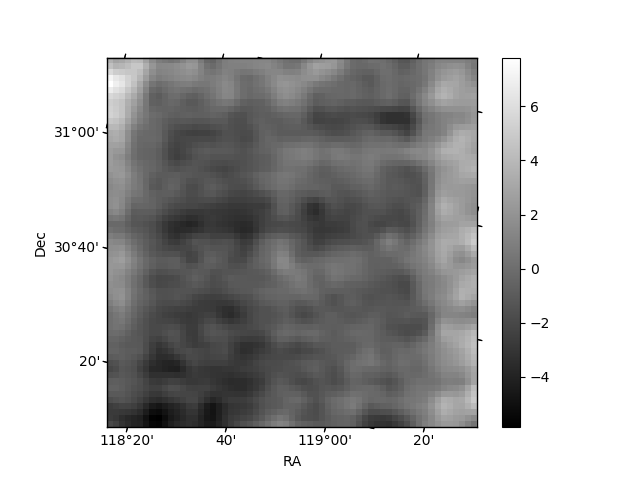
Histogram calculated using DETX and DETY for each event in the final _common_clean file
| Quadrant A | 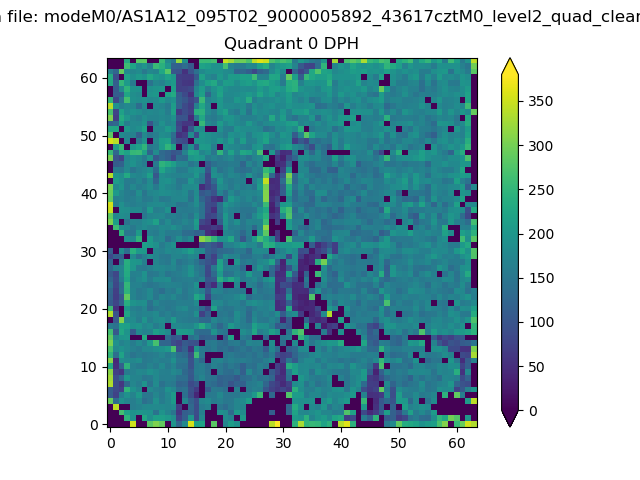 |
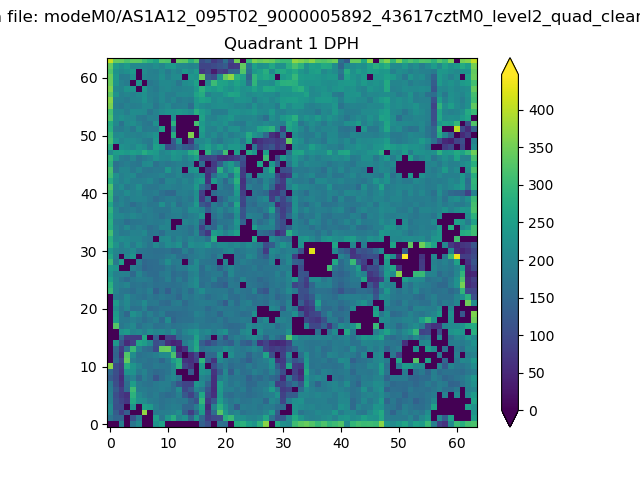 |
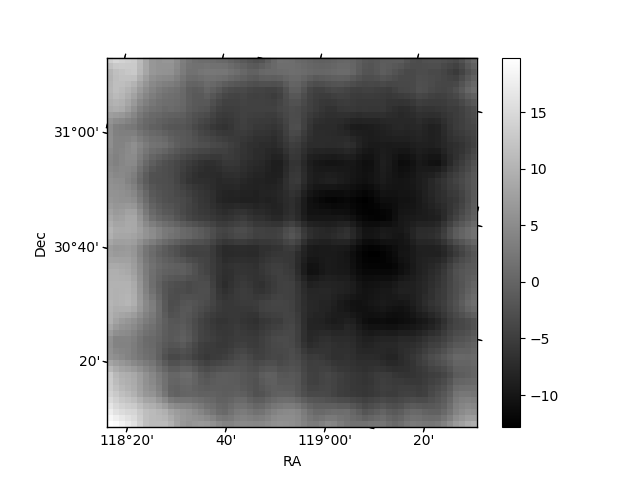
Quadrant B |
|---|---|---|---|
| Quadrant D | 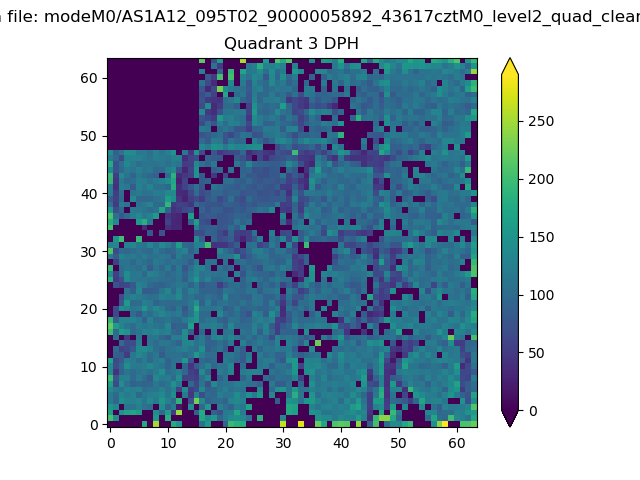 |
 |
Quadrant C |
| Plot type | Count rate plots | Images |
|---|---|---|
| Comparison with Poisson distribution Blue bars denote a histogram of data divided into 1 sec bins. Red curve is a Poisson curve with rate = median count rate of data. |
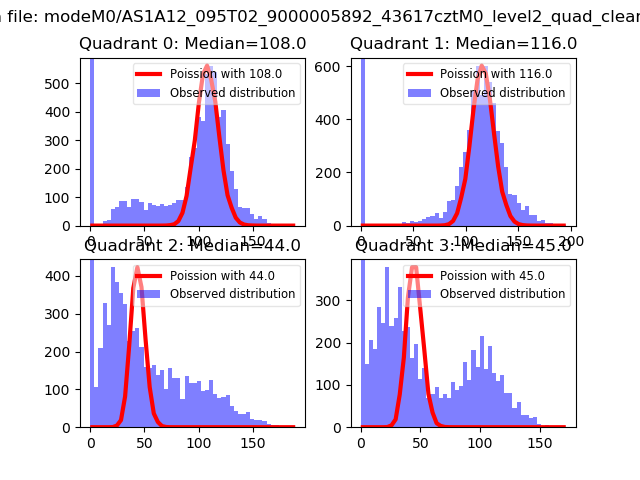 |
 |
| Quadrant-wise count rates Data is divided into 100 sec bins |
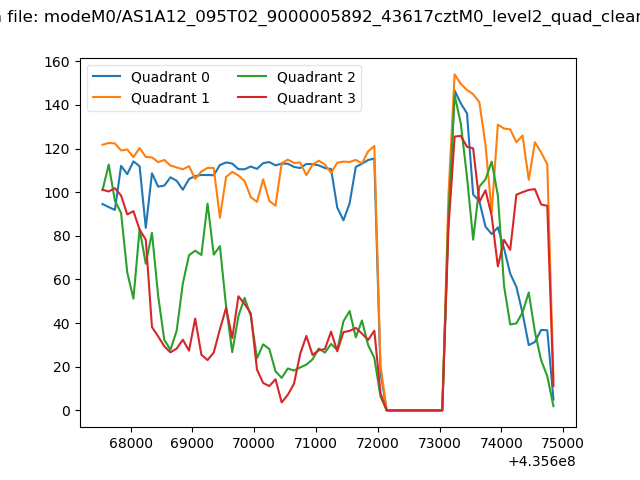 |
|
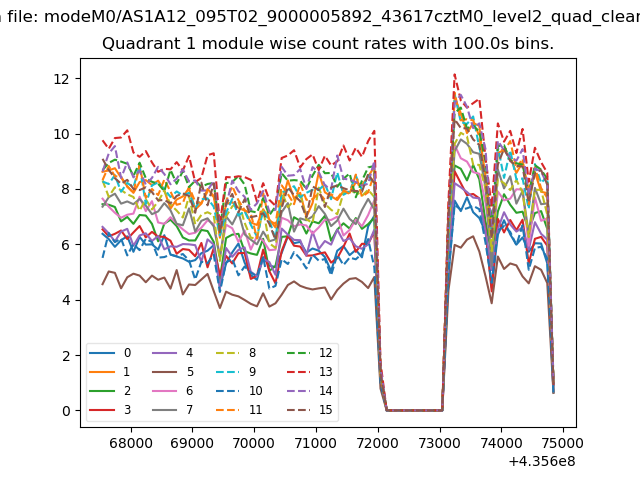
| Module-wise count rates for Quadrant A Data is divided into 100 sec bins |
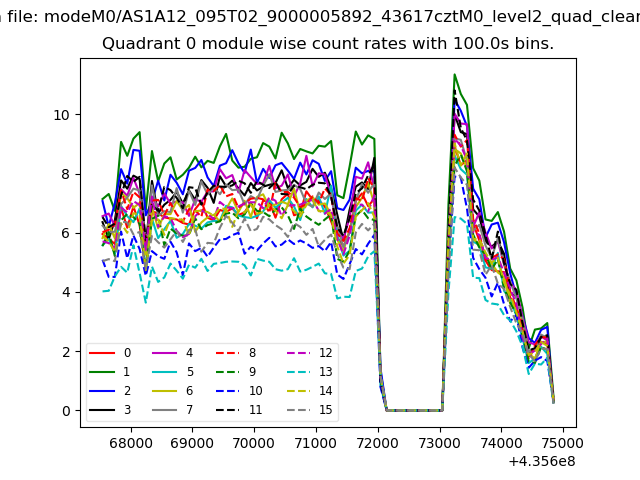 |
 |
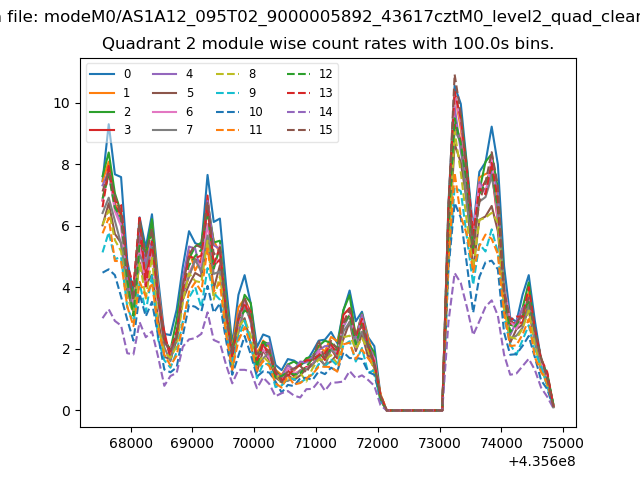
| Module-wise count rates for Quadrant B Data is divided into 100 sec bins |
 |
 |
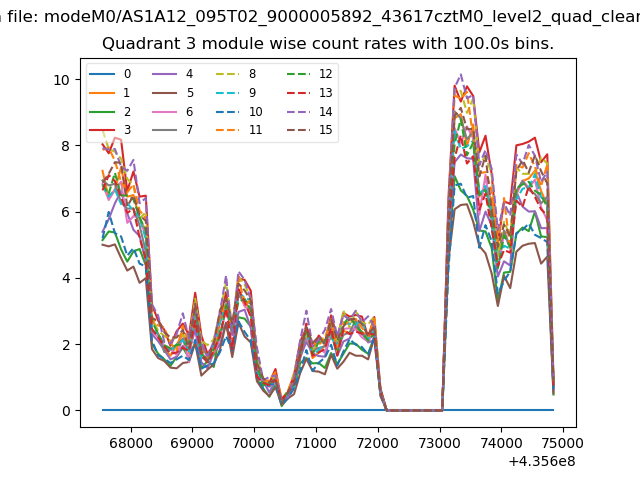
| Module-wise count rates for Quadrant C Data is divided into 100 sec bins |
 |
 |
| Module-wise count rates for Quadrant D Data is divided into 100 sec bins |
 |
 |
| Parameter | Plot |
|---|---|
| CZT HV Monitor | 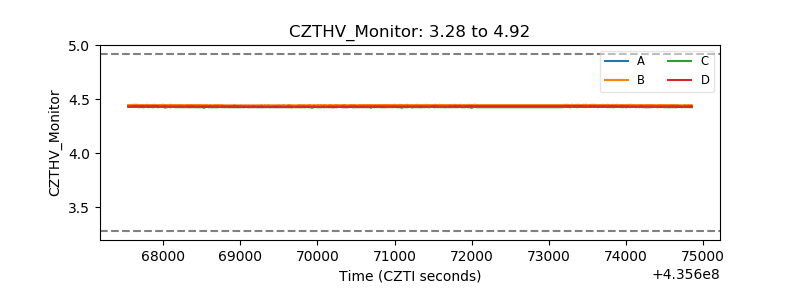 |
| D_VDD | 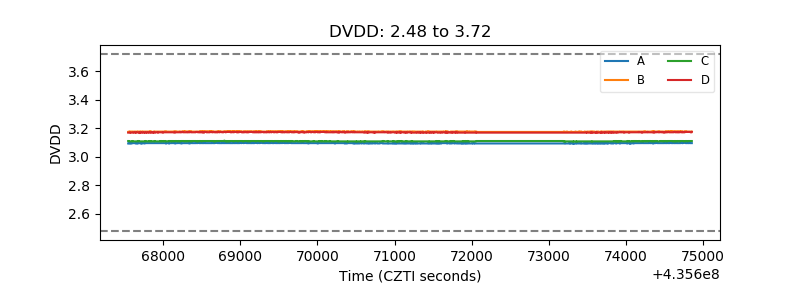 |
| Temperature 1 | 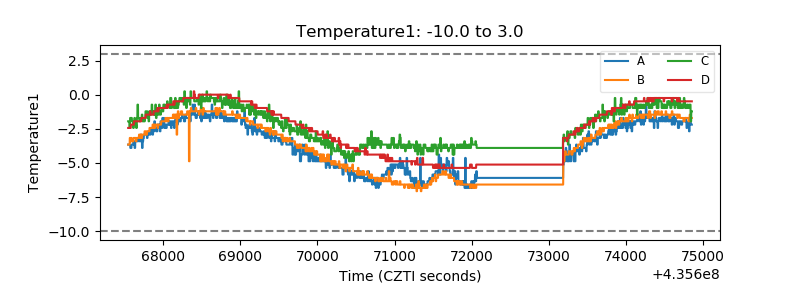 |
| Veto HV Monitor | 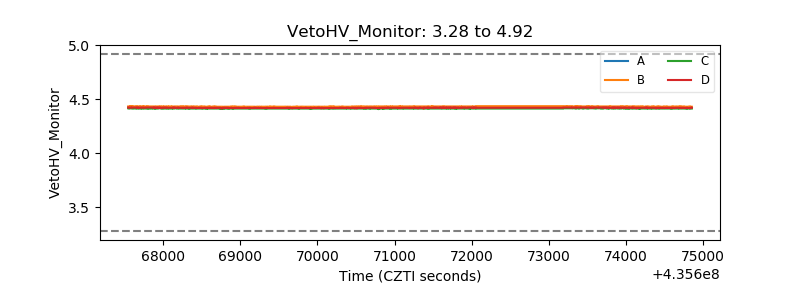 |
| Veto LLD | 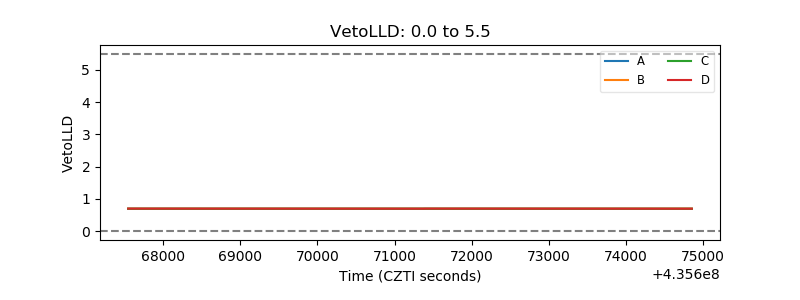 |
| Alpha Counter | 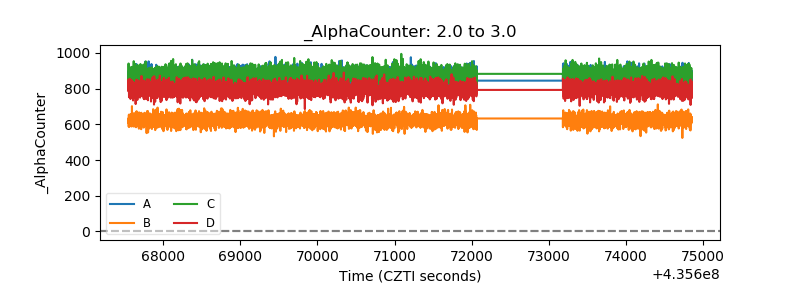 |
| _CPM_Rate | 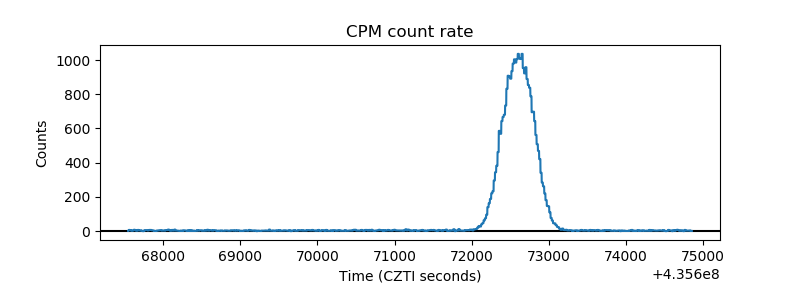 |
| CZT Counter | 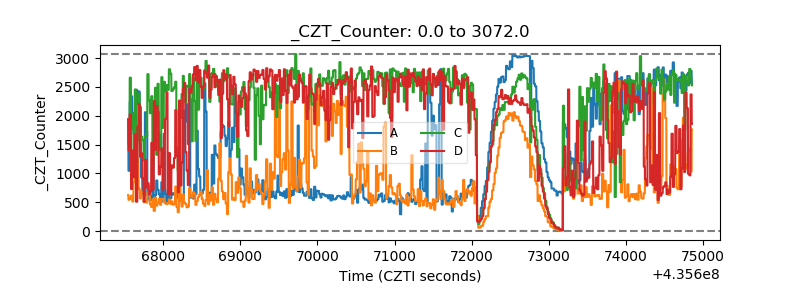 |
| +2.5 Volts monitor | 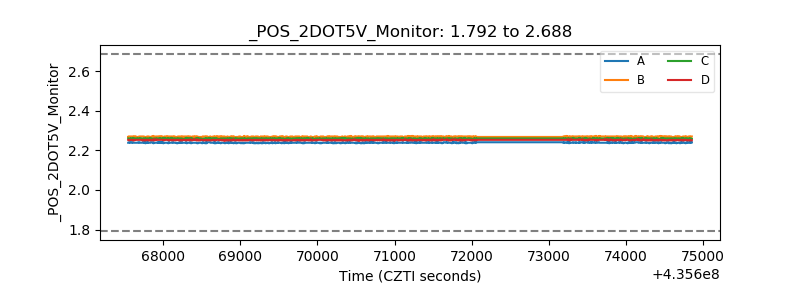 |
| +5 Volts monitor | 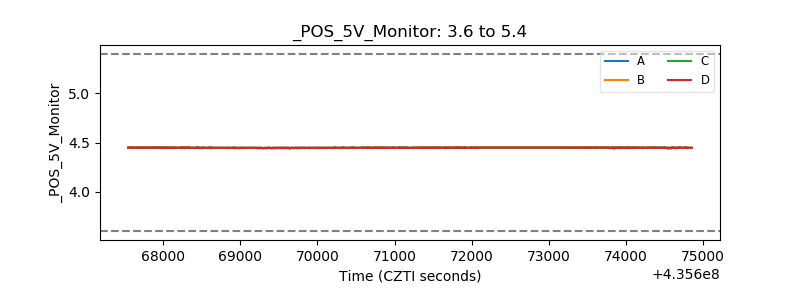 |
| _ROLL_ROT | 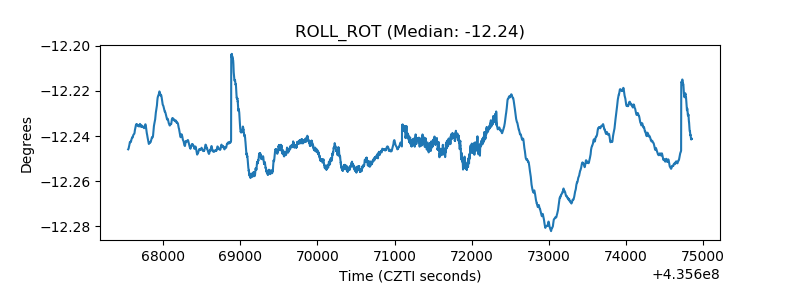 |
| _Roll_DEC | 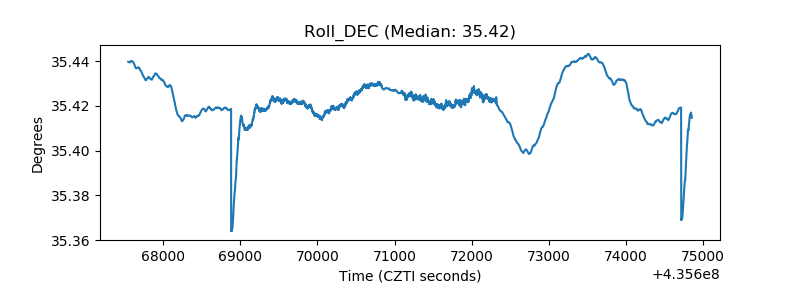 |
| _Roll_RA | 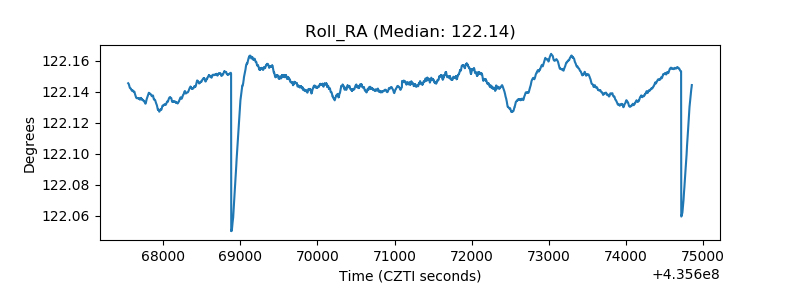 |
| Veto Counter | 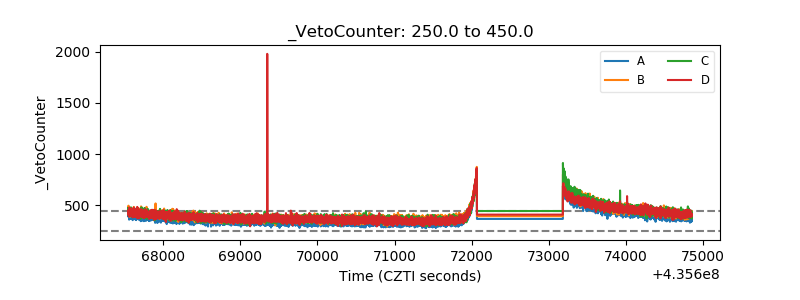 |