| Param | Original file | Final file |
|---|---|---|
| Filename | modeM0/AS1A12_095T02_9000005892_43618cztM0_level2.fits | modeM0/AS1A12_095T02_9000005892_43618cztM0_level2_quad_clean.evt |
| Size (bytes) | 1,101,199,680 | 80,190,720 |
| Size | 1.0 GB | 76.5 MB |
| Events in quadrant A | 11,342,241 | 501,993 |
| Events in quadrant B | 4,612,700 | 714,347 |
| Events in quadrant C | 13,979,508 | 304,227 |
| Events in quadrant D | 10,381,163 | 496,487 |
| Mode M9 | |||
|---|---|---|---|
| Quadrant | BADHDUFLAG | Total packets | Discarded packets |
| A | 0 | 12 | 0 |
| B | 0 | 12 | 0 |
| C | 0 | 12 | 0 |
| D | 0 | 12 | 0 |
| Mode M0 | |||
|---|---|---|---|
| Quadrant | BADHDUFLAG | Total packets | Discarded packets |
| A | 0 | 37804 | 1 |
| B | 0 | 17708 | 1 |
| C | 0 | 45564 | 1 |
| D | 0 | 34928 | 1 |
| Mode SS | |||
|---|---|---|---|
| Quadrant | BADHDUFLAG | Total packets | Discarded packets |
| A | 0 | 116 | 0 |
| B | 0 | 116 | 0 |
| C | 0 | 116 | 0 |
| D | 0 | 116 | 0 |
| Quadrant | Total seconds | Saturated seconds | Saturation percentage |
|---|---|---|---|
| A | 5809 | 3549 | 61.094853% |
| B | 5809 | 312 | 5.370976% |
| C | 5809 | 4969 | 85.539680% |
| D | 5809 | 3050 | 52.504734% |
Noise dominated data is calculated using 1-second bins in cleaned event files. If a bin has >2000 counts, and if more than 50% of those come from <1% of pixels, then it is considered to be noise-dominated and hence unusable.
| Quadrant | # 1 sec bins | Bins with >0 counts | Bins with >2000 counts | High rate bins dominated by noise | Noise dominated (total time) | Noise dominated (detector-on time) | Marked lightcurve |
|---|---|---|---|---|---|---|---|
| A | 6974 | 5809 | 3343 | 3343 | 47.94% | 57.55% | 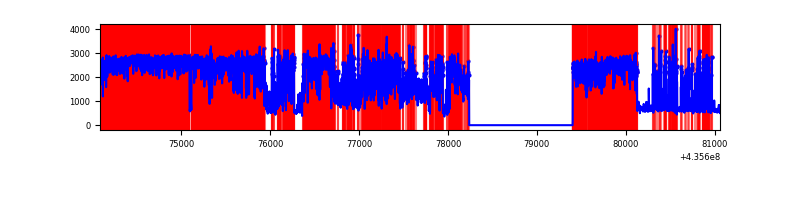 |
| B | 6974 | 5809 | 169 | 169 | 2.42% | 2.91% | 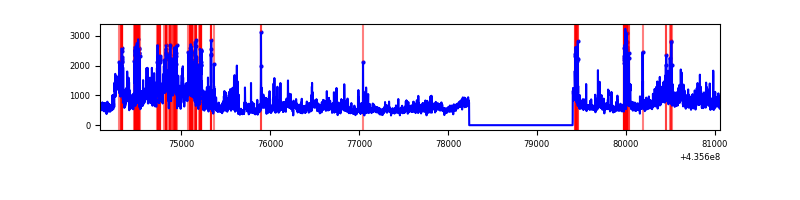 |
| C | 6973 | 5808 | 4856 | 4856 | 69.64% | 83.61% | 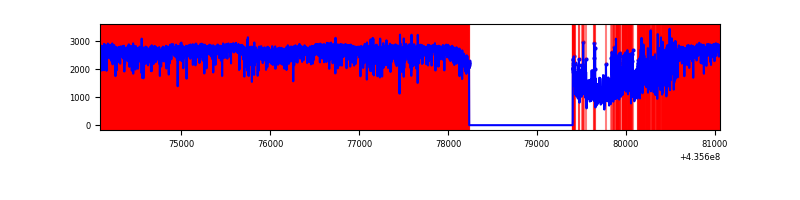 |
| D | 6974 | 5809 | 2479 | 2479 | 35.55% | 42.68% | 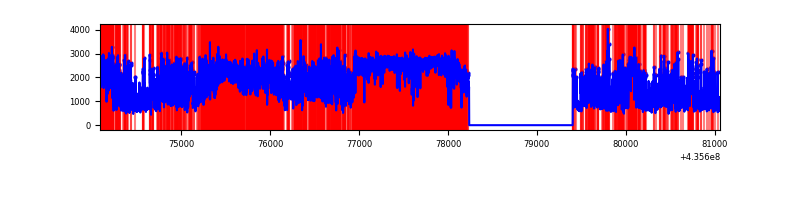 |
Top three noisy pixels from each quadrant. If the there are fewer than three noisy pixels in the level2.evt file, extra rows are filled as -1
| Pixel properties | Quadrant properties | ||||||
|---|---|---|---|---|---|---|---|
| Quadrant | DetID | PixID | Counts | Sigma | Mean | Median | Sigma |
| A | 0 | 50 | 7918336 | 76738.86 | 500 | 490 | 103.2 |
| A | 14 | 239 | 757659 | 7338.4 | 500 | 490 | 103.2 |
| A | 10 | 83 | 528978 | 5122.05 | 500 | 490 | 103.2 |
| B | 0 | 155 | 569569 | 4296.04 | 693 | 674 | 132.4 |
| B | 4 | 206 | 416792 | 3142.34 | 693 | 674 | 132.4 |
| B | 5 | 235 | 398740 | 3006.02 | 693 | 674 | 132.4 |
| C | 15 | 174 | 7068248 | 97198.47 | 312 | 314 | 72.7 |
| C | 15 | 142 | 1955447 | 26887.06 | 312 | 314 | 72.7 |
| C | 3 | 233 | 1329688 | 18281.6 | 312 | 314 | 72.7 |
| D | 4 | 216 | 2170438 | 13722.14 | 560 | 544 | 158.1 |
| D | 4 | 212 | 883343 | 5582.71 | 560 | 544 | 158.1 |
| D | 4 | 235 | 769168 | 4860.68 | 560 | 544 | 158.1 |
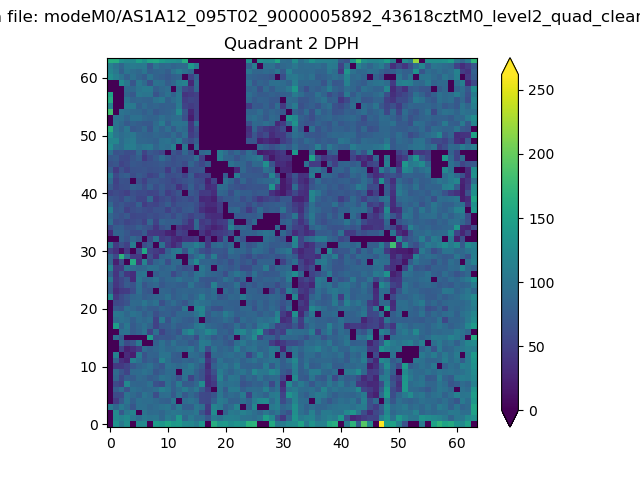
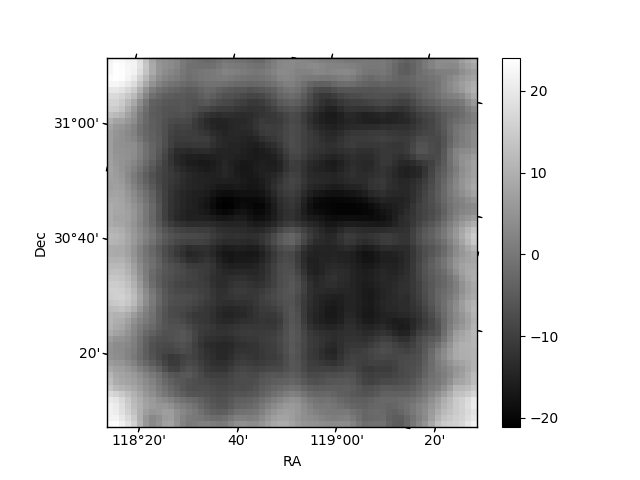
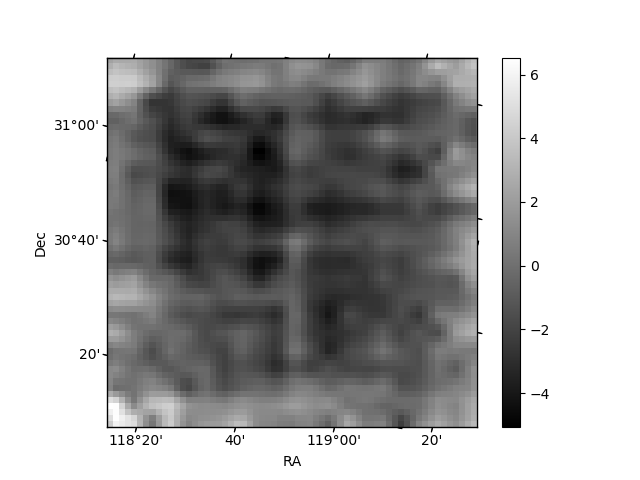
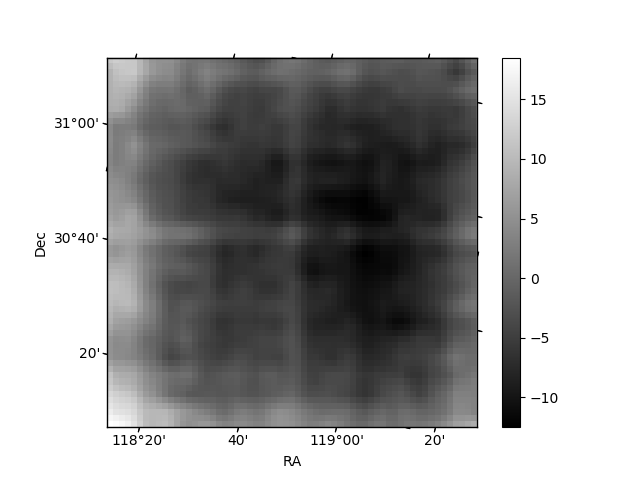
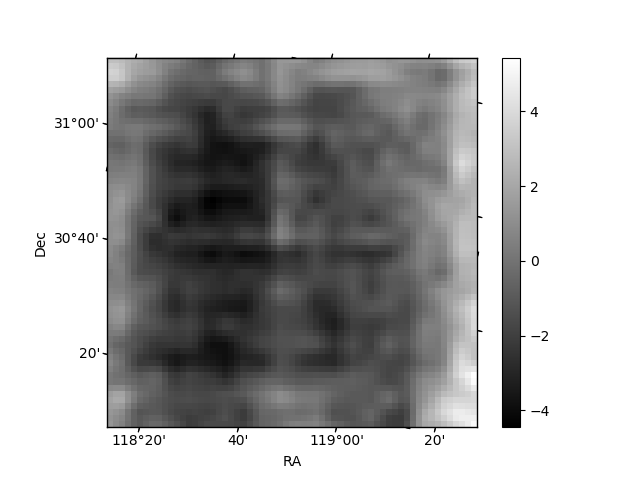
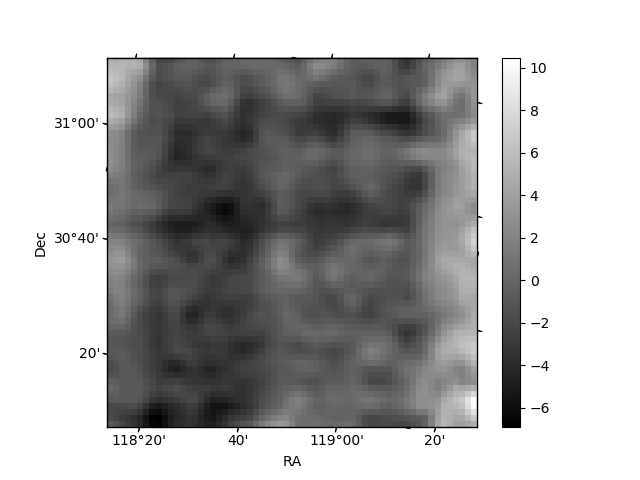
Histogram calculated using DETX and DETY for each event in the final _common_clean file
| Quadrant A | 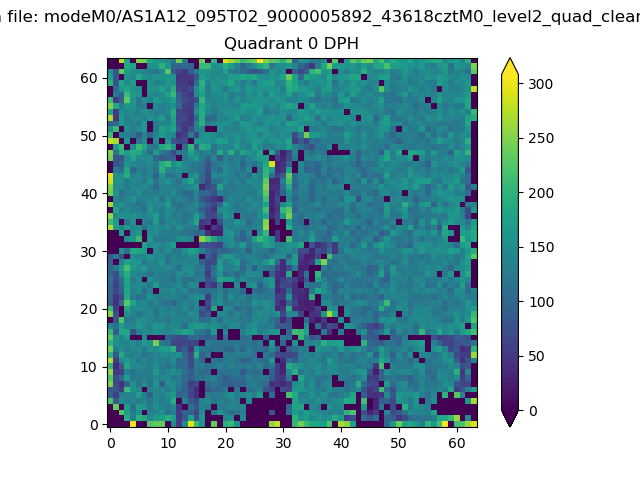 |
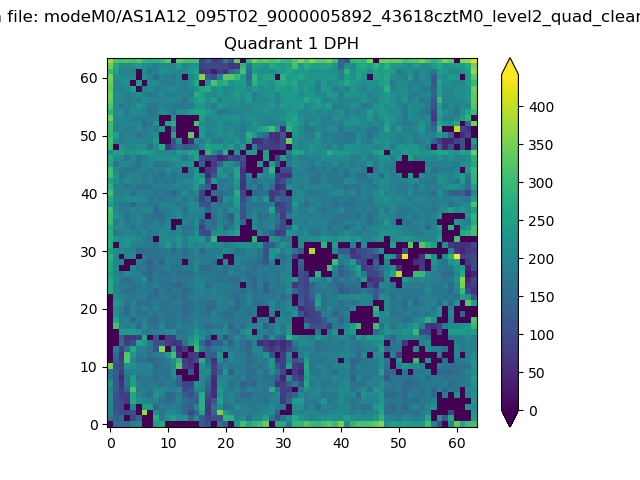 |
Quadrant B |
|---|---|---|---|
| Quadrant D | 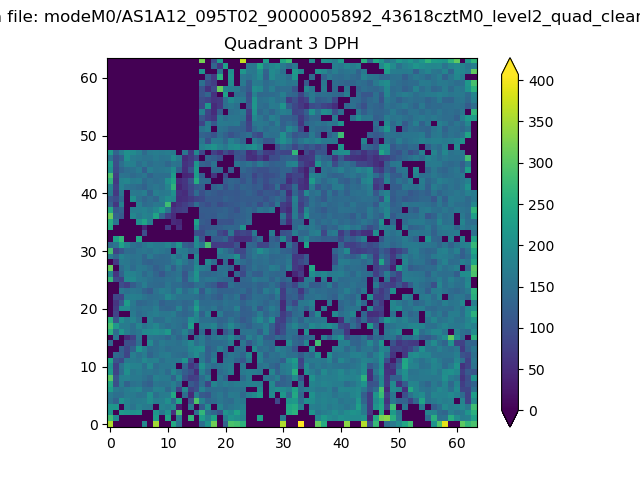 |
 |
Quadrant C |
| Plot type | Count rate plots | Images |
|---|---|---|
| Comparison with Poisson distribution Blue bars denote a histogram of data divided into 1 sec bins. Red curve is a Poisson curve with rate = median count rate of data. |
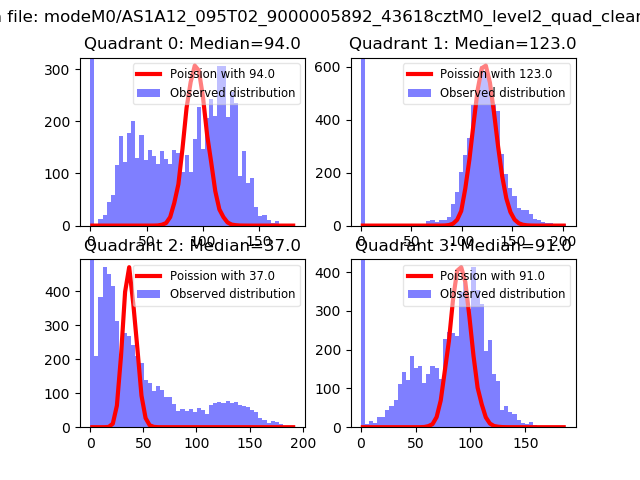 |
 |
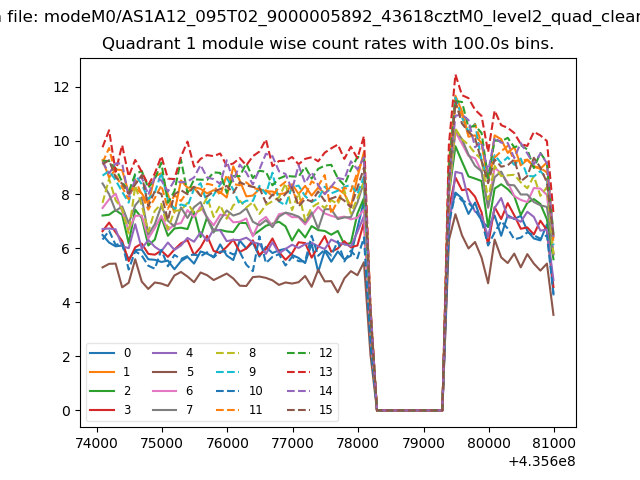
| Quadrant-wise count rates Data is divided into 100 sec bins |
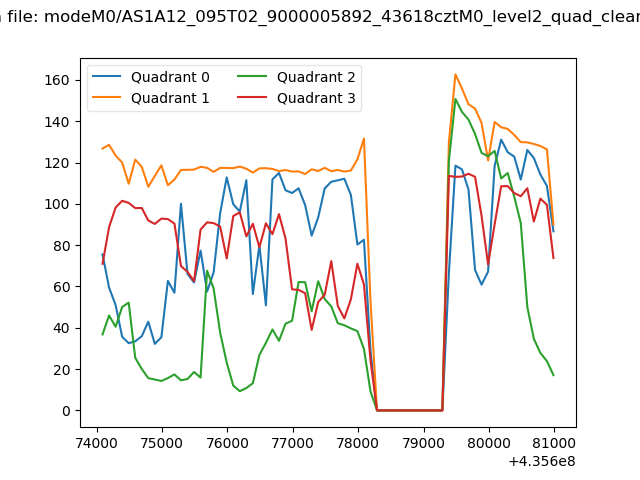 |
|
| Module-wise count rates for Quadrant A Data is divided into 100 sec bins |
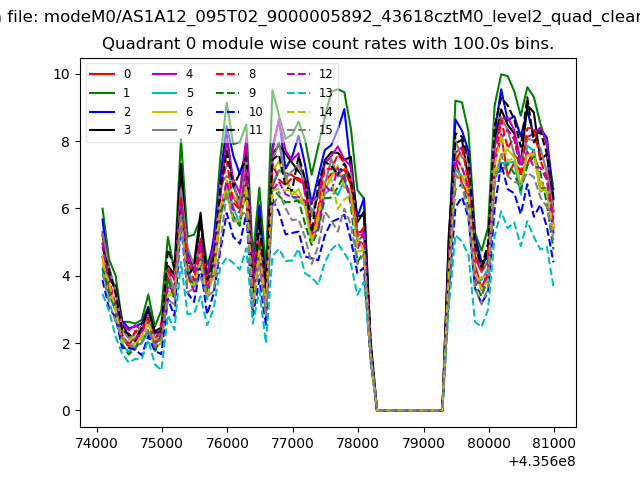 |
 |
| Module-wise count rates for Quadrant B Data is divided into 100 sec bins |
 |
 |
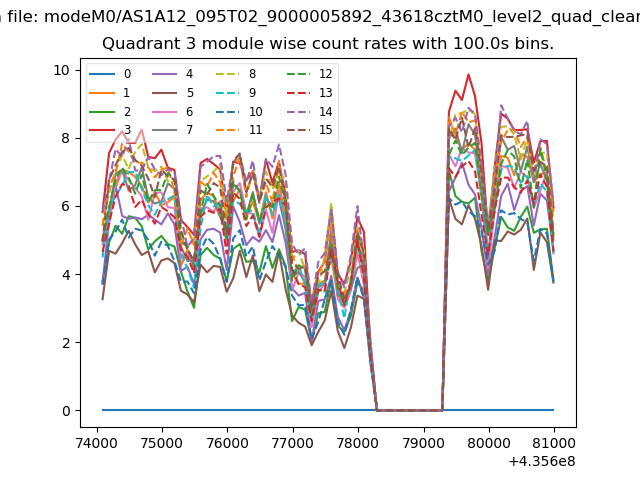
| Module-wise count rates for Quadrant C Data is divided into 100 sec bins |
 |
 |
| Module-wise count rates for Quadrant D Data is divided into 100 sec bins |
 |
 |
| Parameter | Plot |
|---|---|
| CZT HV Monitor | 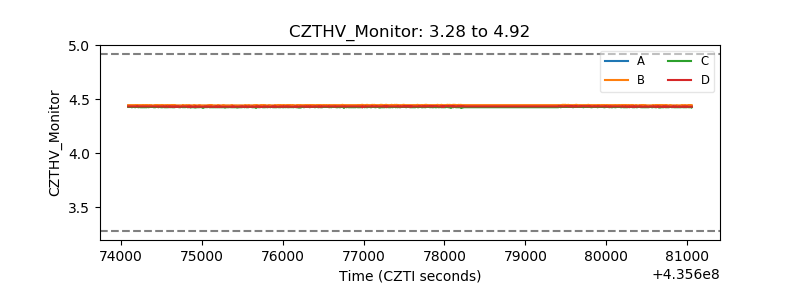 |
| D_VDD | 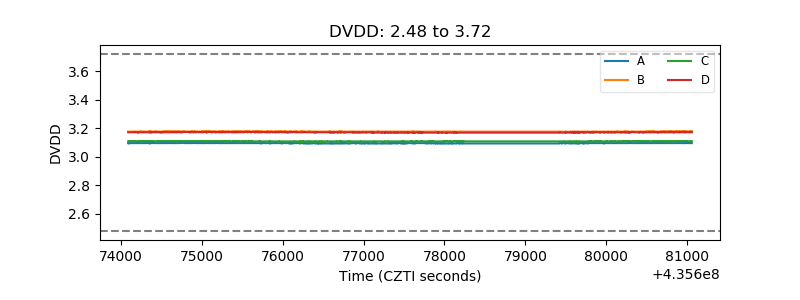 |
| Temperature 1 | 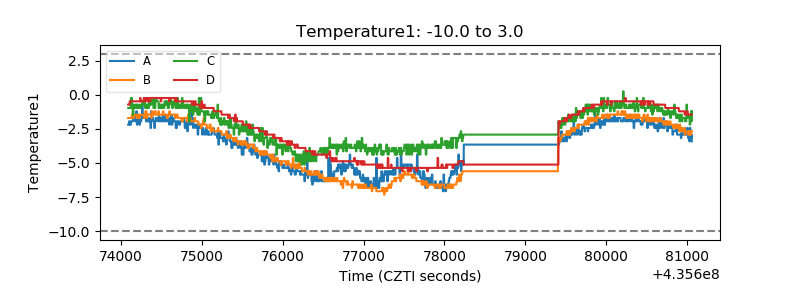 |
| Veto HV Monitor | 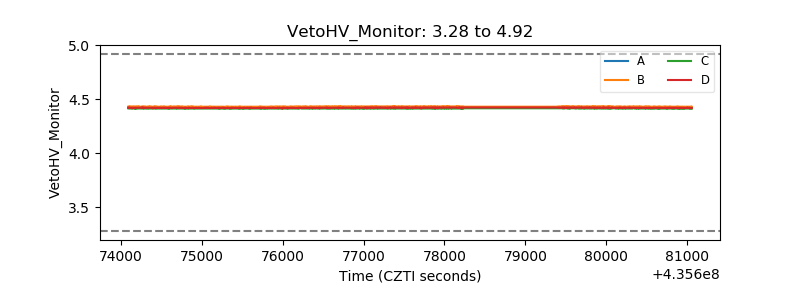 |
| Veto LLD | 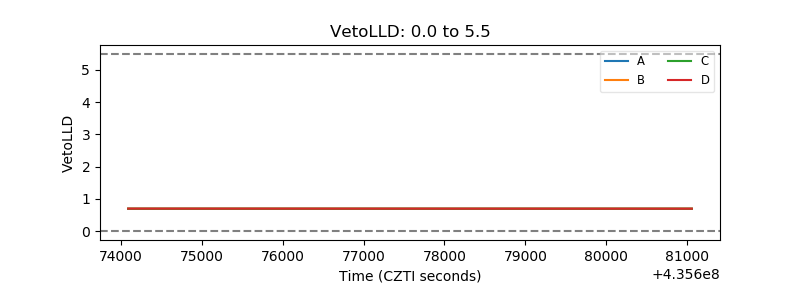 |
| Alpha Counter | 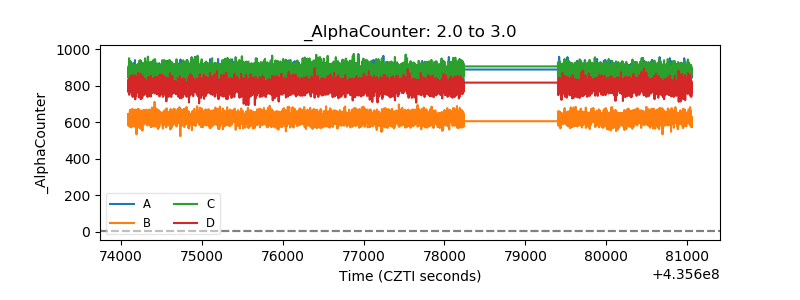 |
| _CPM_Rate | 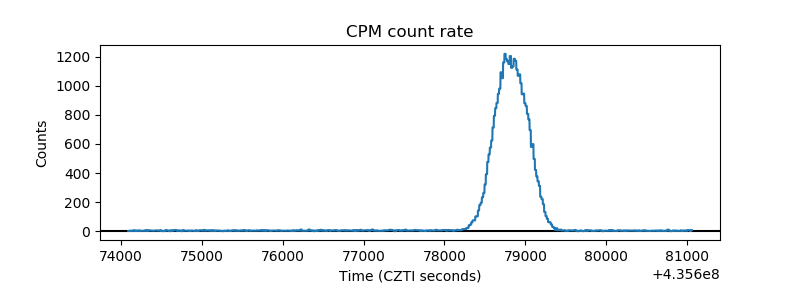 |
| CZT Counter | 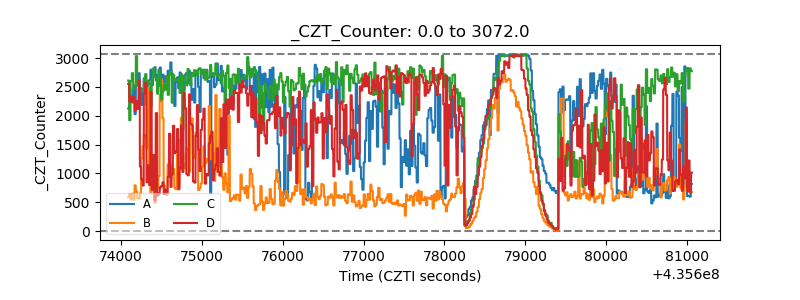 |
| +2.5 Volts monitor | 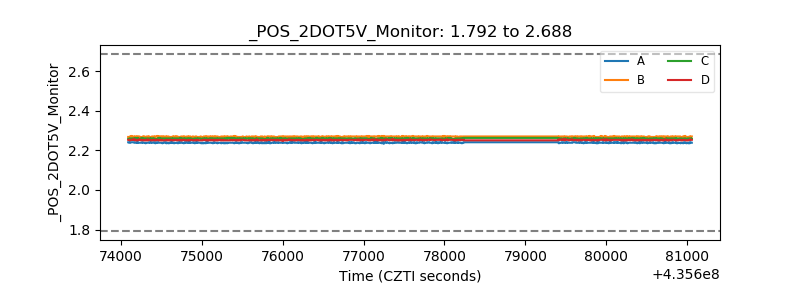 |
| +5 Volts monitor | 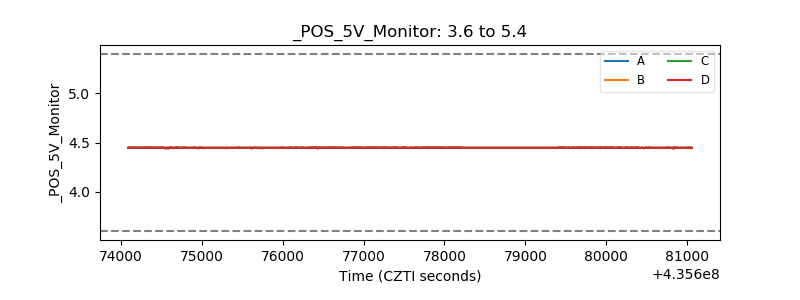 |
| _ROLL_ROT | 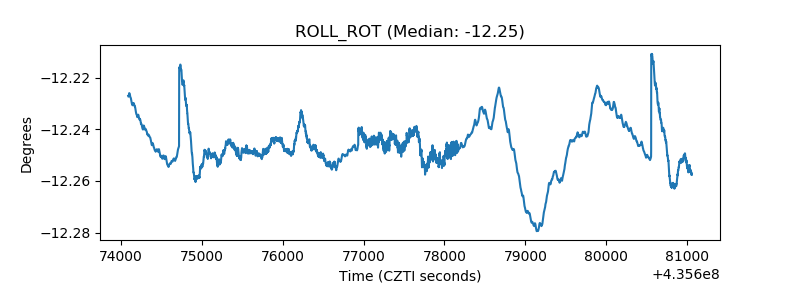 |
| _Roll_DEC | 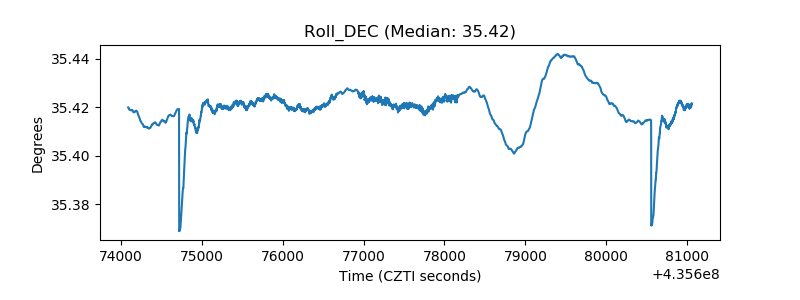 |
| _Roll_RA | 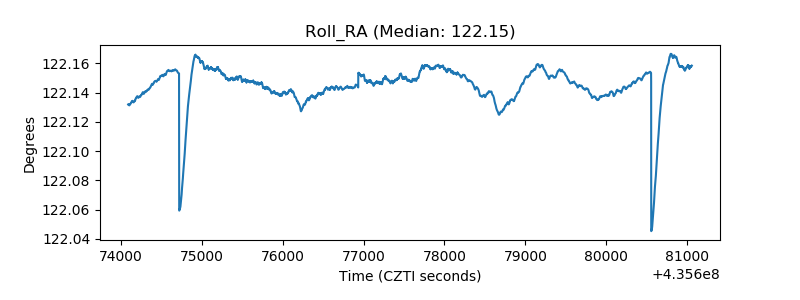 |
| Veto Counter | 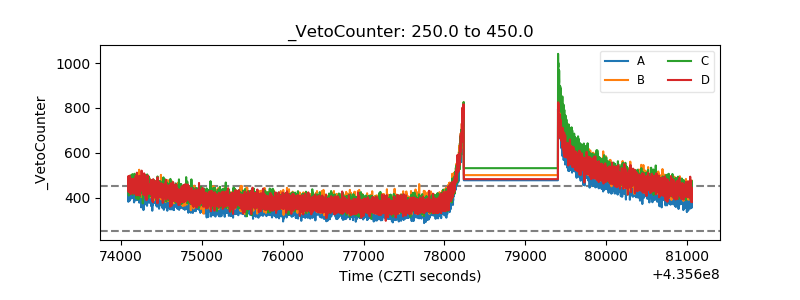 |