| Param | Original file | Final file |
|---|---|---|
| Filename | modeM0/AS1A12_095T02_9000005892_43621cztM0_level2.fits | modeM0/AS1A12_095T02_9000005892_43621cztM0_level2_quad_clean.evt |
| Size (bytes) | 1,086,232,320 | 94,259,520 |
| Size | 1.0 GB | 89.9 MB |
| Events in quadrant A | 4,219,250 | 761,597 |
| Events in quadrant B | 5,137,979 | 760,764 |
| Events in quadrant C | 15,572,780 | 386,561 |
| Events in quadrant D | 14,769,459 | 479,215 |
| Mode M9 | |||
|---|---|---|---|
| Quadrant | BADHDUFLAG | Total packets | Discarded packets |
| A | 0 | 8 | 0 |
| B | 0 | 8 | 0 |
| C | 0 | 8 | 0 |
| D | 0 | 8 | 0 |
| Mode M0 | |||
|---|---|---|---|
| Quadrant | BADHDUFLAG | Total packets | Discarded packets |
| A | 0 | 17074 | 2 |
| B | 0 | 19813 | 2 |
| C | 0 | 50853 | 2 |
| D | 0 | 48360 | 2 |
| Mode SS | |||
|---|---|---|---|
| Quadrant | BADHDUFLAG | Total packets | Discarded packets |
| A | 0 | 136 | 0 |
| B | 0 | 136 | 0 |
| C | 0 | 136 | 0 |
| D | 0 | 136 | 0 |
| Quadrant | Total seconds | Saturated seconds | Saturation percentage |
|---|---|---|---|
| A | 6596 | 171 | 2.592480% |
| B | 6597 | 504 | 7.639836% |
| C | 6597 | 5501 | 83.386388% |
| D | 6597 | 5310 | 80.491132% |
Noise dominated data is calculated using 1-second bins in cleaned event files. If a bin has >2000 counts, and if more than 50% of those come from <1% of pixels, then it is considered to be noise-dominated and hence unusable.
| Quadrant | # 1 sec bins | Bins with >0 counts | Bins with >2000 counts | High rate bins dominated by noise | Noise dominated (total time) | Noise dominated (detector-on time) | Marked lightcurve |
|---|---|---|---|---|---|---|---|
| A | 7516 | 6597 | 29 | 29 | 0.39% | 0.44% | 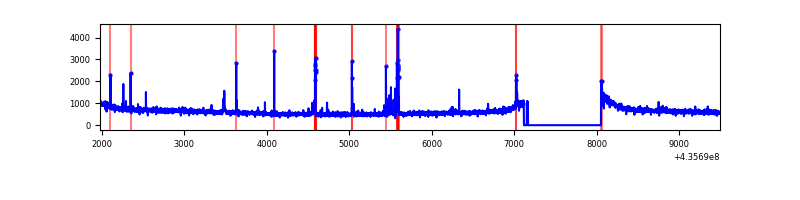 |
| B | 7517 | 6598 | 271 | 271 | 3.61% | 4.11% | 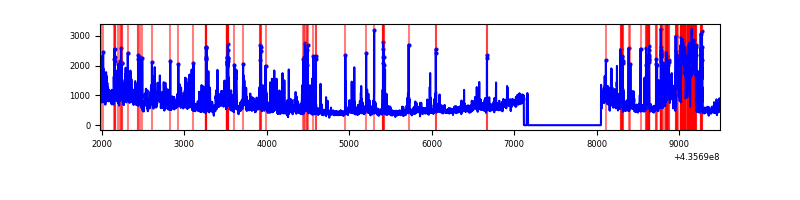 |
| C | 7516 | 6596 | 5232 | 5232 | 69.61% | 79.32% | 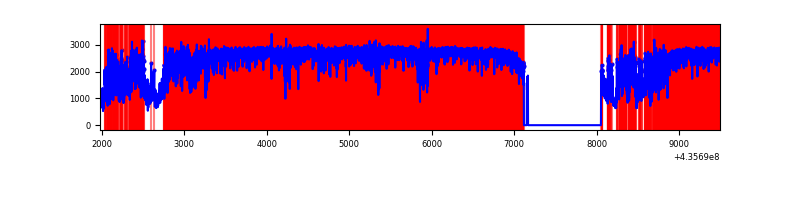 |
| D | 7517 | 6597 | 4881 | 4881 | 64.93% | 73.99% | 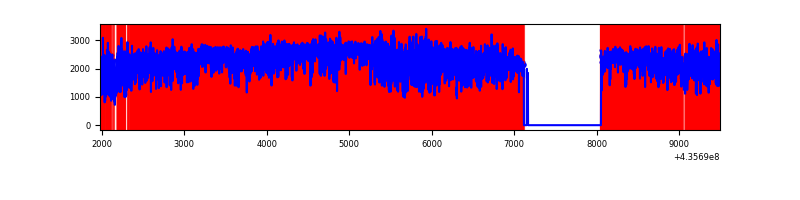 |
Top three noisy pixels from each quadrant. If the there are fewer than three noisy pixels in the level2.evt file, extra rows are filled as -1
| Pixel properties | Quadrant properties | ||||||
|---|---|---|---|---|---|---|---|
| Quadrant | DetID | PixID | Counts | Sigma | Mean | Median | Sigma |
| A | 10 | 83 | 861030 | 5360.44 | 777 | 760 | 160.5 |
| A | 15 | 222 | 101103 | 625.25 | 777 | 760 | 160.5 |
| A | 15 | 223 | 86149 | 532.07 | 777 | 760 | 160.5 |
| B | 5 | 235 | 1099714 | 7318.21 | 765 | 742 | 150.2 |
| B | 4 | 206 | 301774 | 2004.61 | 765 | 742 | 150.2 |
| B | 0 | 219 | 172177 | 1141.61 | 765 | 742 | 150.2 |
| C | 15 | 142 | 3963851 | 40465.0 | 415 | 417 | 97.9 |
| C | 15 | 174 | 3778593 | 38573.59 | 415 | 417 | 97.9 |
| C | 15 | 126 | 3711739 | 37891.04 | 415 | 417 | 97.9 |
| D | 8 | 192 | 6472286 | 42185.04 | 550 | 529 | 153.4 |
| D | 4 | 216 | 2100308 | 13687.05 | 550 | 529 | 153.4 |
| D | 4 | 212 | 854438 | 5566.06 | 550 | 529 | 153.4 |
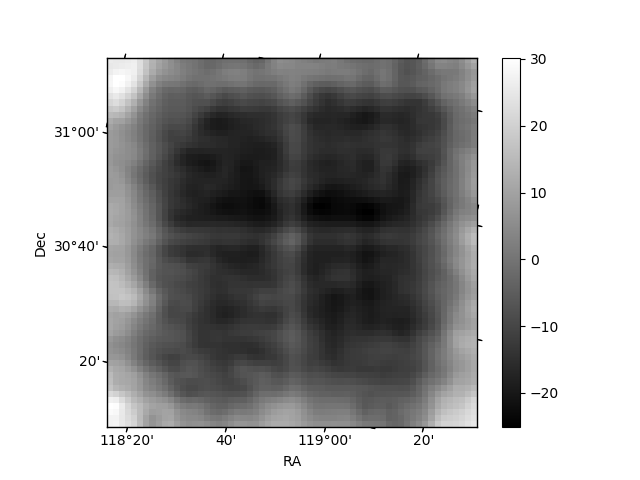
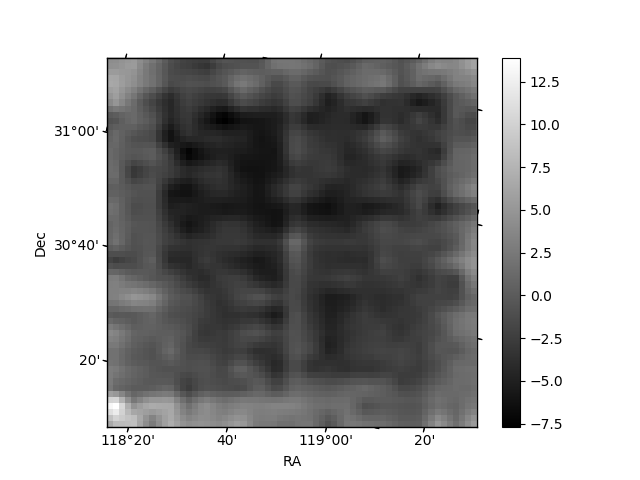
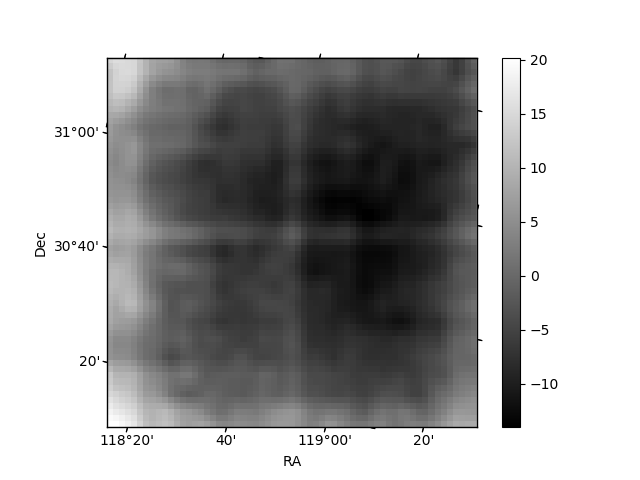
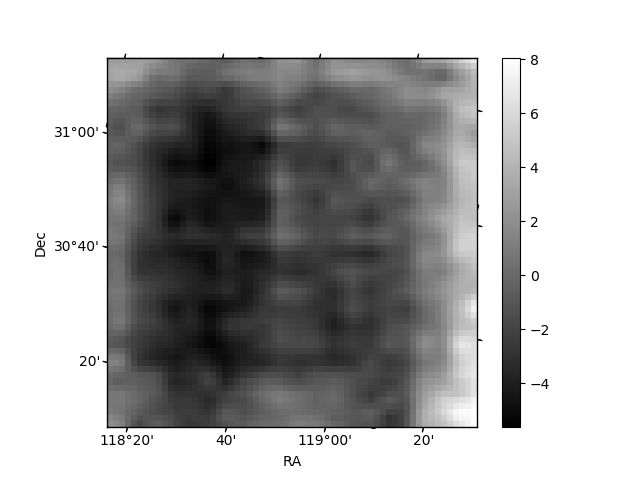
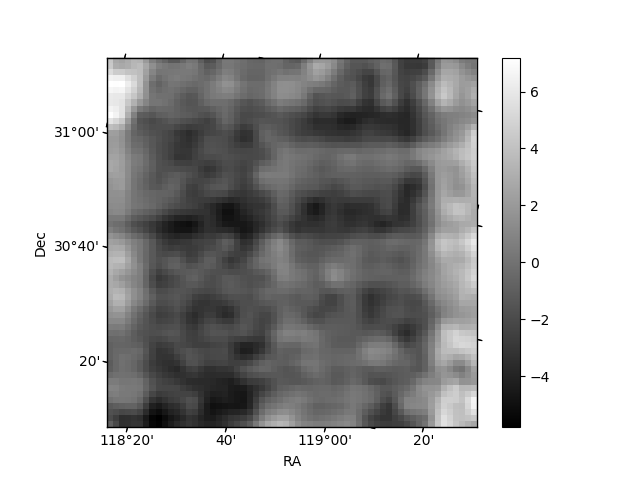
Histogram calculated using DETX and DETY for each event in the final _common_clean file
| Quadrant A | 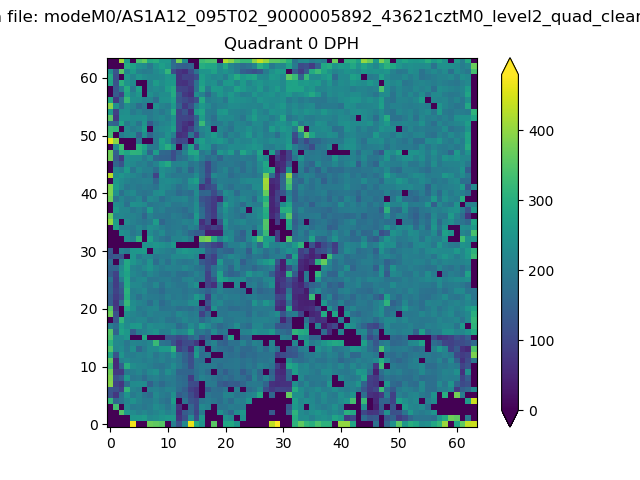 |
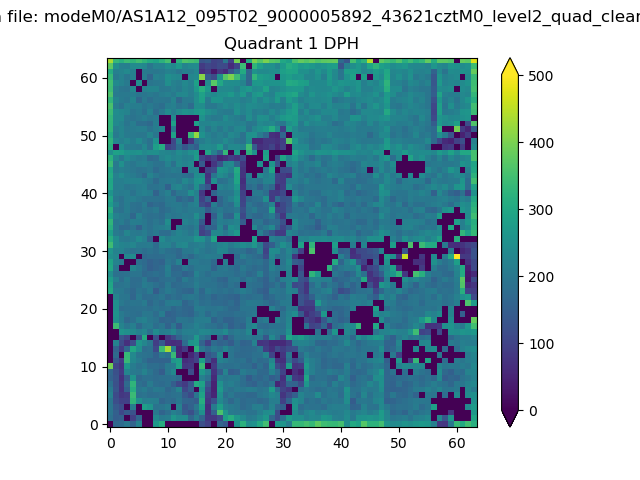 |
Quadrant B |
|---|---|---|---|
| Quadrant D | 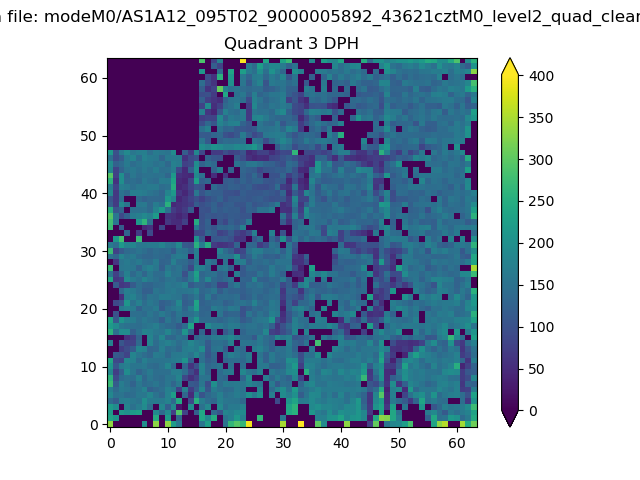 |
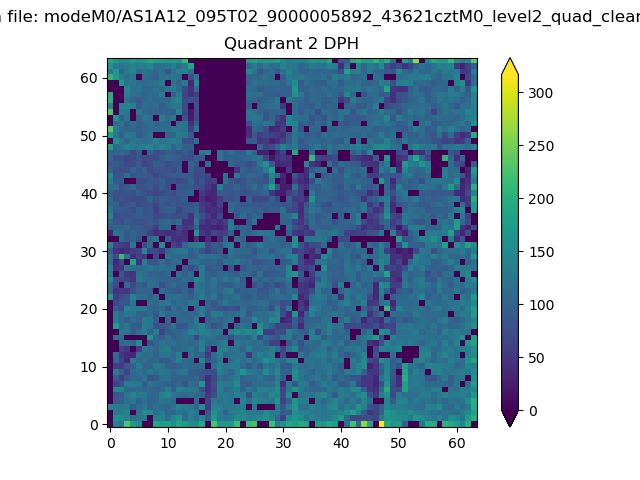 |
Quadrant C |
| Plot type | Count rate plots | Images |
|---|---|---|
| Comparison with Poisson distribution Blue bars denote a histogram of data divided into 1 sec bins. Red curve is a Poisson curve with rate = median count rate of data. |
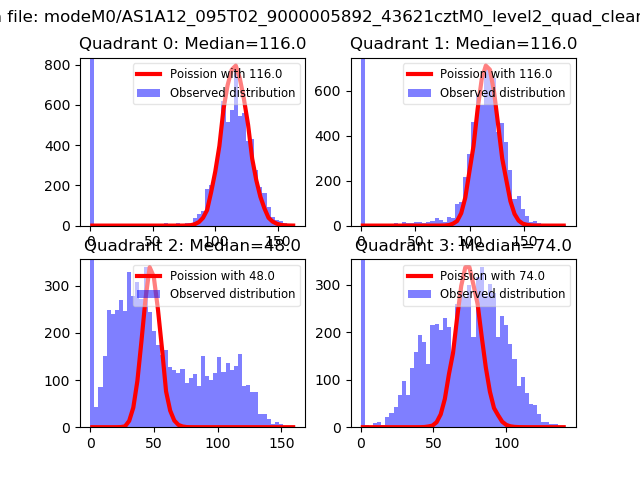 |
 |
| Quadrant-wise count rates Data is divided into 100 sec bins |
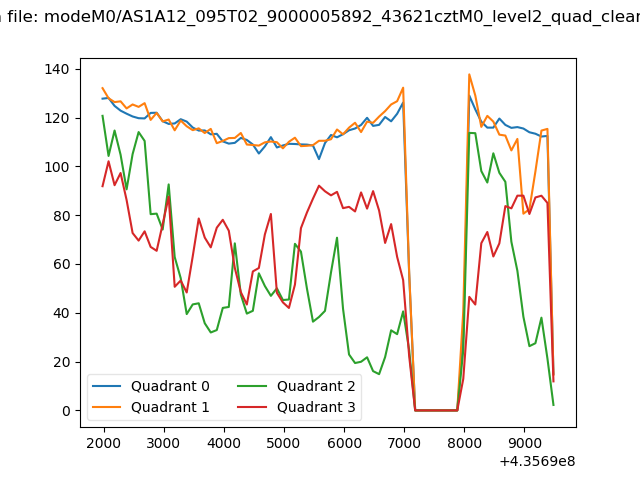 |
|
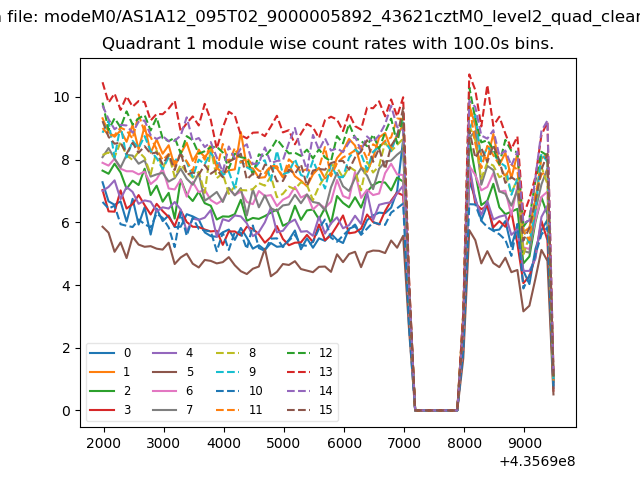
| Module-wise count rates for Quadrant A Data is divided into 100 sec bins |
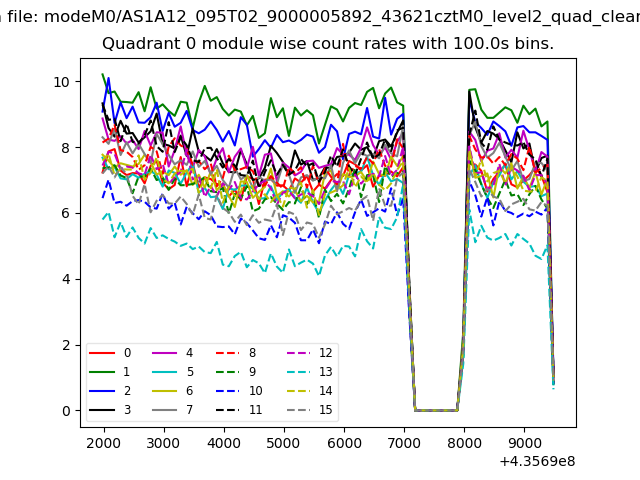 |
 |
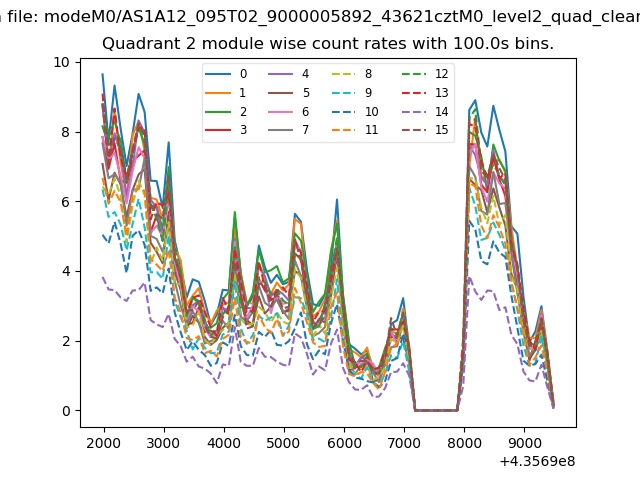
| Module-wise count rates for Quadrant B Data is divided into 100 sec bins |
 |
 |
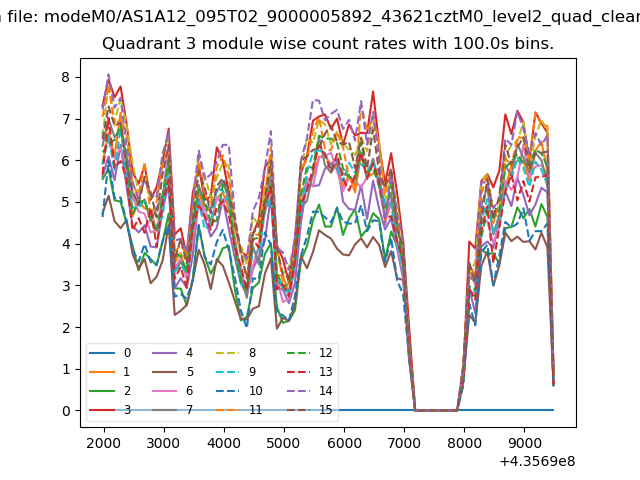
| Module-wise count rates for Quadrant C Data is divided into 100 sec bins |
 |
 |
| Module-wise count rates for Quadrant D Data is divided into 100 sec bins |
 |
 |
| Parameter | Plot |
|---|---|
| CZT HV Monitor |  |
| D_VDD | 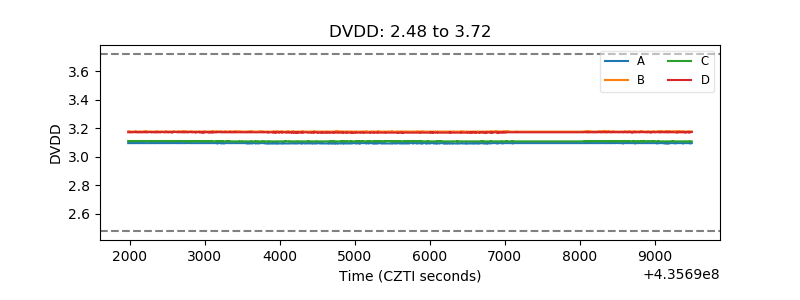 |
| Temperature 1 | 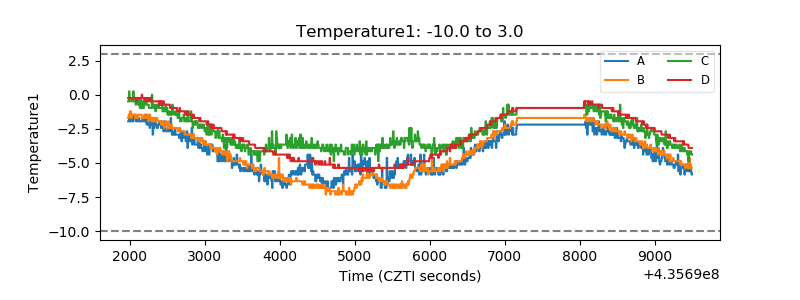 |
| Veto HV Monitor | 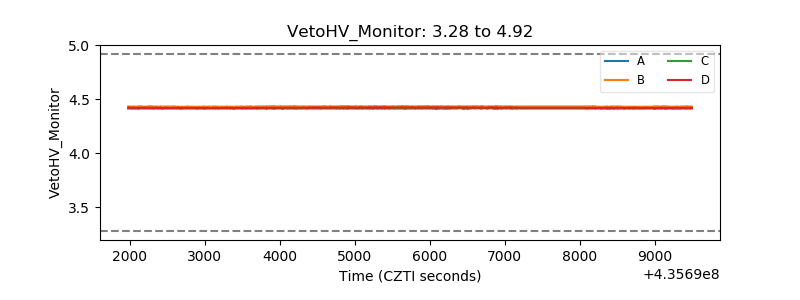 |
| Veto LLD | 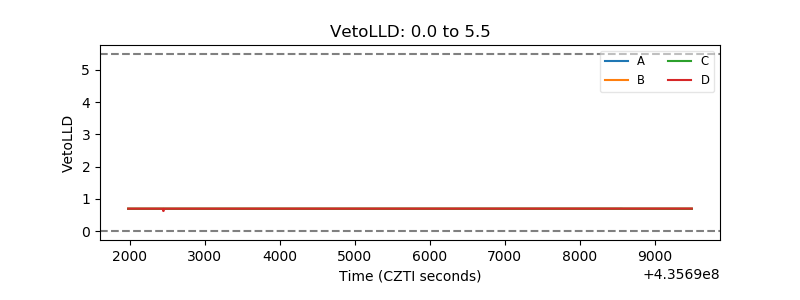 |
| Alpha Counter | 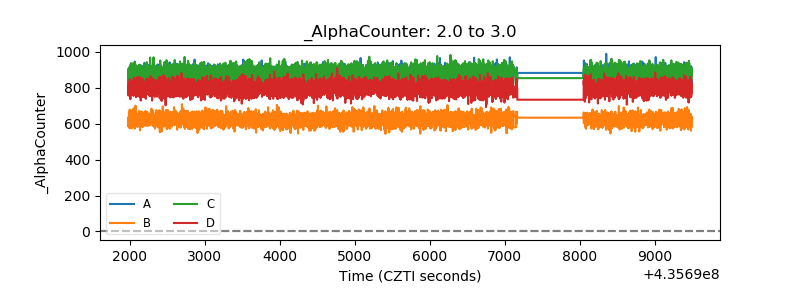 |
| _CPM_Rate | 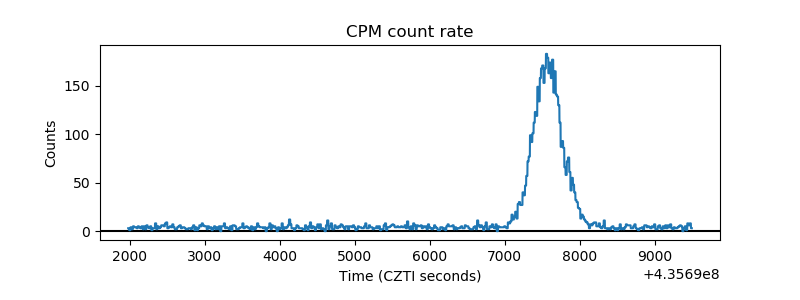 |
| CZT Counter | 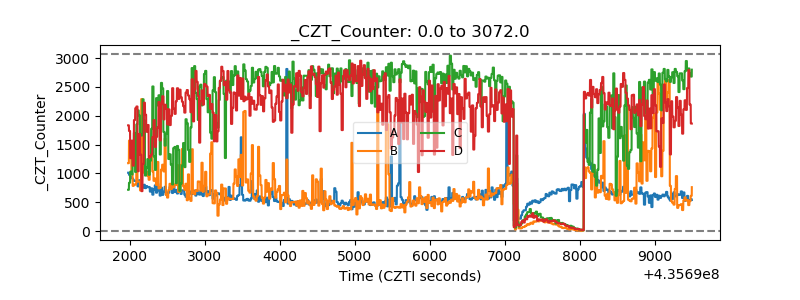 |
| +2.5 Volts monitor | 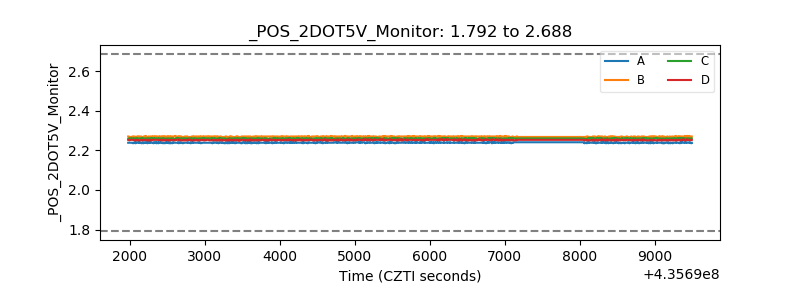 |
| +5 Volts monitor | 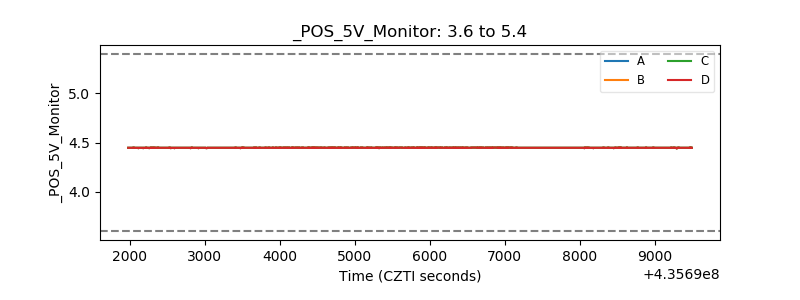 |
| _ROLL_ROT | 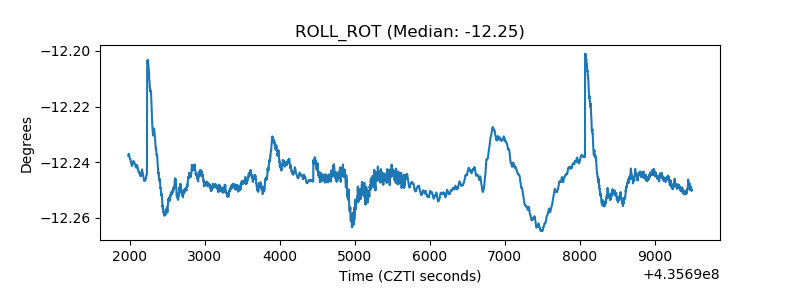 |
| _Roll_DEC | 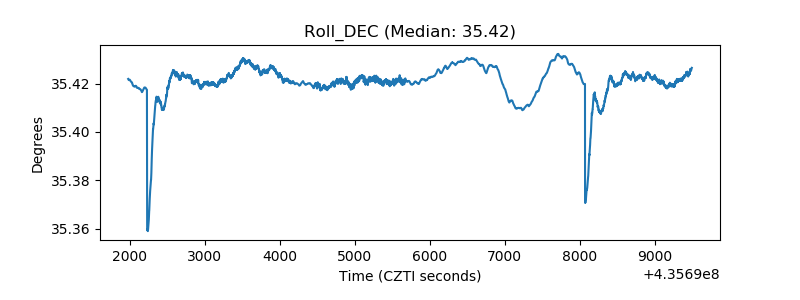 |
| _Roll_RA | 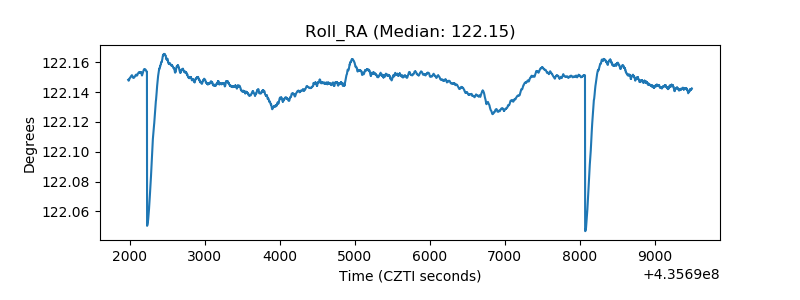 |
| Veto Counter | 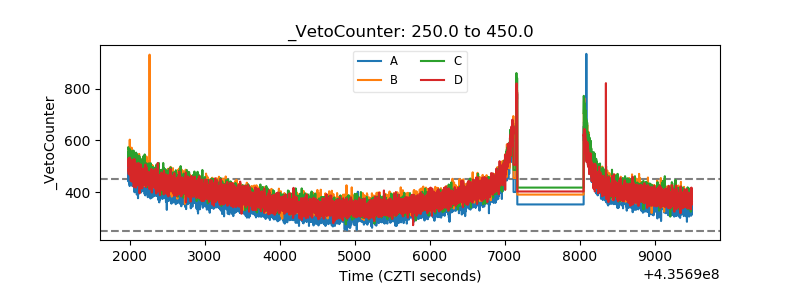 |