| Param | Original file | Final file |
|---|---|---|
| Filename | modeM0/AS1A12_095T02_9000005892_43622cztM0_level2.fits | modeM0/AS1A12_095T02_9000005892_43622cztM0_level2_quad_clean.evt |
| Size (bytes) | 1,120,155,840 | 89,159,040 |
| Size | 1.0 GB | 85.0 MB |
| Events in quadrant A | 4,091,092 | 742,695 |
| Events in quadrant B | 5,313,148 | 722,609 |
| Events in quadrant C | 16,607,976 | 314,809 |
| Events in quadrant D | 14,936,803 | 447,987 |
| Mode M9 | |||
|---|---|---|---|
| Quadrant | BADHDUFLAG | Total packets | Discarded packets |
| A | 0 | 6 | 0 |
| B | 0 | 6 | 0 |
| C | 0 | 6 | 0 |
| D | 0 | 6 | 0 |
| Mode M0 | |||
|---|---|---|---|
| Quadrant | BADHDUFLAG | Total packets | Discarded packets |
| A | 0 | 16609 | 1 |
| B | 0 | 20472 | 1 |
| C | 0 | 53933 | 6 |
| D | 0 | 48937 | 1 |
| Mode SS | |||
|---|---|---|---|
| Quadrant | BADHDUFLAG | Total packets | Discarded packets |
| A | 0 | 136 | 0 |
| B | 0 | 136 | 0 |
| C | 0 | 136 | 0 |
| D | 0 | 136 | 0 |
| Quadrant | Total seconds | Saturated seconds | Saturation percentage |
|---|---|---|---|
| A | 6677 | 151 | 2.261495% |
| B | 6677 | 650 | 9.734911% |
| C | 6676 | 6095 | 91.297184% |
| D | 6676 | 5421 | 81.201318% |
Noise dominated data is calculated using 1-second bins in cleaned event files. If a bin has >2000 counts, and if more than 50% of those come from <1% of pixels, then it is considered to be noise-dominated and hence unusable.
| Quadrant | # 1 sec bins | Bins with >0 counts | Bins with >2000 counts | High rate bins dominated by noise | Noise dominated (total time) | Noise dominated (detector-on time) | Marked lightcurve |
|---|---|---|---|---|---|---|---|
| A | 7252 | 6678 | 36 | 36 | 0.50% | 0.54% | 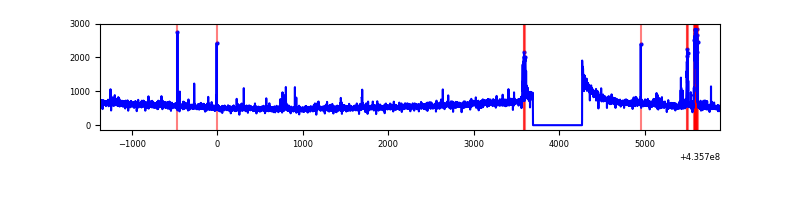 |
| B | 7252 | 6677 | 431 | 431 | 5.94% | 6.45% | 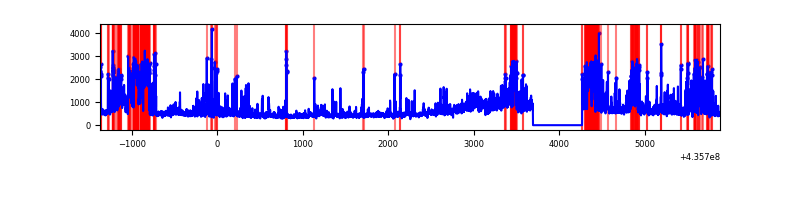 |
| C | 7250 | 6675 | 5926 | 5926 | 81.74% | 88.78% | 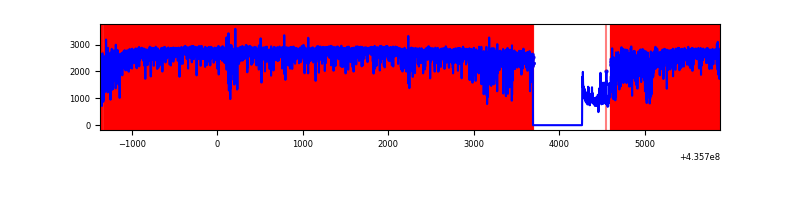 |
| D | 7250 | 6675 | 4932 | 4932 | 68.03% | 73.89% | 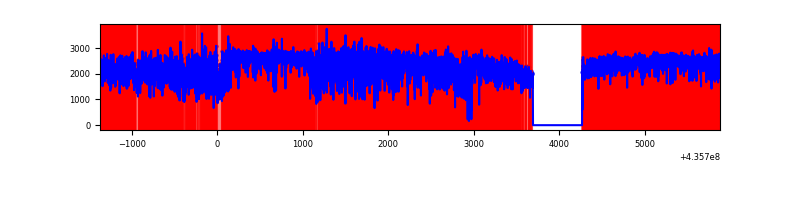 |
Top three noisy pixels from each quadrant. If the there are fewer than three noisy pixels in the level2.evt file, extra rows are filled as -1
| Pixel properties | Quadrant properties | ||||||
|---|---|---|---|---|---|---|---|
| Quadrant | DetID | PixID | Counts | Sigma | Mean | Median | Sigma |
| A | 10 | 83 | 796041 | 5085.85 | 759 | 743 | 156.4 |
| A | 15 | 223 | 160400 | 1020.99 | 759 | 743 | 156.4 |
| A | 15 | 222 | 84241 | 533.96 | 759 | 743 | 156.4 |
| B | 5 | 235 | 1633812 | 11523.27 | 724 | 701 | 141.7 |
| B | 0 | 219 | 175394 | 1232.63 | 724 | 701 | 141.7 |
| B | 0 | 155 | 99327 | 695.9 | 724 | 701 | 141.7 |
| C | 15 | 174 | 5155127 | 63511.84 | 341 | 342 | 81.2 |
| C | 15 | 126 | 4191587 | 51640.12 | 341 | 342 | 81.2 |
| C | 15 | 142 | 3392284 | 41791.94 | 341 | 342 | 81.2 |
| D | 8 | 192 | 5236795 | 38303.09 | 509 | 490 | 136.7 |
| D | 4 | 216 | 2883984 | 21092.5 | 509 | 490 | 136.7 |
| D | 4 | 212 | 1361353 | 9954.59 | 509 | 490 | 136.7 |
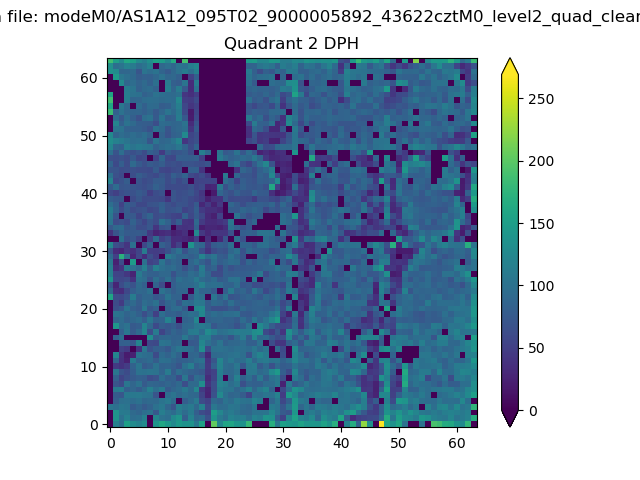
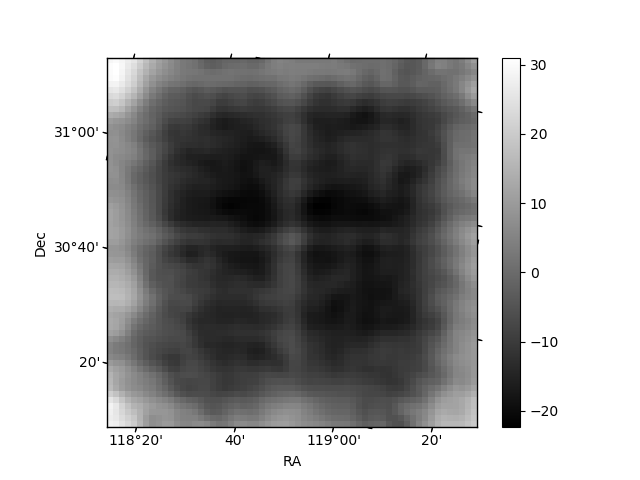
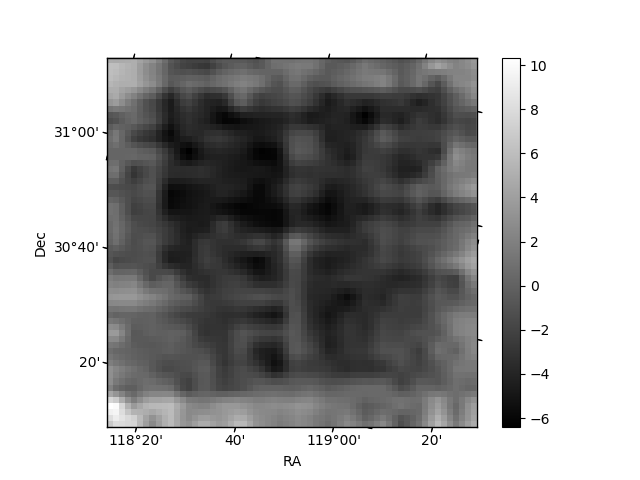
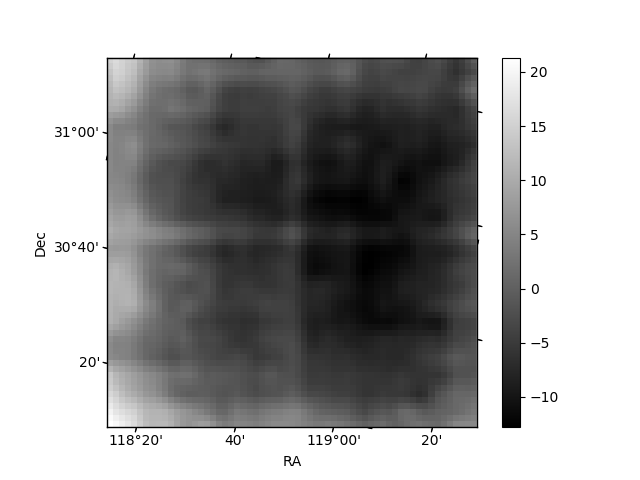
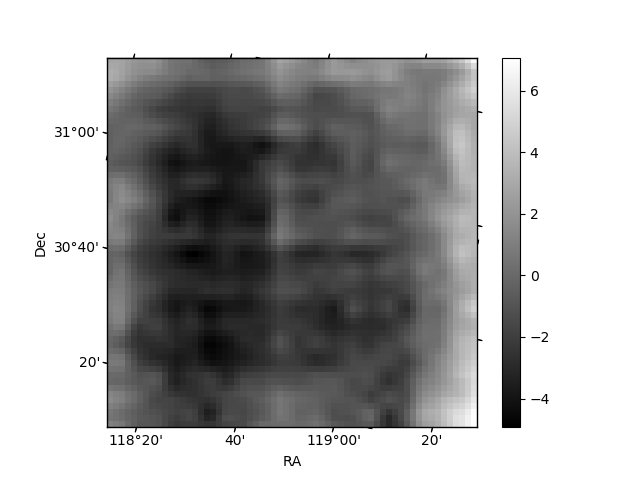
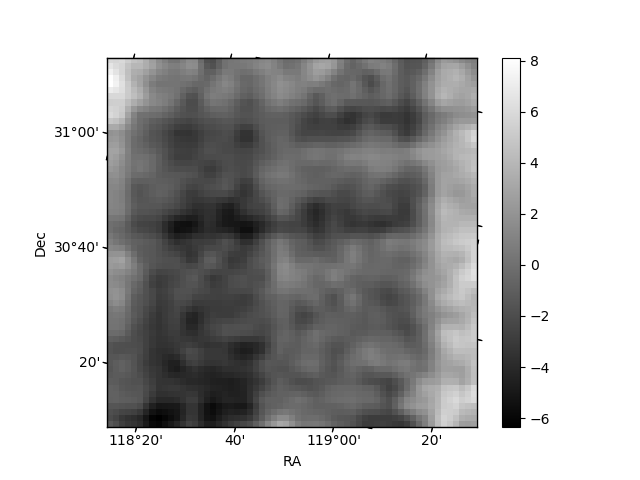
Histogram calculated using DETX and DETY for each event in the final _common_clean file
| Quadrant A | 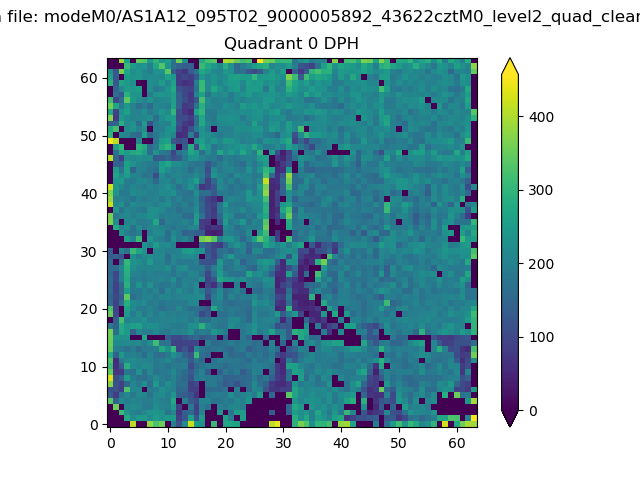 |
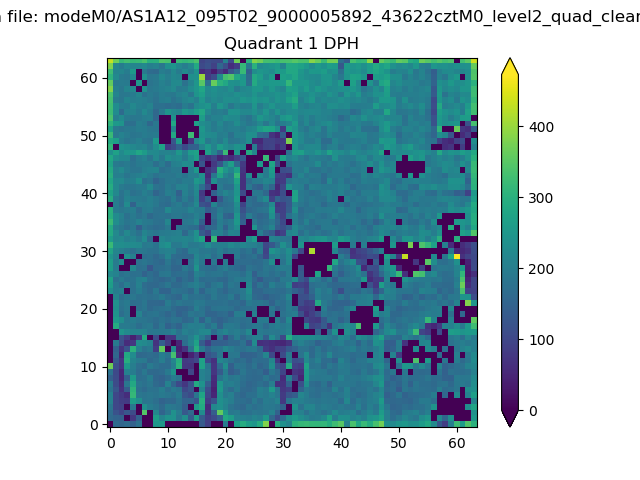 |
Quadrant B |
|---|---|---|---|
| Quadrant D | 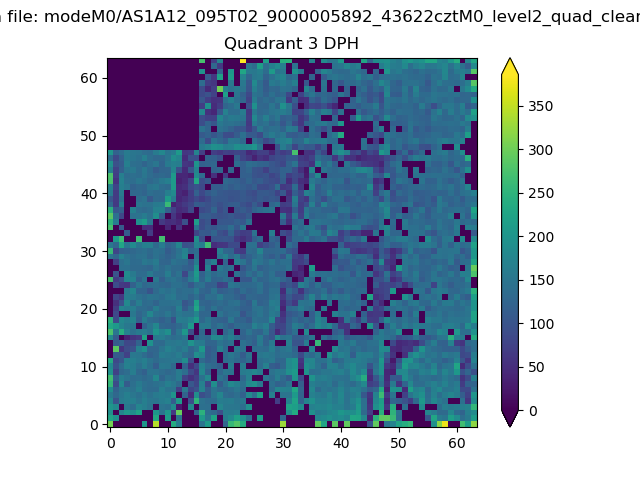 |
 |
Quadrant C |
| Plot type | Count rate plots | Images |
|---|---|---|
| Comparison with Poisson distribution Blue bars denote a histogram of data divided into 1 sec bins. Red curve is a Poisson curve with rate = median count rate of data. |
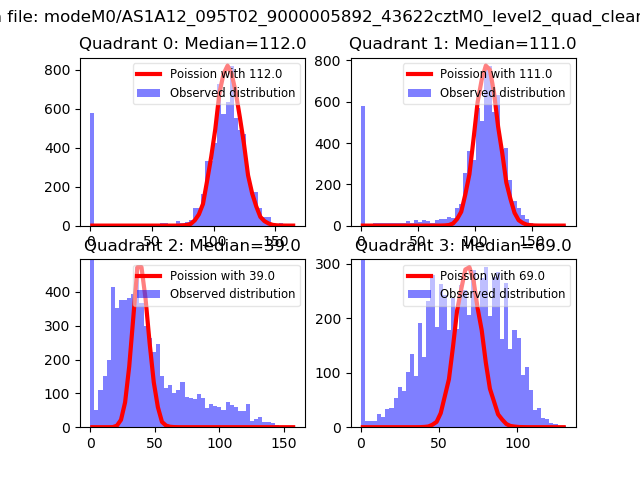 |
 |
| Quadrant-wise count rates Data is divided into 100 sec bins |
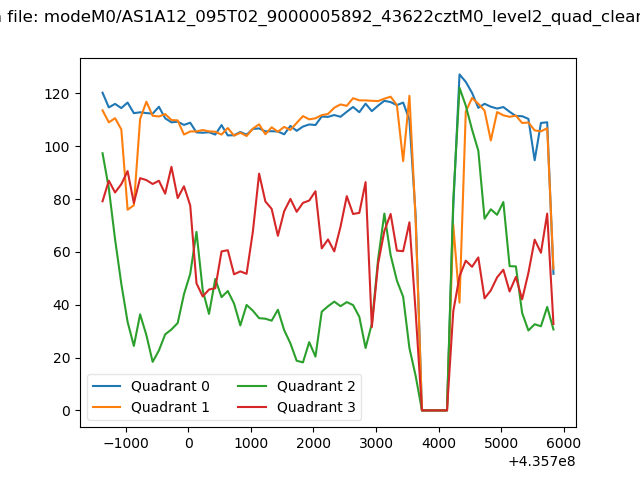 |
|
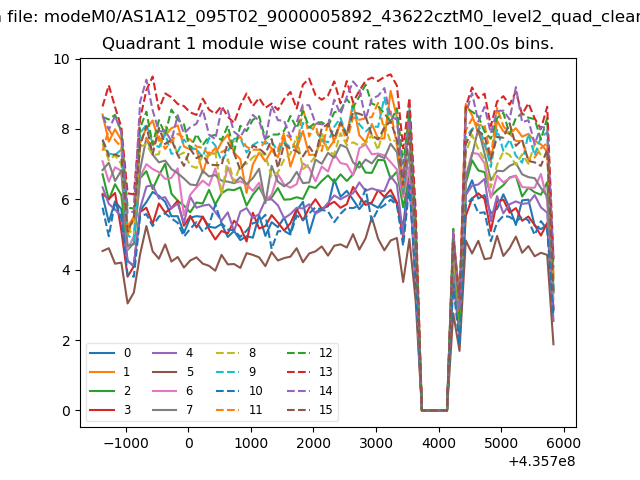
| Module-wise count rates for Quadrant A Data is divided into 100 sec bins |
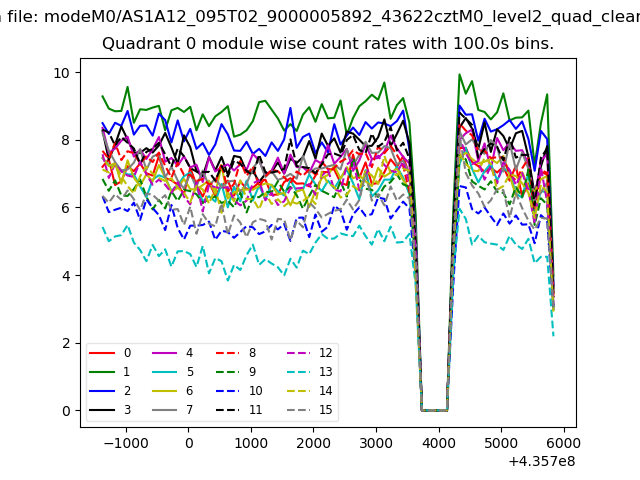 |
 |
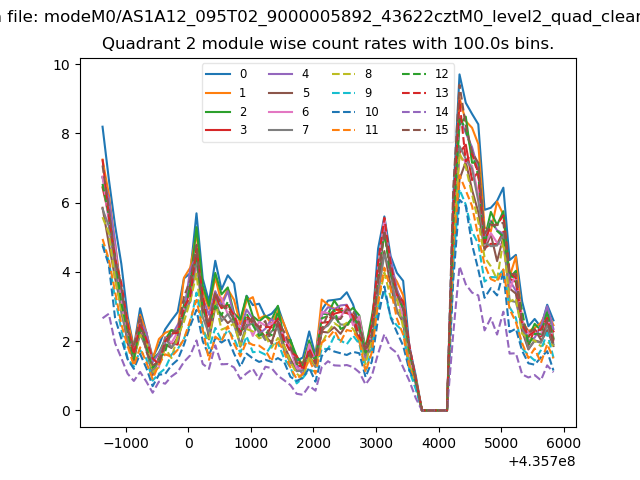
| Module-wise count rates for Quadrant B Data is divided into 100 sec bins |
 |
 |
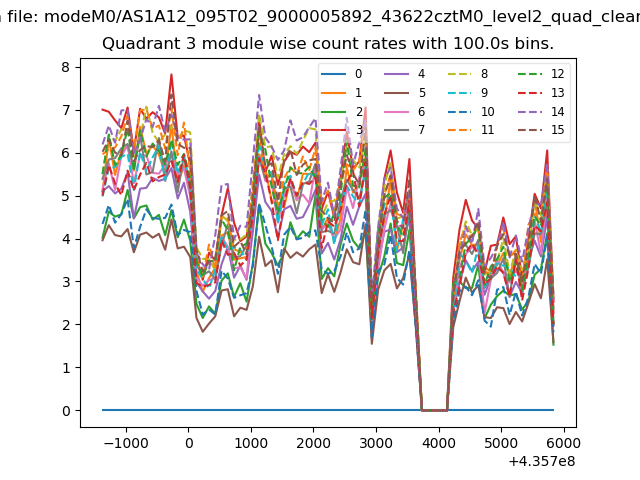
| Module-wise count rates for Quadrant C Data is divided into 100 sec bins |
 |
 |
| Module-wise count rates for Quadrant D Data is divided into 100 sec bins |
 |
 |
| Parameter | Plot |
|---|---|
| CZT HV Monitor |  |
| D_VDD | 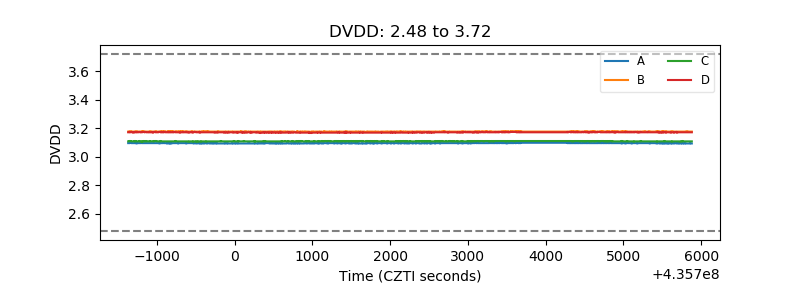 |
| Temperature 1 | 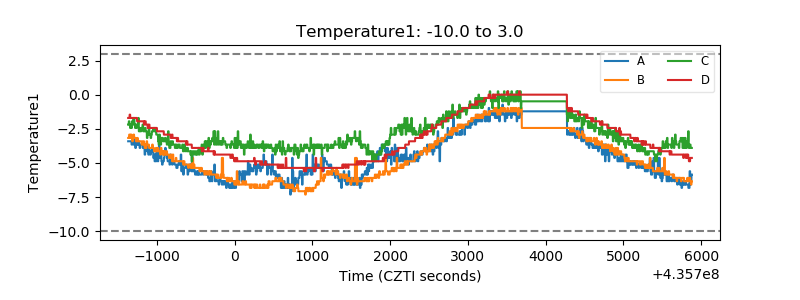 |
| Veto HV Monitor | 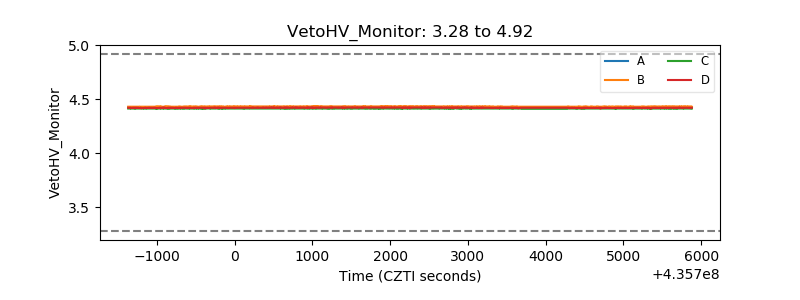 |
| Veto LLD | 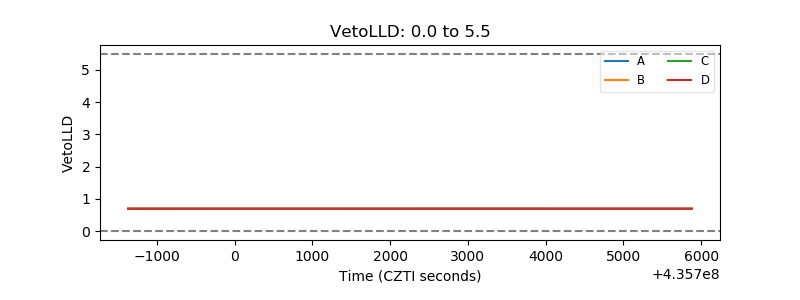 |
| Alpha Counter | 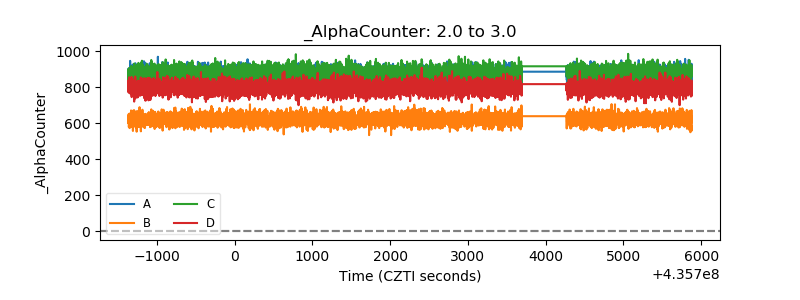 |
| _CPM_Rate | 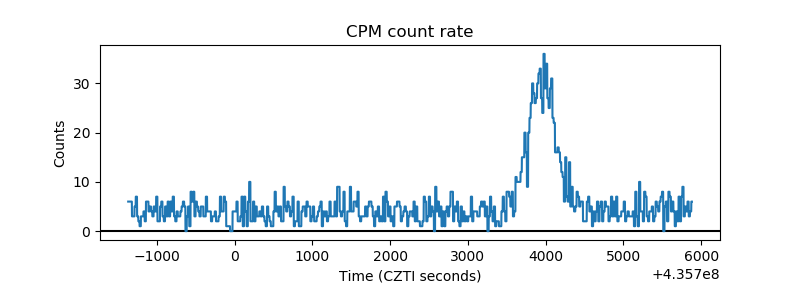 |
| CZT Counter | 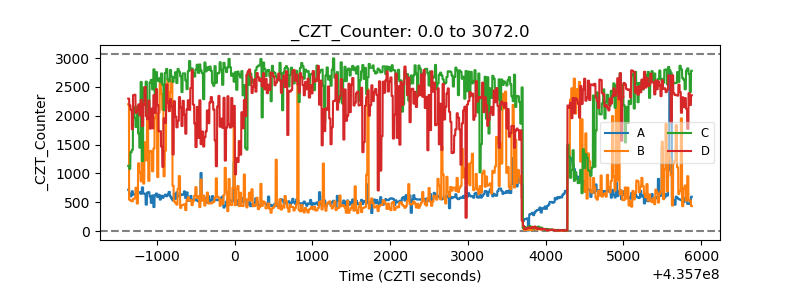 |
| +2.5 Volts monitor | 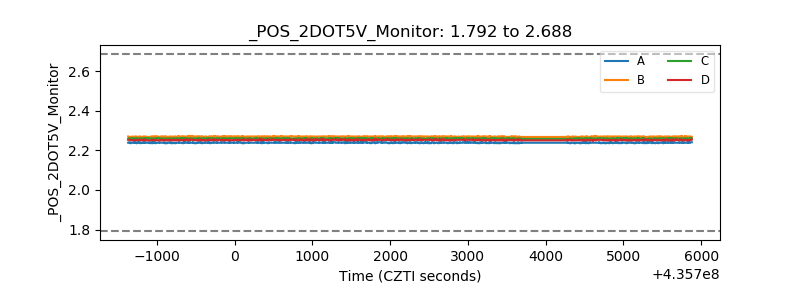 |
| +5 Volts monitor | 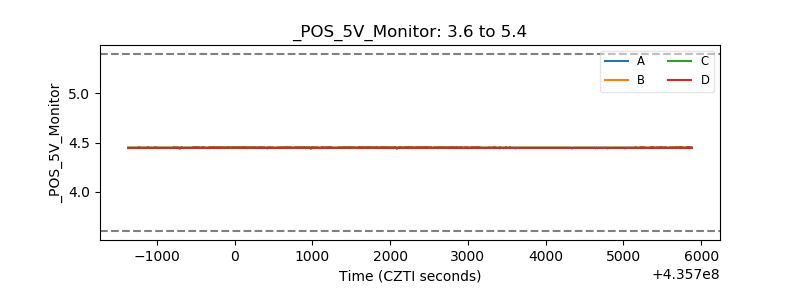 |
| _ROLL_ROT | 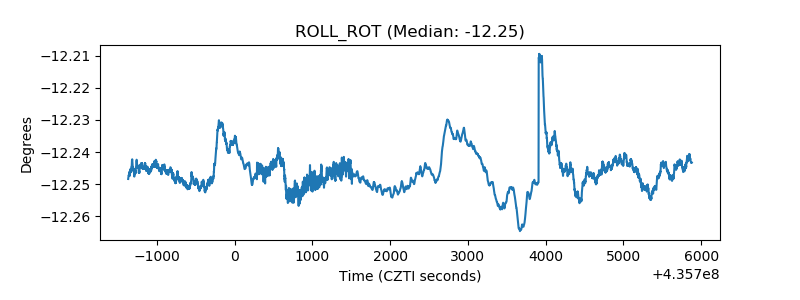 |
| _Roll_DEC | 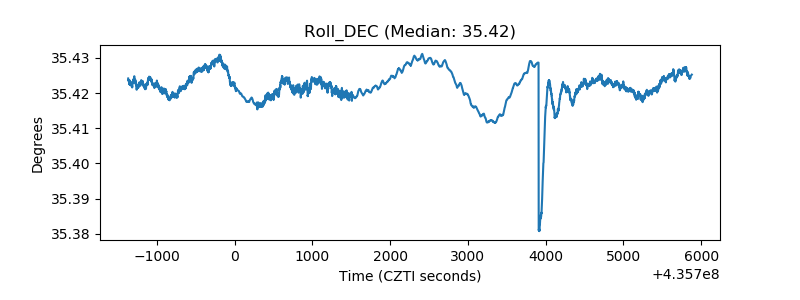 |
| _Roll_RA | 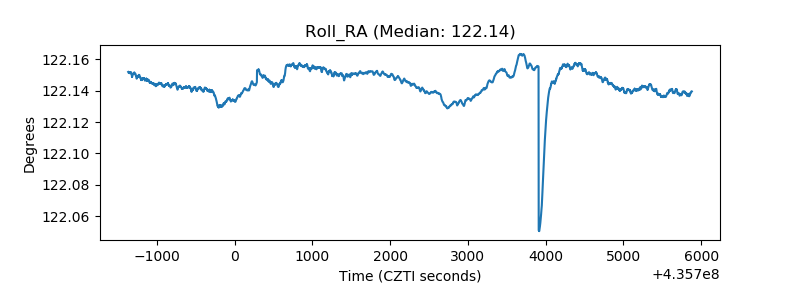 |
| Veto Counter | 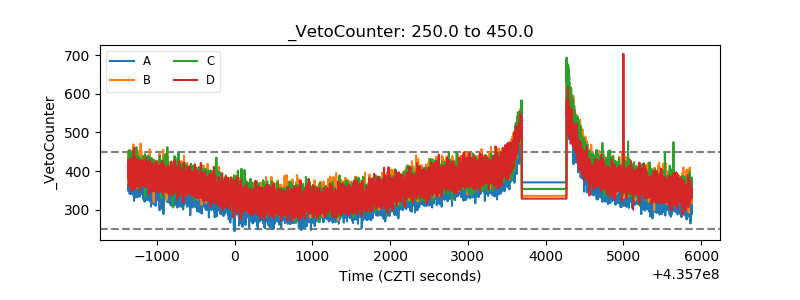 |