| Param | Original file | Final file |
|---|---|---|
| Filename | modeM0/AS1A12_095T02_9000005892_43628cztM0_level2.fits | modeM0/AS1A12_095T02_9000005892_43628cztM0_level2_quad_clean.evt |
| Size (bytes) | 1,465,303,680 | 144,374,400 |
| Size | 1.4 GB | 137.7 MB |
| Events in quadrant A | 7,520,360 | 1,115,645 |
| Events in quadrant B | 6,603,372 | 1,131,213 |
| Events in quadrant C | 24,341,605 | 563,214 |
| Events in quadrant D | 14,974,752 | 835,936 |
| Mode M9 | |||
|---|---|---|---|
| Quadrant | BADHDUFLAG | Total packets | Discarded packets |
| A | 0 | 14 | 0 |
| B | 0 | 14 | 0 |
| C | 0 | 14 | 0 |
| D | 0 | 14 | 0 |
| Mode M0 | |||
|---|---|---|---|
| Quadrant | BADHDUFLAG | Total packets | Discarded packets |
| A | 0 | 29683 | 5 |
| B | 0 | 26625 | 5 |
| C | 0 | 79372 | 4 |
| D | 0 | 51813 | 22 |
| Mode SS | |||
|---|---|---|---|
| Quadrant | BADHDUFLAG | Total packets | Discarded packets |
| A | 0 | 212 | 0 |
| B | 0 | 212 | 0 |
| C | 0 | 212 | 0 |
| D | 0 | 212 | 0 |
| Quadrant | Total seconds | Saturated seconds | Saturation percentage |
|---|---|---|---|
| A | 10379 | 221 | 2.129300% |
| B | 10380 | 438 | 4.219653% |
| C | 10381 | 8670 | 83.517966% |
| D | 10379 | 3463 | 33.365449% |
Noise dominated data is calculated using 1-second bins in cleaned event files. If a bin has >2000 counts, and if more than 50% of those come from <1% of pixels, then it is considered to be noise-dominated and hence unusable.
| Quadrant | # 1 sec bins | Bins with >0 counts | Bins with >2000 counts | High rate bins dominated by noise | Noise dominated (total time) | Noise dominated (detector-on time) | Marked lightcurve |
|---|---|---|---|---|---|---|---|
| A | 11831 | 10381 | 65 | 65 | 0.55% | 0.63% | 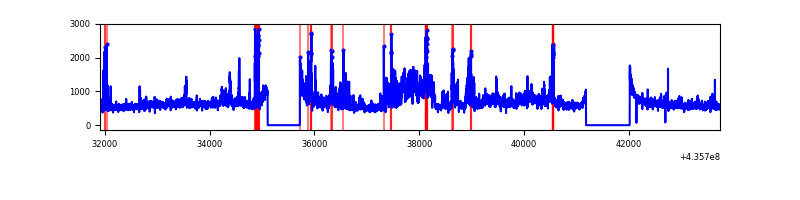 |
| B | 11832 | 10382 | 246 | 246 | 2.08% | 2.37% | 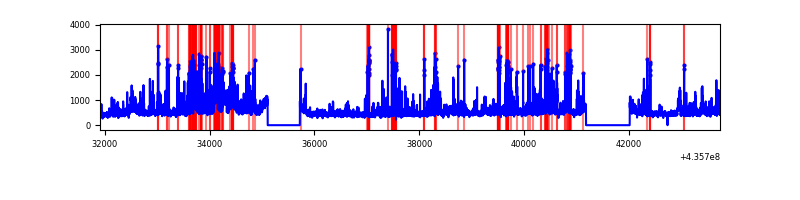 |
| C | 11831 | 10381 | 8542 | 8542 | 72.20% | 82.28% | 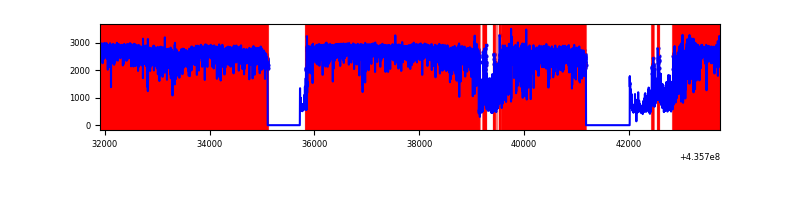 |
| D | 11832 | 10381 | 2969 | 2969 | 25.09% | 28.60% | 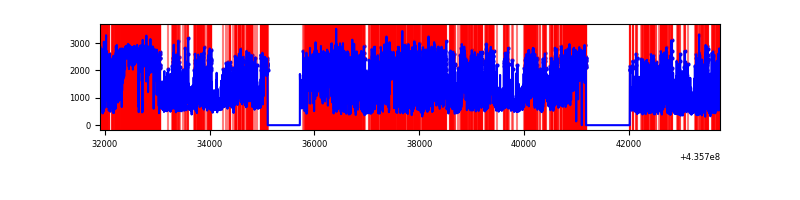 |
Top three noisy pixels from each quadrant. If the there are fewer than three noisy pixels in the level2.evt file, extra rows are filled as -1
| Pixel properties | Quadrant properties | ||||||
|---|---|---|---|---|---|---|---|
| Quadrant | DetID | PixID | Counts | Sigma | Mean | Median | Sigma |
| A | 10 | 83 | 1247882 | 5123.39 | 1171 | 1145 | 243.3 |
| A | 14 | 63 | 803102 | 3295.59 | 1171 | 1145 | 243.3 |
| A | 15 | 222 | 385990 | 1581.5 | 1171 | 1145 | 243.3 |
| B | 5 | 235 | 997101 | 4415.1 | 1156 | 1121 | 225.6 |
| B | 3 | 42 | 221511 | 976.97 | 1156 | 1121 | 225.6 |
| B | 10 | 245 | 120442 | 528.94 | 1156 | 1121 | 225.6 |
| C | 15 | 142 | 16735981 | 115016.82 | 614 | 618 | 145.5 |
| C | 15 | 174 | 2437853 | 16750.34 | 614 | 618 | 145.5 |
| C | 15 | 126 | 1074456 | 7380.15 | 614 | 618 | 145.5 |
| D | 4 | 211 | 2034703 | 7810.64 | 992 | 957 | 260.4 |
| D | 4 | 212 | 1566007 | 6010.6 | 992 | 957 | 260.4 |
| D | 0 | 240 | 1402967 | 5384.45 | 992 | 957 | 260.4 |
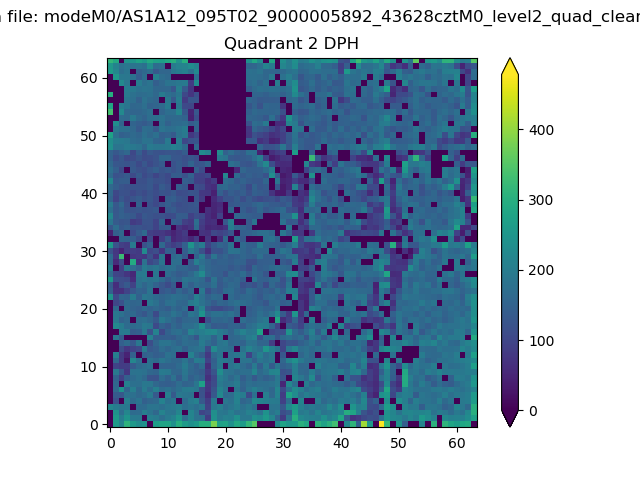
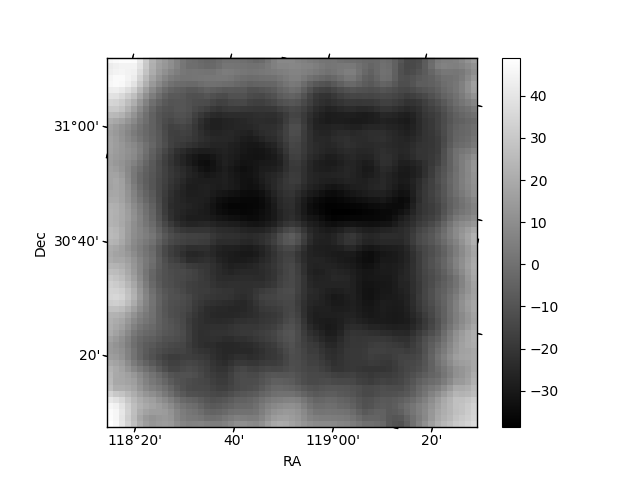
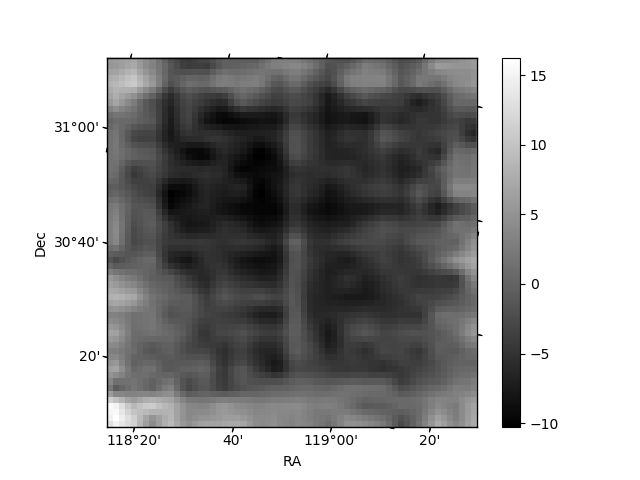
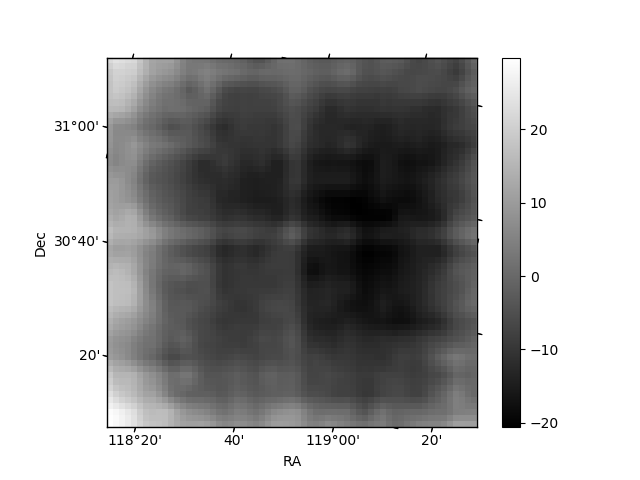
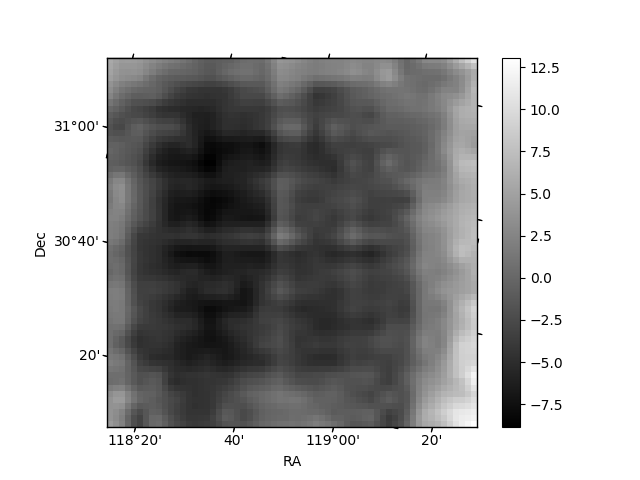
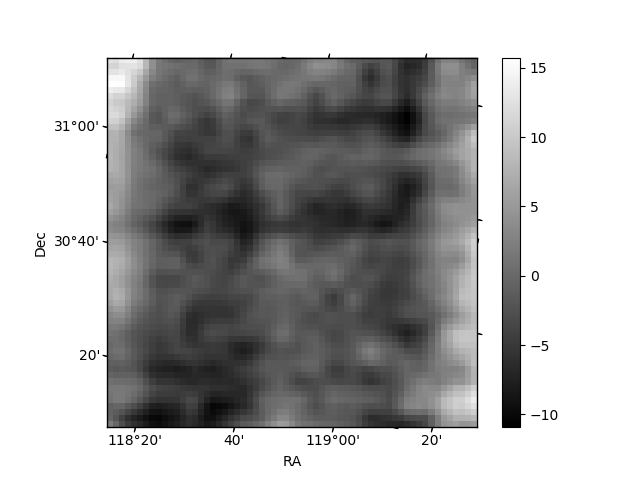
Histogram calculated using DETX and DETY for each event in the final _common_clean file
| Quadrant A | 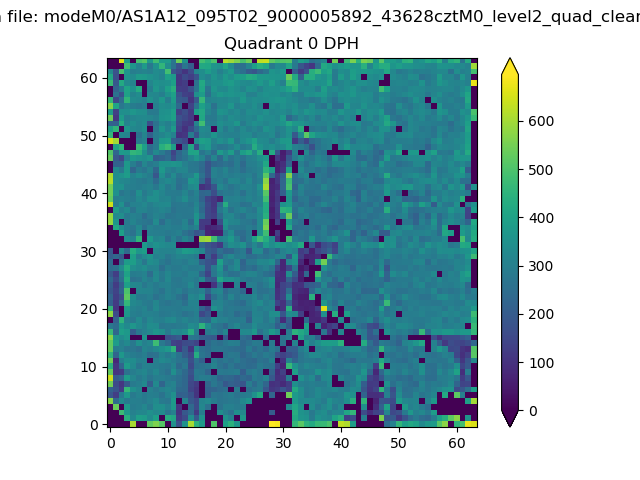 |
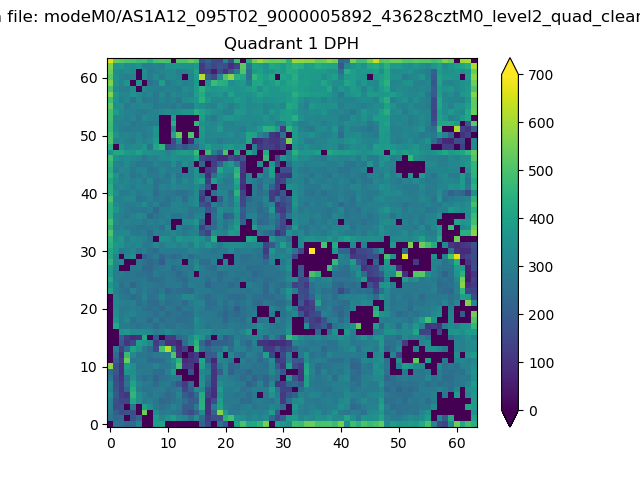 |
Quadrant B |
|---|---|---|---|
| Quadrant D | 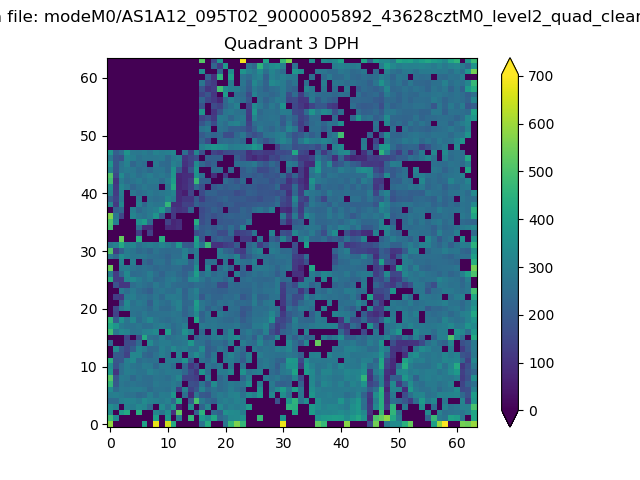 |
 |
Quadrant C |
| Plot type | Count rate plots | Images |
|---|---|---|
| Comparison with Poisson distribution Blue bars denote a histogram of data divided into 1 sec bins. Red curve is a Poisson curve with rate = median count rate of data. |
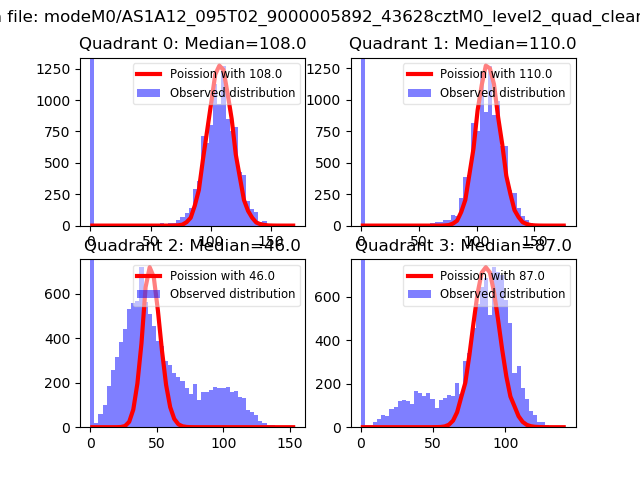 |
 |
| Quadrant-wise count rates Data is divided into 100 sec bins |
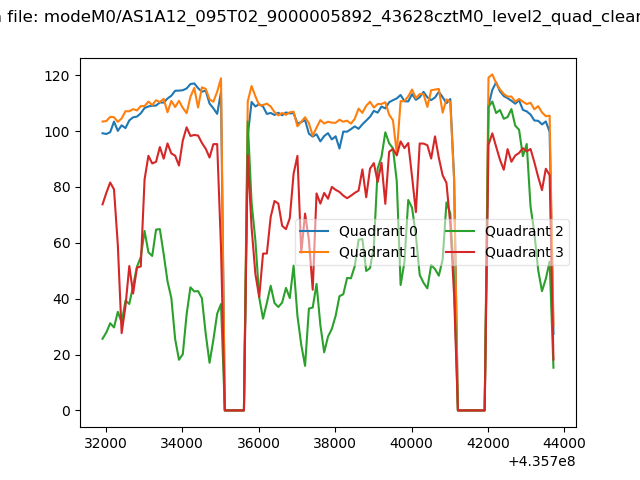 |
|
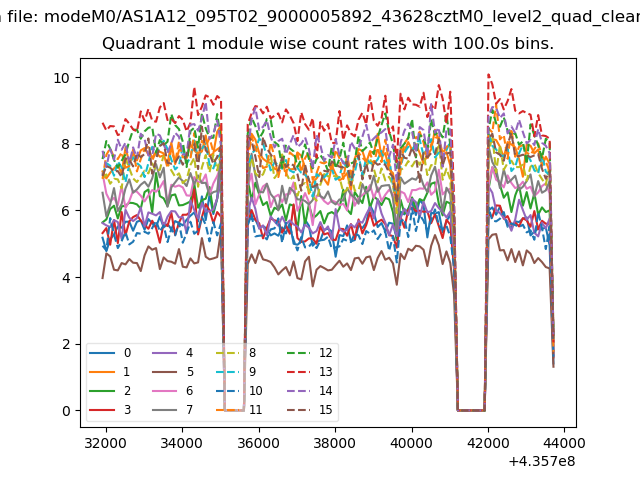
| Module-wise count rates for Quadrant A Data is divided into 100 sec bins |
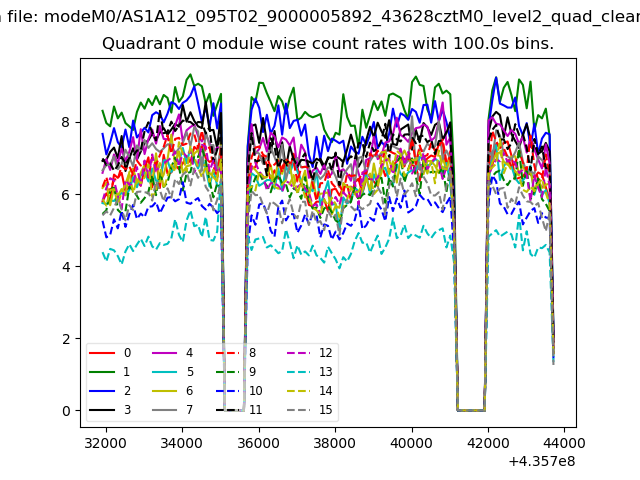 |
 |
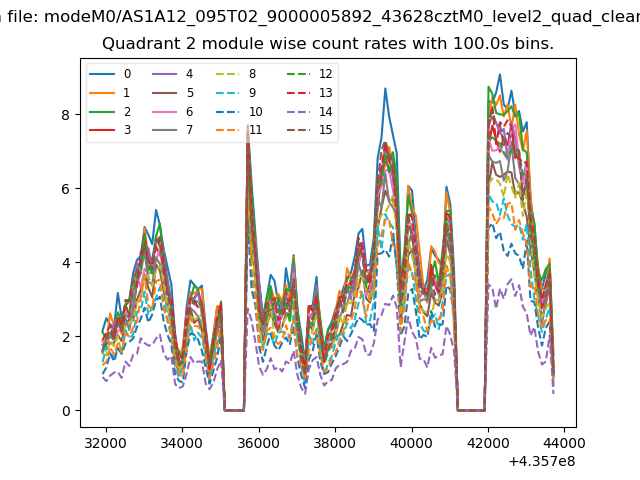
| Module-wise count rates for Quadrant B Data is divided into 100 sec bins |
 |
 |
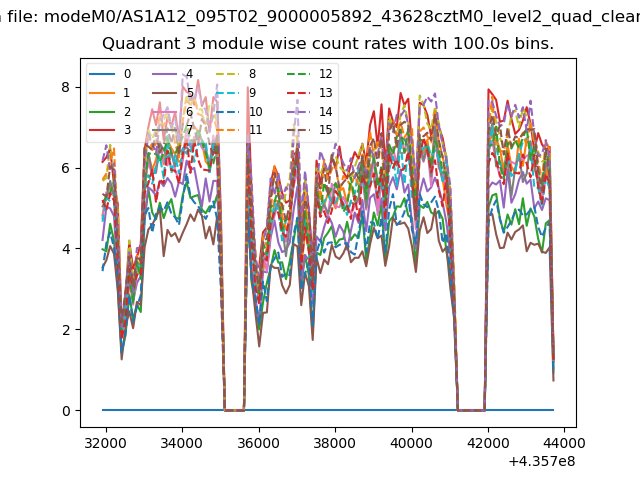
| Module-wise count rates for Quadrant C Data is divided into 100 sec bins |
 |
 |
| Module-wise count rates for Quadrant D Data is divided into 100 sec bins |
 |
 |
| Parameter | Plot |
|---|---|
| CZT HV Monitor | 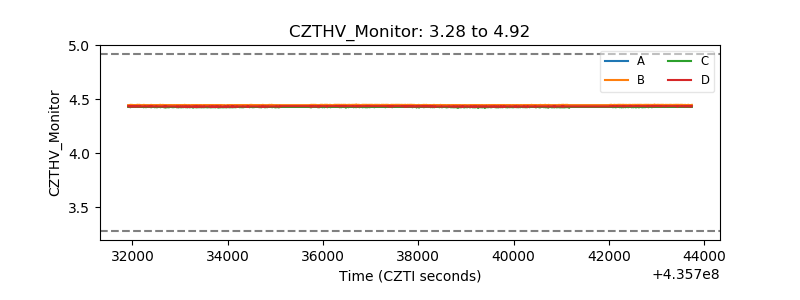 |
| D_VDD | 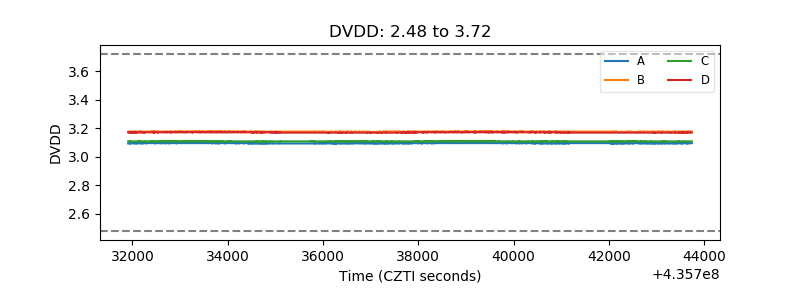 |
| Temperature 1 | 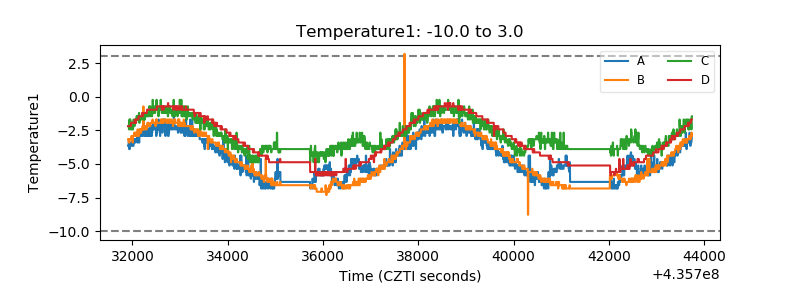 |
| Veto HV Monitor | 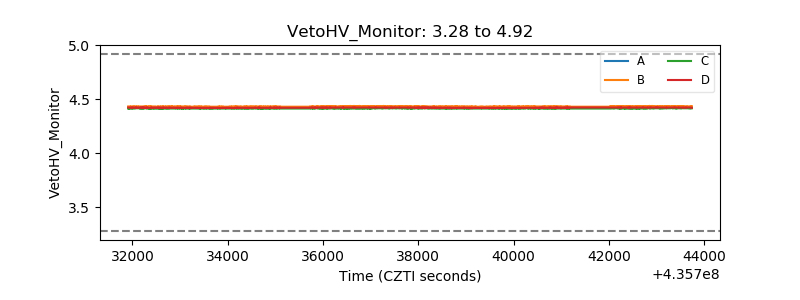 |
| Veto LLD | 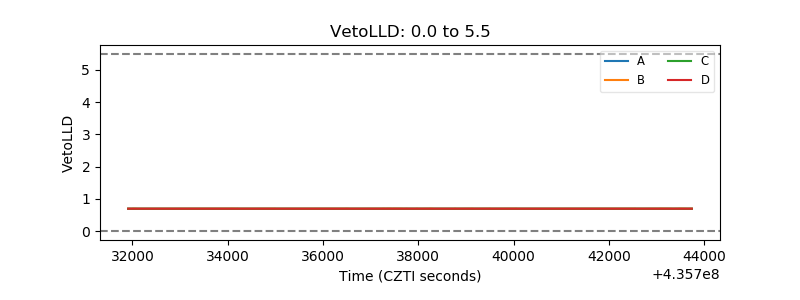 |
| Alpha Counter | 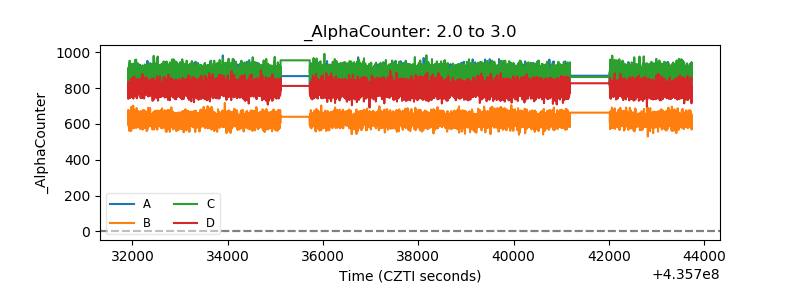 |
| _CPM_Rate | 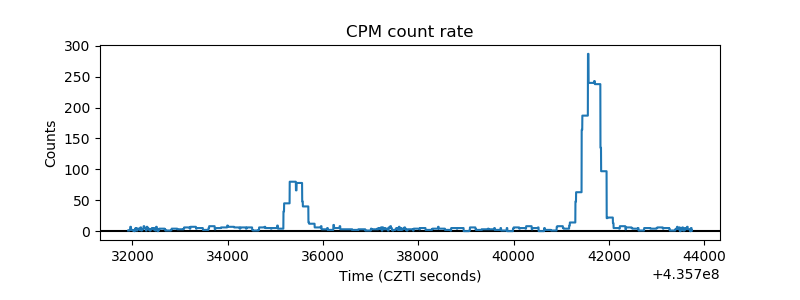 |
| CZT Counter | 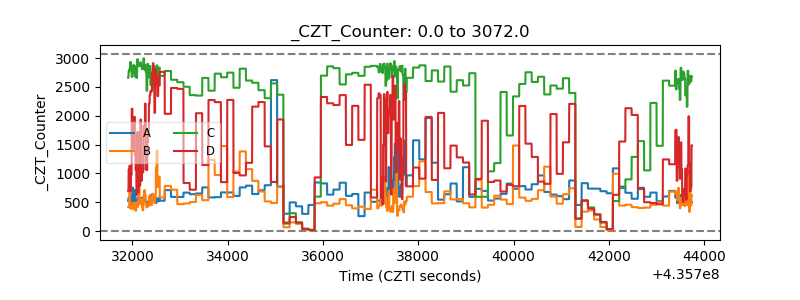 |
| +2.5 Volts monitor | 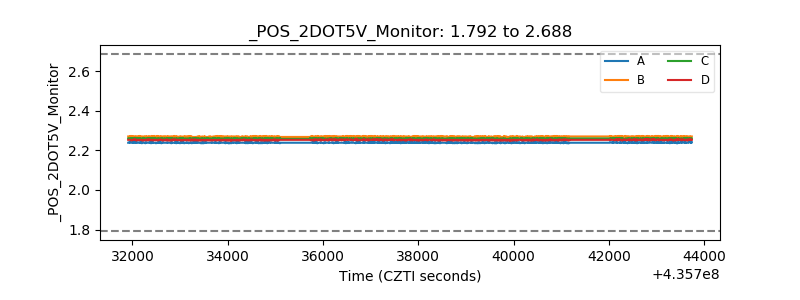 |
| +5 Volts monitor | 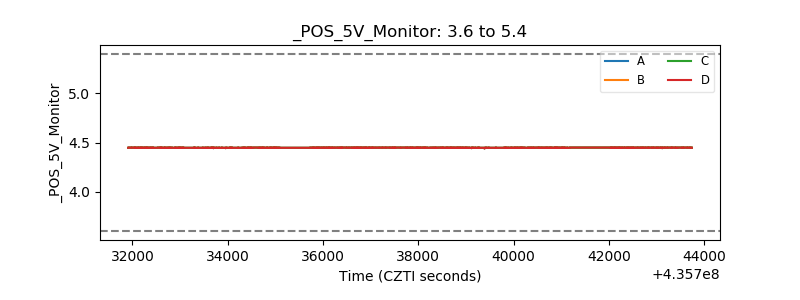 |
| _ROLL_ROT | 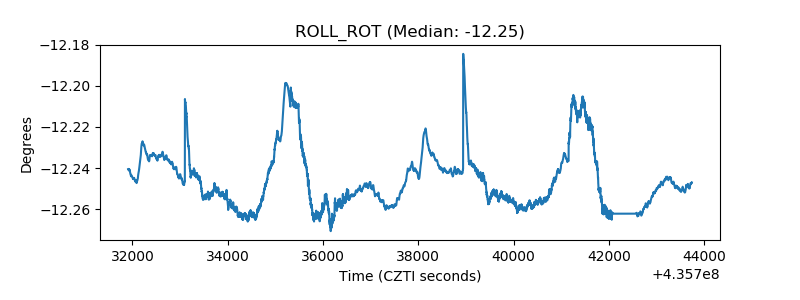 |
| _Roll_DEC | 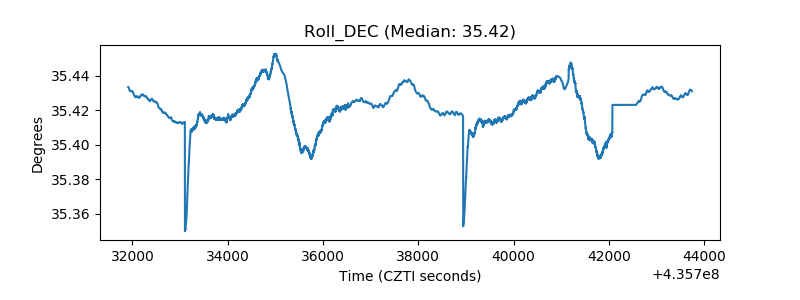 |
| _Roll_RA | 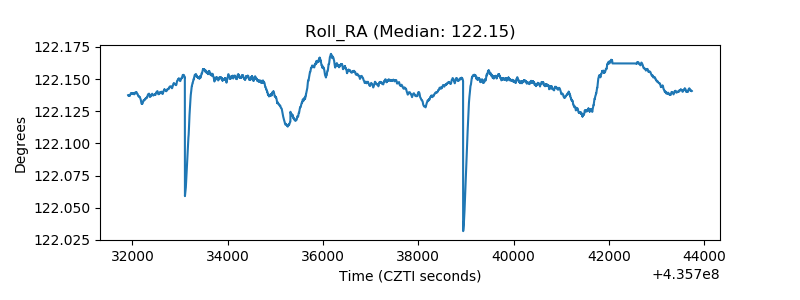 |
| Veto Counter | 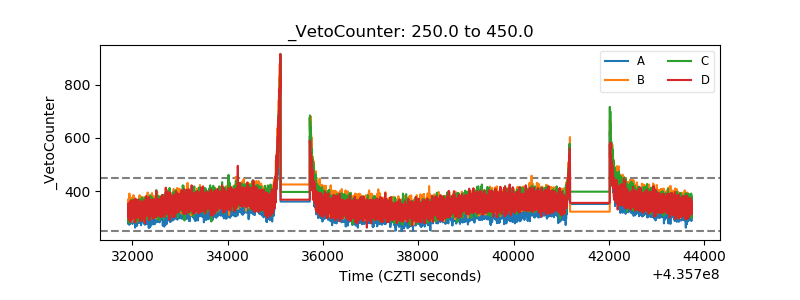 |