| Param | Original file | Final file |
|---|---|---|
| Filename | modeM0/AS1A12_095T02_9000005892_43629cztM0_level2.fits | modeM0/AS1A12_095T02_9000005892_43629cztM0_level2_quad_clean.evt |
| Size (bytes) | 875,678,400 | 91,932,480 |
| Size | 835.1 MB | 87.7 MB |
| Events in quadrant A | 5,465,147 | 685,293 |
| Events in quadrant B | 3,781,663 | 697,737 |
| Events in quadrant C | 13,585,141 | 425,790 |
| Events in quadrant D | 9,100,340 | 535,336 |
| Mode M9 | |||
|---|---|---|---|
| Quadrant | BADHDUFLAG | Total packets | Discarded packets |
| A | 0 | 9 | 0 |
| B | 0 | 9 | 0 |
| C | 0 | 9 | 0 |
| D | 0 | 9 | 0 |
| Mode M0 | |||
|---|---|---|---|
| Quadrant | BADHDUFLAG | Total packets | Discarded packets |
| A | 0 | 20576 | 2 |
| B | 0 | 15259 | 1 |
| C | 0 | 44663 | 1 |
| D | 0 | 31408 | 1 |
| Mode SS | |||
|---|---|---|---|
| Quadrant | BADHDUFLAG | Total packets | Discarded packets |
| A | 0 | 128 | 0 |
| B | 0 | 128 | 0 |
| C | 0 | 128 | 0 |
| D | 0 | 128 | 0 |
| Quadrant | Total seconds | Saturated seconds | Saturation percentage |
|---|---|---|---|
| A | 6245 | 257 | 4.115292% |
| B | 6246 | 160 | 2.561639% |
| C | 6246 | 4311 | 69.020173% |
| D | 6246 | 1964 | 31.444124% |
Noise dominated data is calculated using 1-second bins in cleaned event files. If a bin has >2000 counts, and if more than 50% of those come from <1% of pixels, then it is considered to be noise-dominated and hence unusable.
| Quadrant | # 1 sec bins | Bins with >0 counts | Bins with >2000 counts | High rate bins dominated by noise | Noise dominated (total time) | Noise dominated (detector-on time) | Marked lightcurve |
|---|---|---|---|---|---|---|---|
| A | 7195 | 6245 | 69 | 69 | 0.96% | 1.10% | 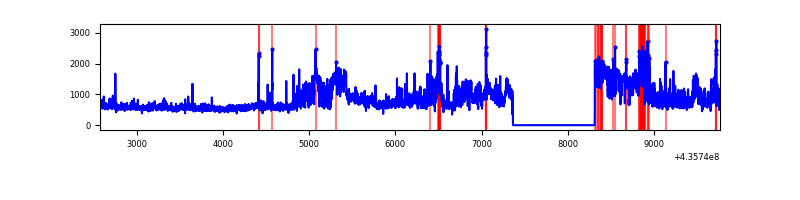 |
| B | 7196 | 6246 | 75 | 75 | 1.04% | 1.20% | 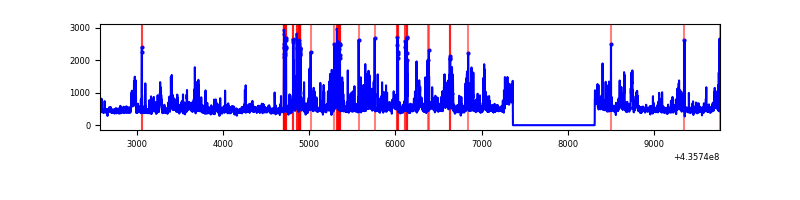 |
| C | 7195 | 6245 | 4261 | 4261 | 59.22% | 68.23% | 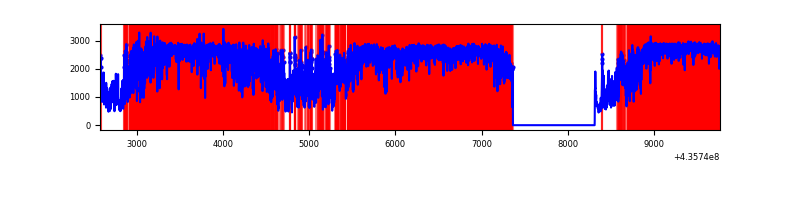 |
| D | 7195 | 6245 | 1592 | 1592 | 22.13% | 25.49% | 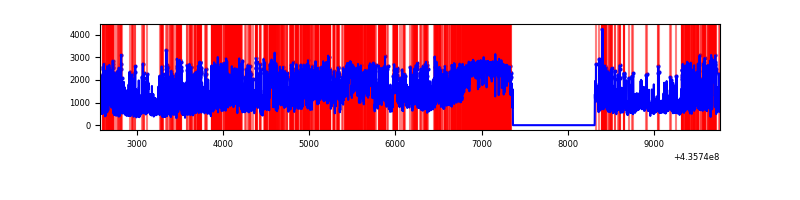 |
Top three noisy pixels from each quadrant. If the there are fewer than three noisy pixels in the level2.evt file, extra rows are filled as -1
| Pixel properties | Quadrant properties | ||||||
|---|---|---|---|---|---|---|---|
| Quadrant | DetID | PixID | Counts | Sigma | Mean | Median | Sigma |
| A | 14 | 63 | 1289314 | 8855.7 | 703 | 689 | 145.5 |
| A | 10 | 83 | 735155 | 5047.4 | 703 | 689 | 145.5 |
| A | 15 | 222 | 388440 | 2664.71 | 703 | 689 | 145.5 |
| B | 5 | 235 | 329738 | 2405.61 | 699 | 679 | 136.8 |
| B | 3 | 42 | 128047 | 931.13 | 699 | 679 | 136.8 |
| B | 4 | 206 | 86113 | 624.57 | 699 | 679 | 136.8 |
| C | 15 | 142 | 6468578 | 60632.29 | 447 | 448 | 106.7 |
| C | 15 | 174 | 2876123 | 26956.59 | 447 | 448 | 106.7 |
| C | 15 | 157 | 816417 | 7648.9 | 447 | 448 | 106.7 |
| D | 4 | 212 | 1173657 | 7173.57 | 612 | 593 | 163.5 |
| D | 4 | 216 | 771740 | 4715.75 | 612 | 593 | 163.5 |
| D | 13 | 249 | 658144 | 4021.09 | 612 | 593 | 163.5 |
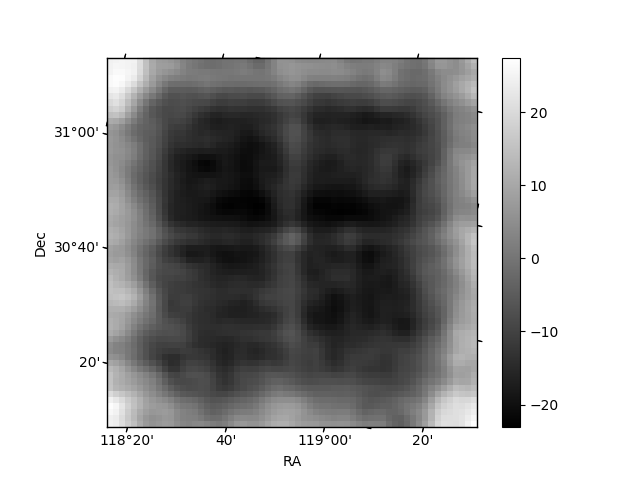
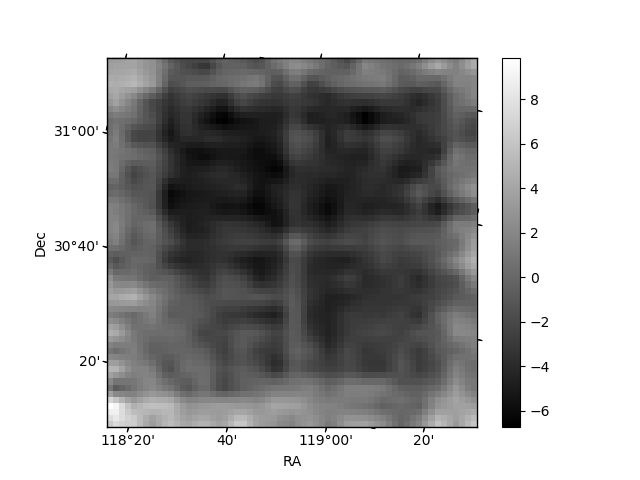
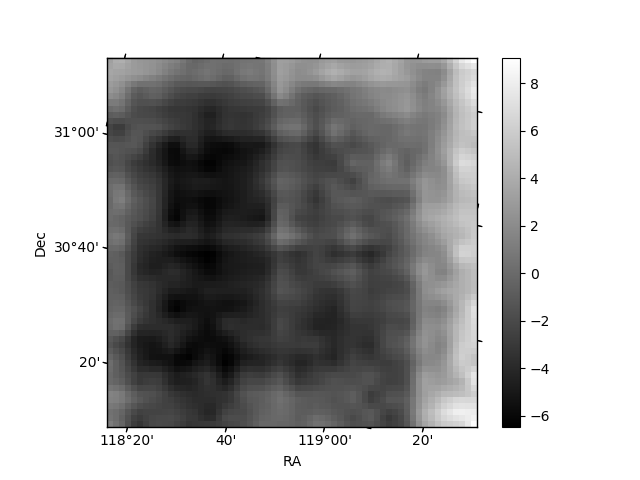
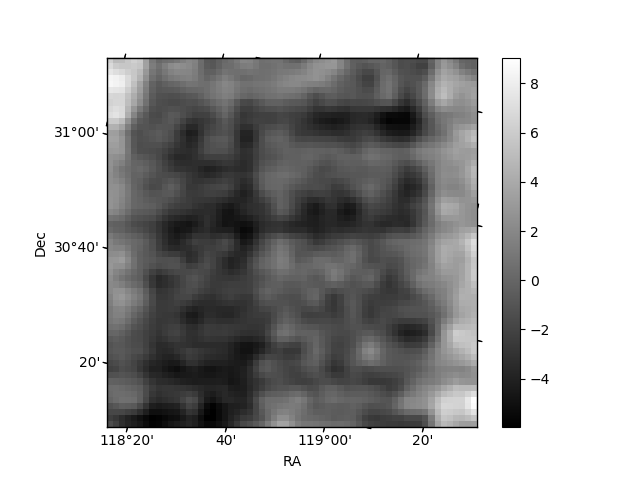
Histogram calculated using DETX and DETY for each event in the final _common_clean file
| Quadrant A | 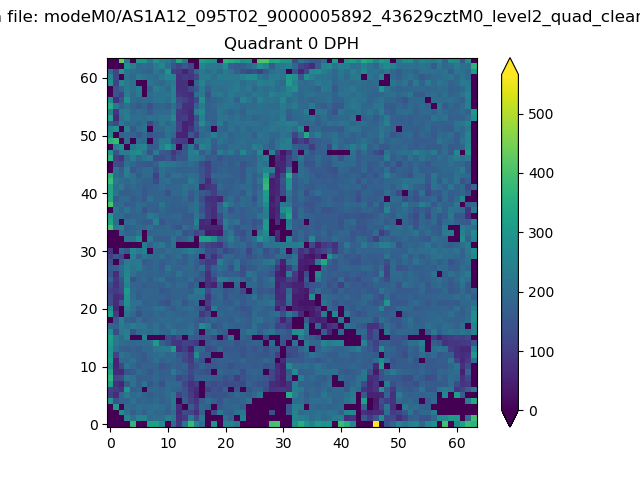 |
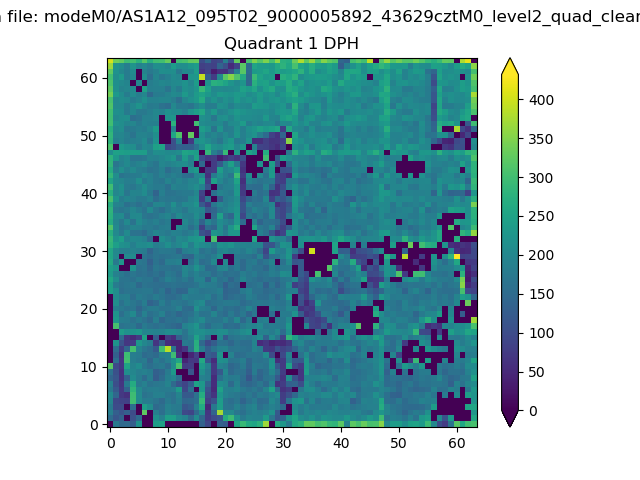 |
Quadrant B |
|---|---|---|---|
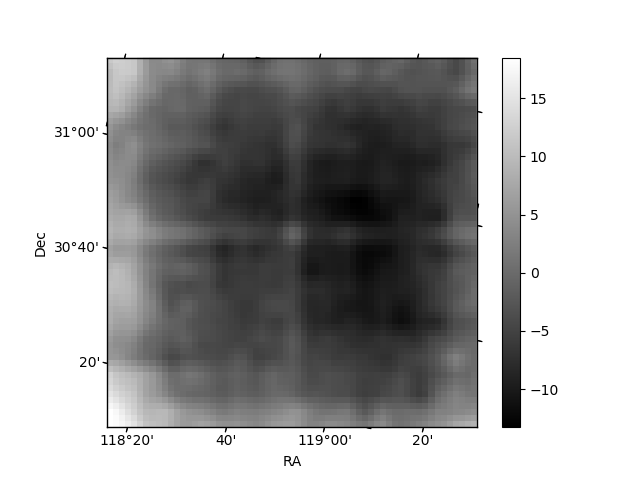
| Quadrant D | 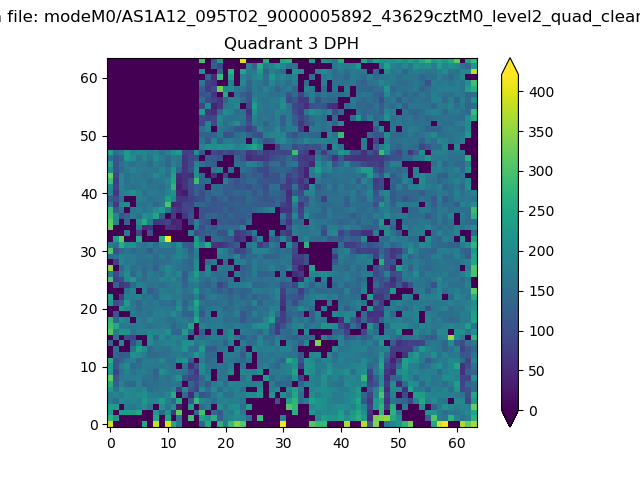 |
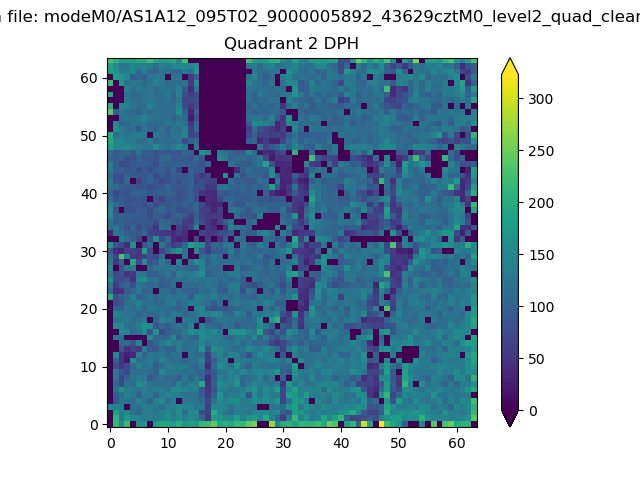 |
Quadrant C |
| Plot type | Count rate plots | Images |
|---|---|---|
| Comparison with Poisson distribution Blue bars denote a histogram of data divided into 1 sec bins. Red curve is a Poisson curve with rate = median count rate of data. |
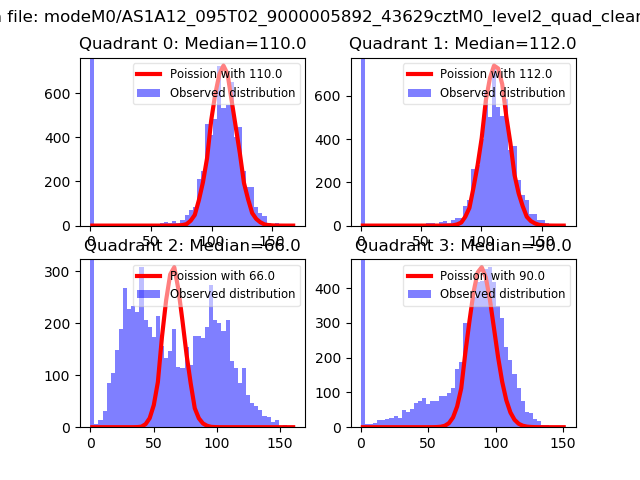 |
 |
| Quadrant-wise count rates Data is divided into 100 sec bins |
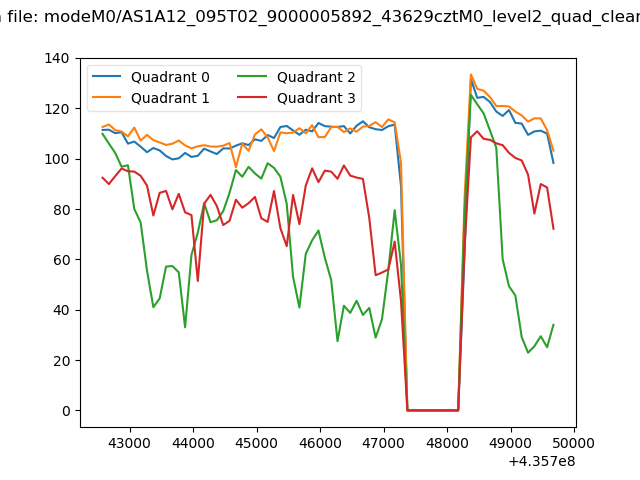 |
|
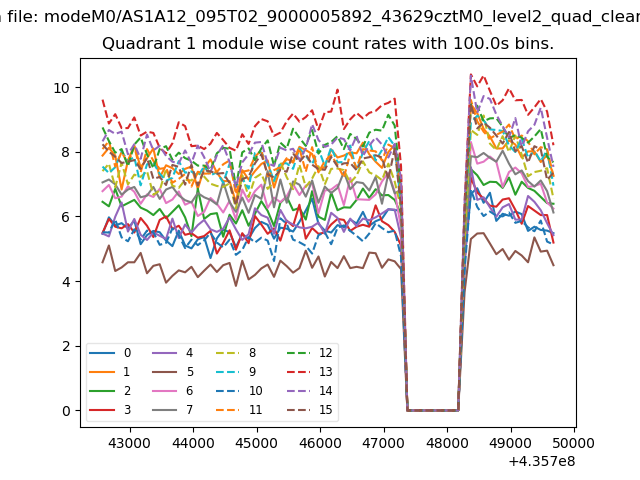
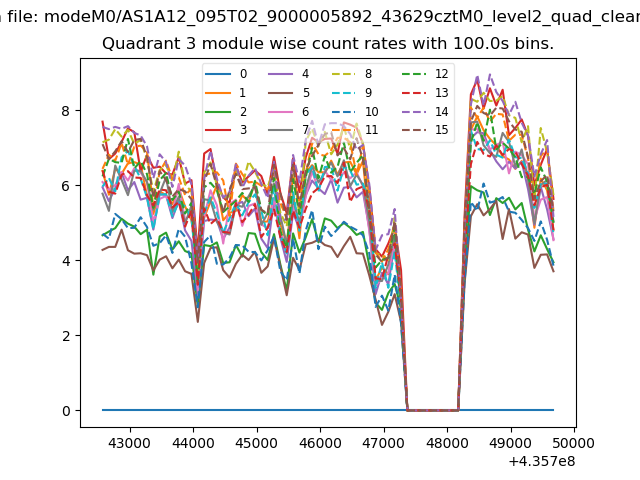
| Module-wise count rates for Quadrant A Data is divided into 100 sec bins |
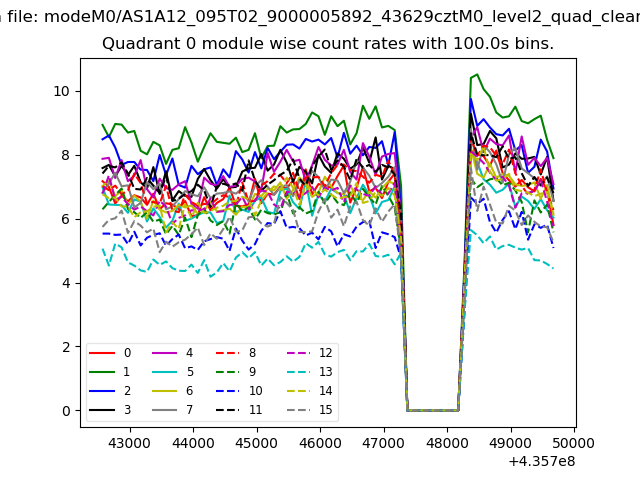 |
 |
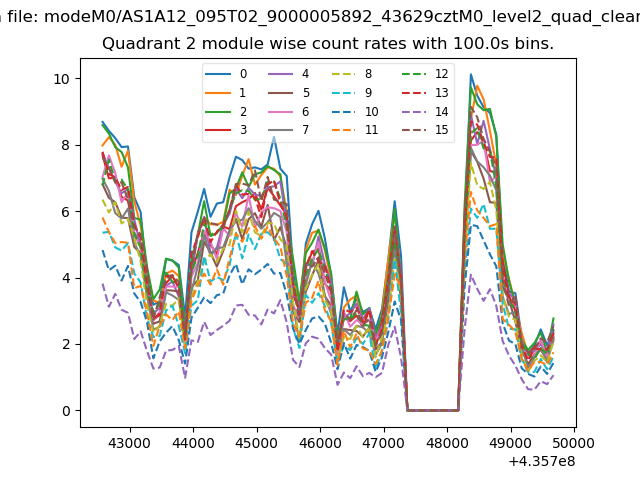
| Module-wise count rates for Quadrant B Data is divided into 100 sec bins |
 |
 |
| Module-wise count rates for Quadrant C Data is divided into 100 sec bins |
 |
 |
| Module-wise count rates for Quadrant D Data is divided into 100 sec bins |
 |
 |
| Parameter | Plot |
|---|---|
| CZT HV Monitor |  |
| D_VDD | 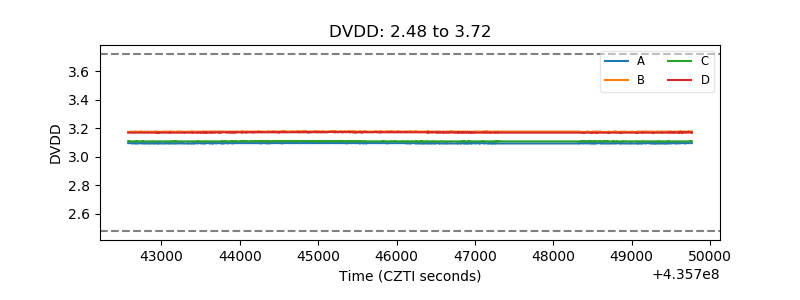 |
| Temperature 1 | 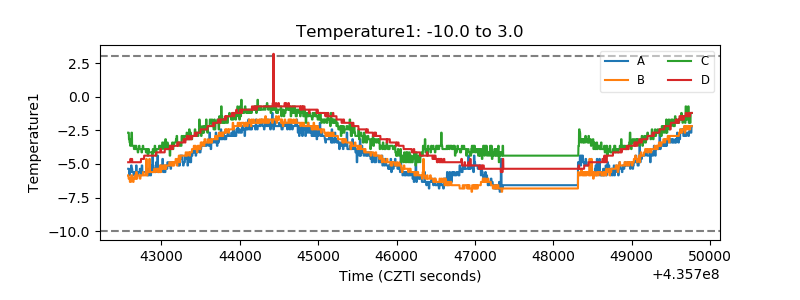 |
| Veto HV Monitor | 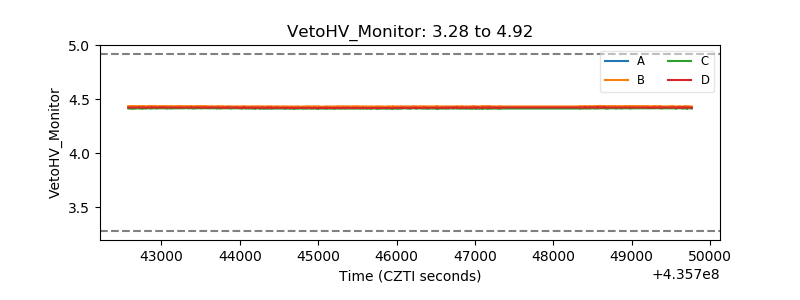 |
| Veto LLD | 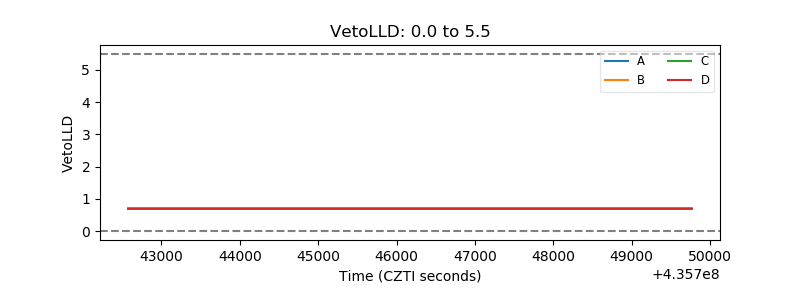 |
| Alpha Counter | 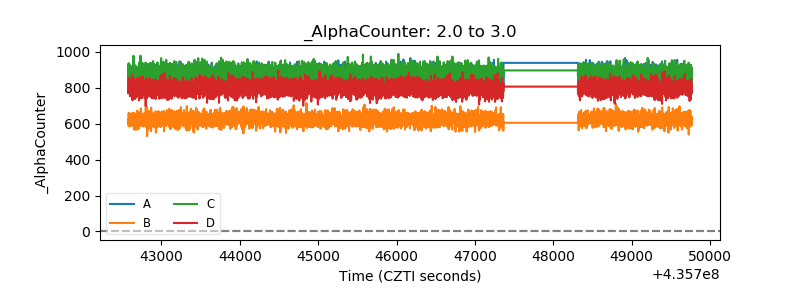 |
| _CPM_Rate | 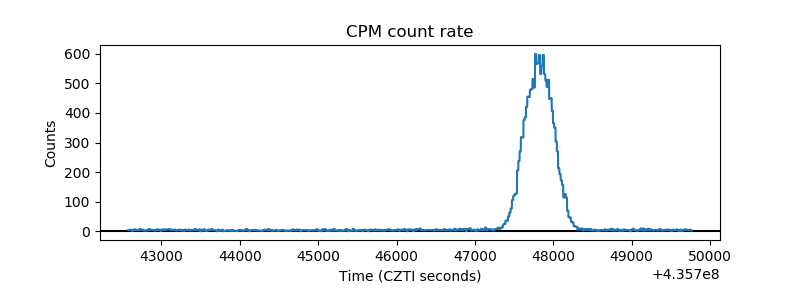 |
| CZT Counter | 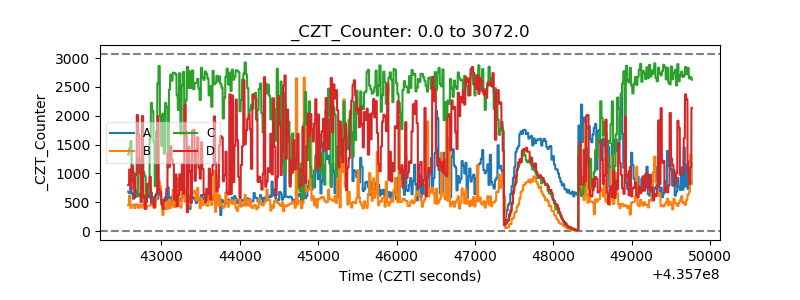 |
| +2.5 Volts monitor | 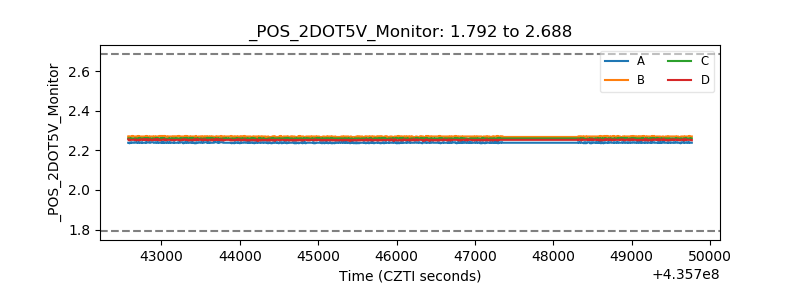 |
| +5 Volts monitor | 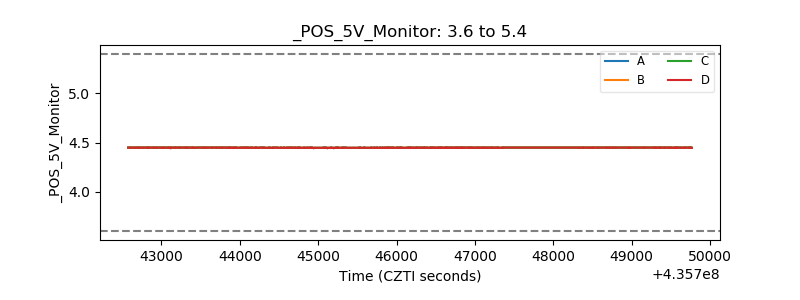 |
| _ROLL_ROT | 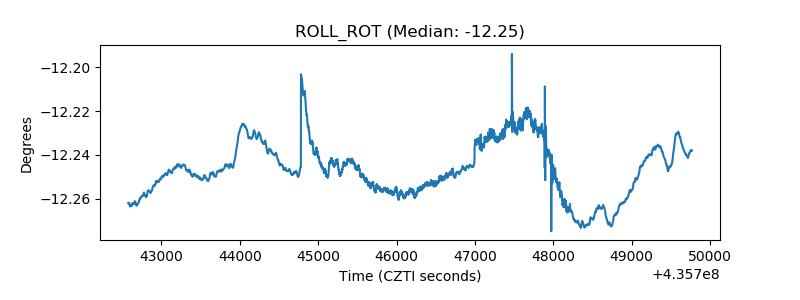 |
| _Roll_DEC | 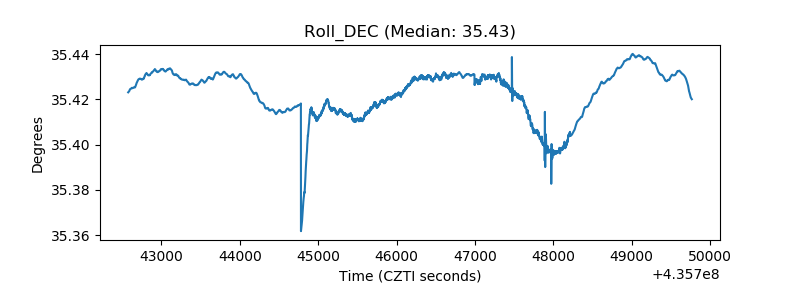 |
| _Roll_RA | 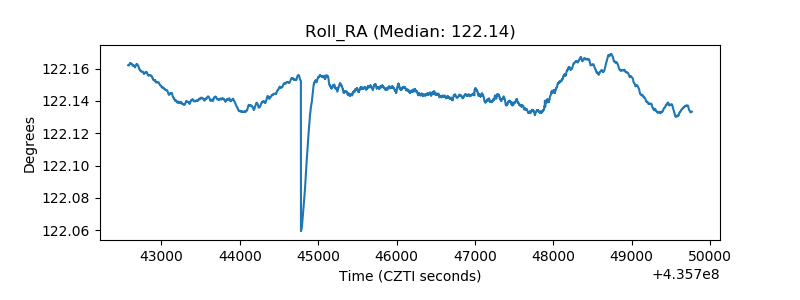 |
| Veto Counter | 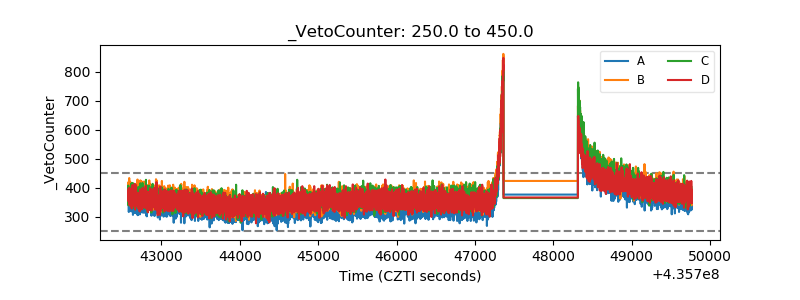 |