| Param | Original file | Final file |
|---|---|---|
| Filename | modeM0/AS1A12_095T02_9000005892_43631cztM0_level2.fits | modeM0/AS1A12_095T02_9000005892_43631cztM0_level2_quad_clean.evt |
| Size (bytes) | 832,674,240 | 95,843,520 |
| Size | 794.1 MB | 91.4 MB |
| Events in quadrant A | 5,454,326 | 699,238 |
| Events in quadrant B | 3,537,303 | 718,379 |
| Events in quadrant C | 11,806,735 | 529,233 |
| Events in quadrant D | 9,551,873 | 525,425 |
| Mode M9 | |||
|---|---|---|---|
| Quadrant | BADHDUFLAG | Total packets | Discarded packets |
| A | 0 | 11 | 0 |
| B | 0 | 11 | 0 |
| C | 0 | 11 | 0 |
| D | 0 | 11 | 0 |
| Mode M0 | |||
|---|---|---|---|
| Quadrant | BADHDUFLAG | Total packets | Discarded packets |
| A | 0 | 20738 | 1 |
| B | 0 | 14452 | 1 |
| C | 0 | 39277 | 1 |
| D | 0 | 32656 | 3 |
| Mode SS | |||
|---|---|---|---|
| Quadrant | BADHDUFLAG | Total packets | Discarded packets |
| A | 0 | 124 | 0 |
| B | 0 | 124 | 0 |
| C | 0 | 124 | 0 |
| D | 0 | 124 | 0 |
| Quadrant | Total seconds | Saturated seconds | Saturation percentage |
|---|---|---|---|
| A | 6118 | 386 | 6.309251% |
| B | 6118 | 109 | 1.781628% |
| C | 6118 | 3251 | 53.138280% |
| D | 6117 | 2269 | 37.093346% |
Noise dominated data is calculated using 1-second bins in cleaned event files. If a bin has >2000 counts, and if more than 50% of those come from <1% of pixels, then it is considered to be noise-dominated and hence unusable.
| Quadrant | # 1 sec bins | Bins with >0 counts | Bins with >2000 counts | High rate bins dominated by noise | Noise dominated (total time) | Noise dominated (detector-on time) | Marked lightcurve |
|---|---|---|---|---|---|---|---|
| A | 7188 | 6118 | 157 | 157 | 2.18% | 2.57% | 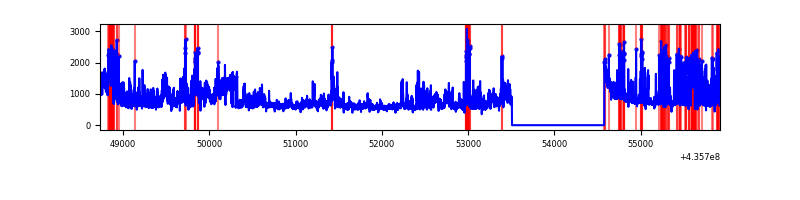 |
| B | 7188 | 6118 | 37 | 37 | 0.51% | 0.60% | 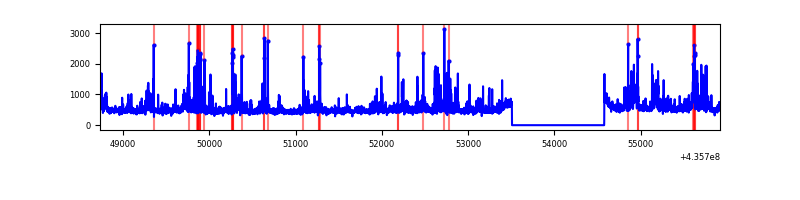 |
| C | 7187 | 6117 | 3224 | 3224 | 44.86% | 52.71% | 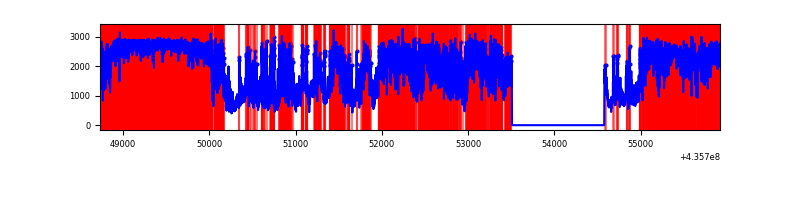 |
| D | 7187 | 6117 | 1989 | 1989 | 27.67% | 32.52% | 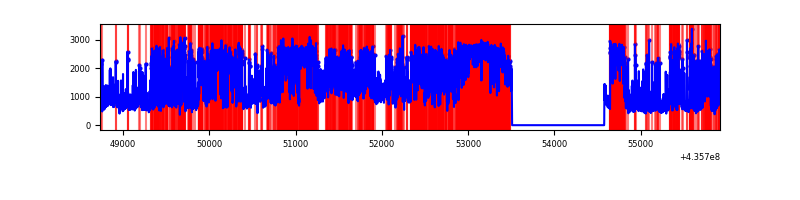 |
Top three noisy pixels from each quadrant. If the there are fewer than three noisy pixels in the level2.evt file, extra rows are filled as -1
| Pixel properties | Quadrant properties | ||||||
|---|---|---|---|---|---|---|---|
| Quadrant | DetID | PixID | Counts | Sigma | Mean | Median | Sigma |
| A | 14 | 63 | 896318 | 6174.08 | 706 | 694 | 145.1 |
| A | 10 | 83 | 732353 | 5043.77 | 706 | 694 | 145.1 |
| A | 0 | 228 | 403208 | 2774.77 | 706 | 694 | 145.1 |
| B | 5 | 235 | 281953 | 2003.39 | 710 | 690 | 140.4 |
| B | 12 | 32 | 81376 | 574.71 | 710 | 690 | 140.4 |
| B | 3 | 42 | 66200 | 466.62 | 710 | 690 | 140.4 |
| C | 15 | 142 | 5199123 | 40328.95 | 546 | 550 | 128.9 |
| C | 15 | 174 | 2159335 | 16747.2 | 546 | 550 | 128.9 |
| C | 15 | 157 | 895133 | 6939.9 | 546 | 550 | 128.9 |
| D | 4 | 212 | 895817 | 5772.54 | 596 | 577 | 155.1 |
| D | 4 | 216 | 785849 | 5063.46 | 596 | 577 | 155.1 |
| D | 5 | 222 | 740211 | 4769.18 | 596 | 577 | 155.1 |
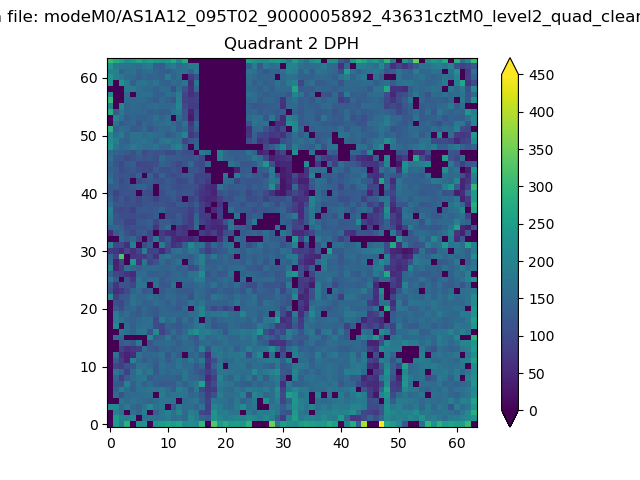
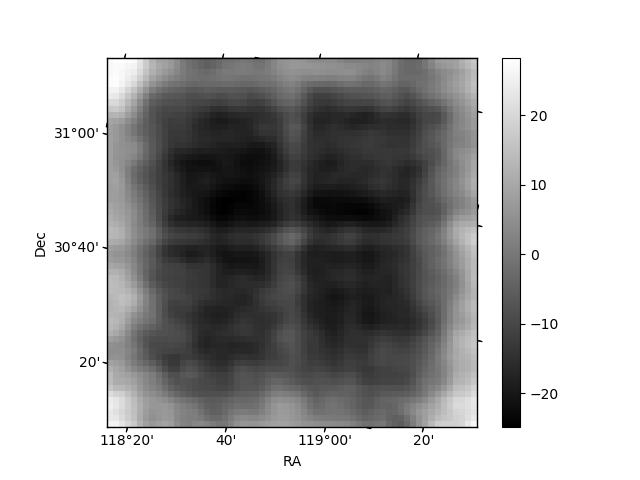
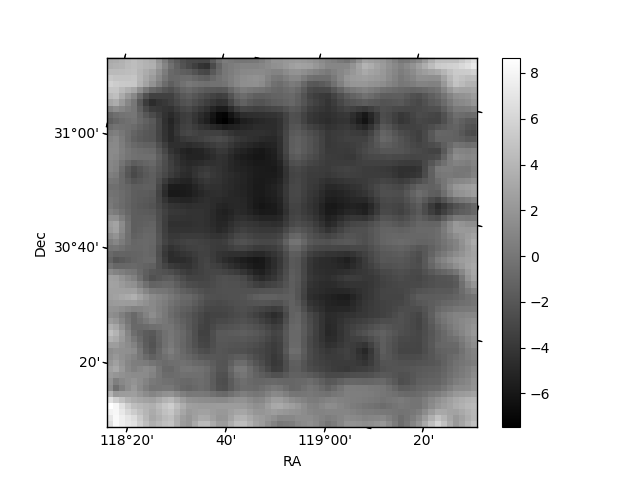
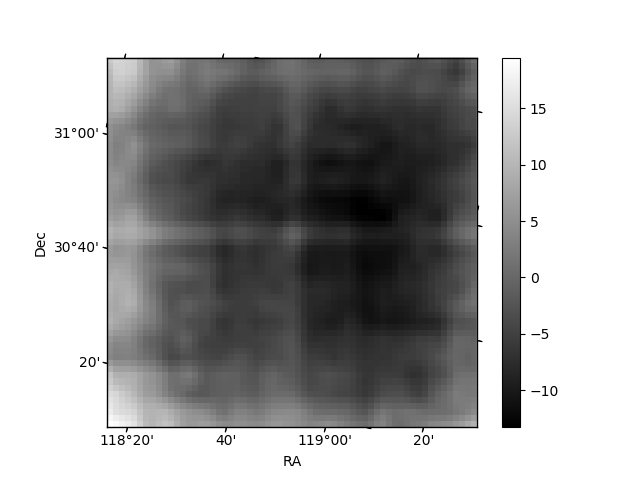
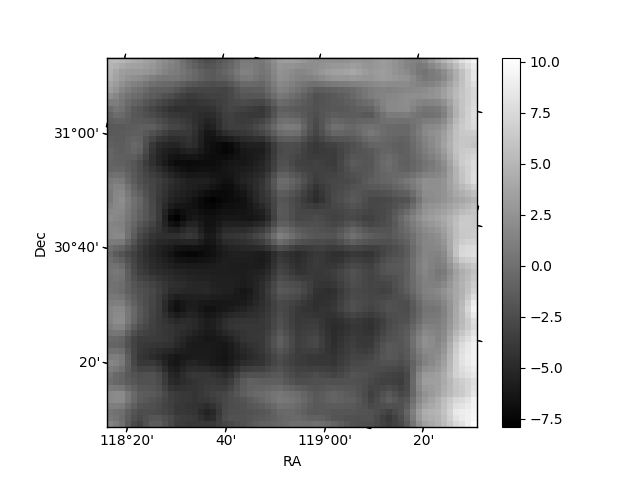
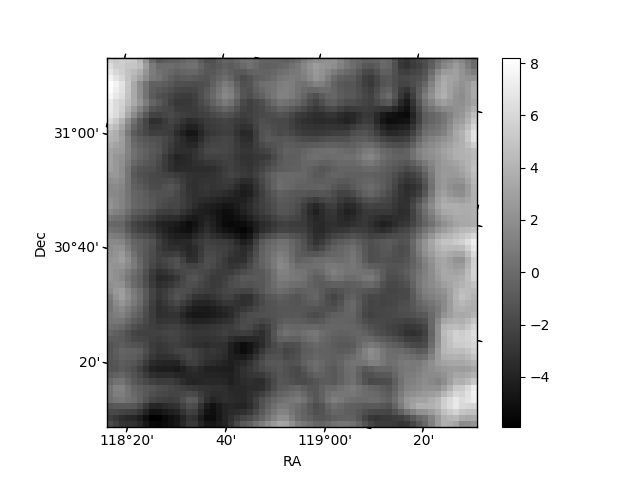
Histogram calculated using DETX and DETY for each event in the final _common_clean file
| Quadrant A | 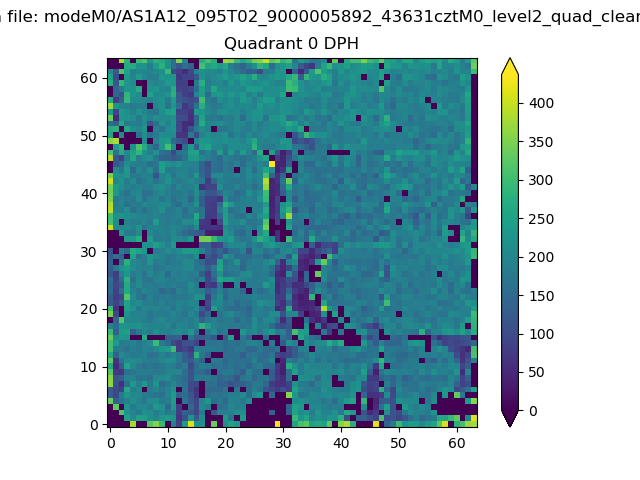 |
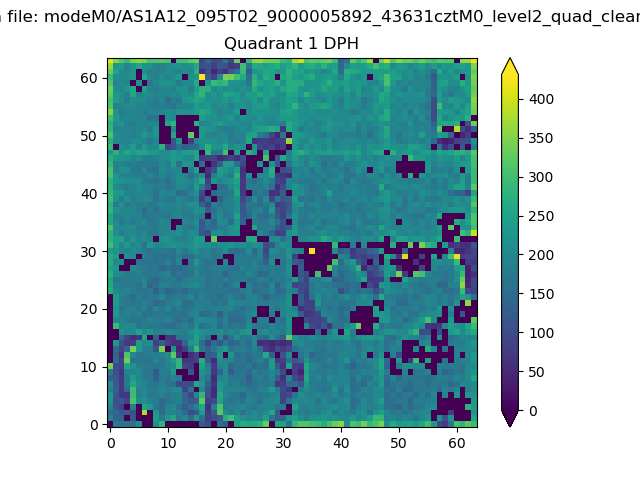 |
Quadrant B |
|---|---|---|---|
| Quadrant D | 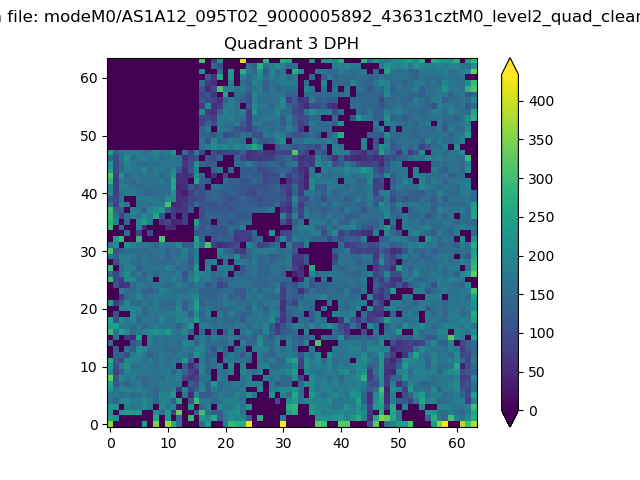 |
 |
Quadrant C |
| Plot type | Count rate plots | Images |
|---|---|---|
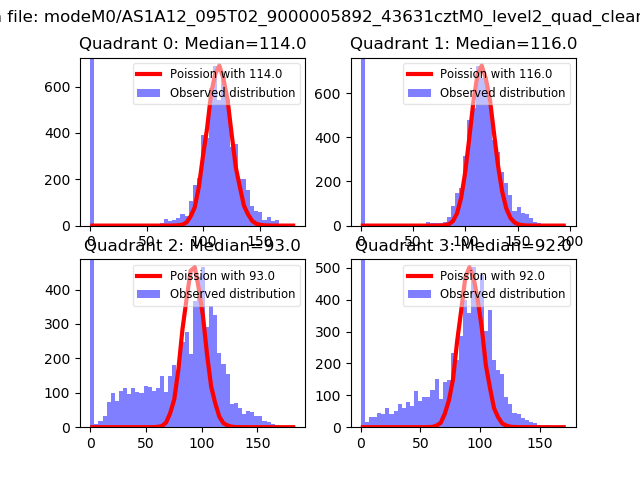
| Comparison with Poisson distribution Blue bars denote a histogram of data divided into 1 sec bins. Red curve is a Poisson curve with rate = median count rate of data. |
 |
 |
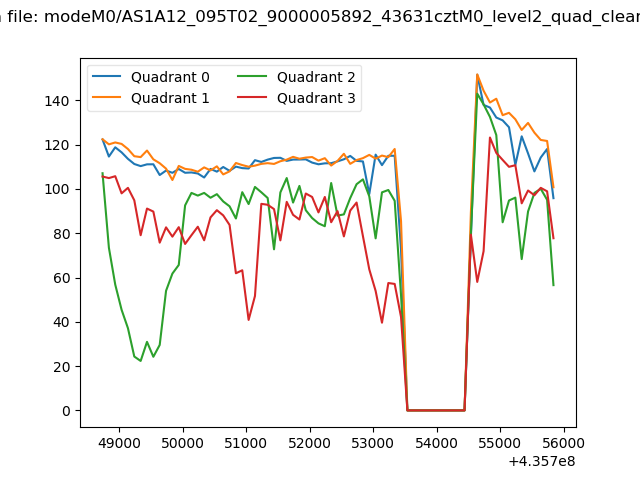
| Quadrant-wise count rates Data is divided into 100 sec bins |
 |
|
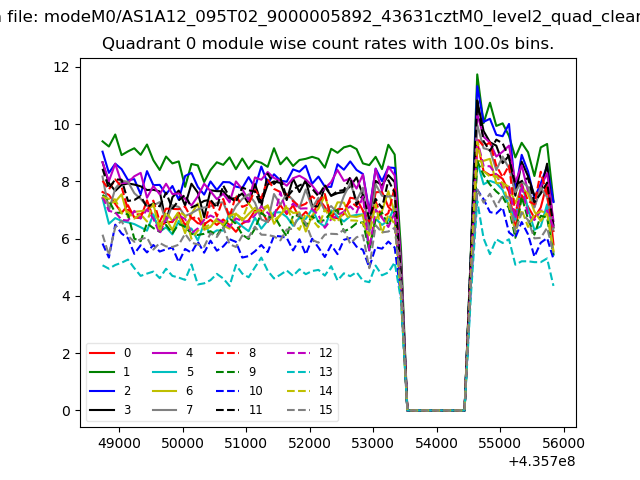
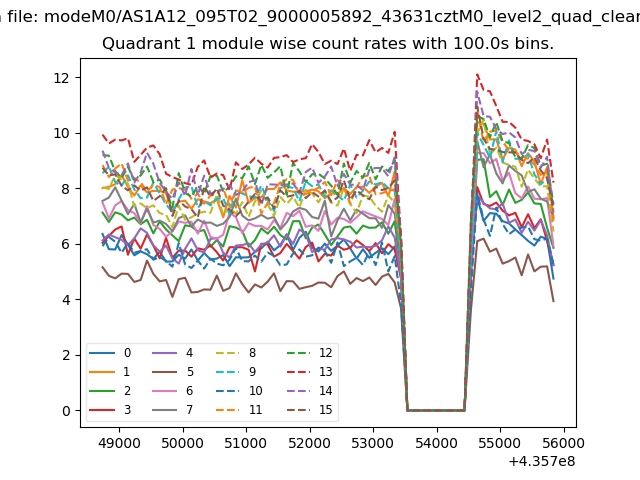
| Module-wise count rates for Quadrant A Data is divided into 100 sec bins |
 |
 |
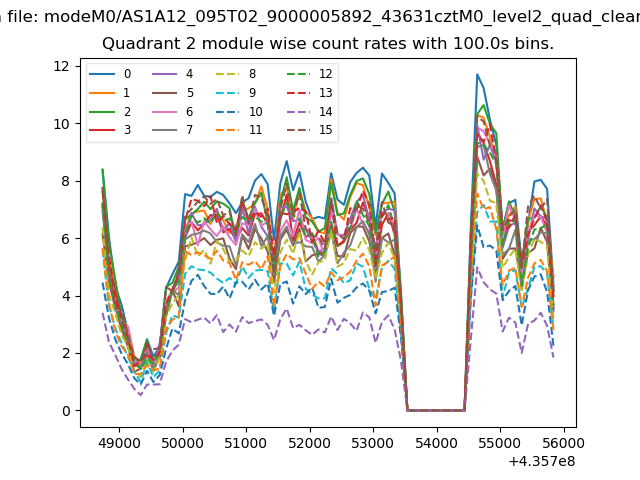
| Module-wise count rates for Quadrant B Data is divided into 100 sec bins |
 |
 |
| Module-wise count rates for Quadrant C Data is divided into 100 sec bins |
 |
 |
| Module-wise count rates for Quadrant D Data is divided into 100 sec bins |
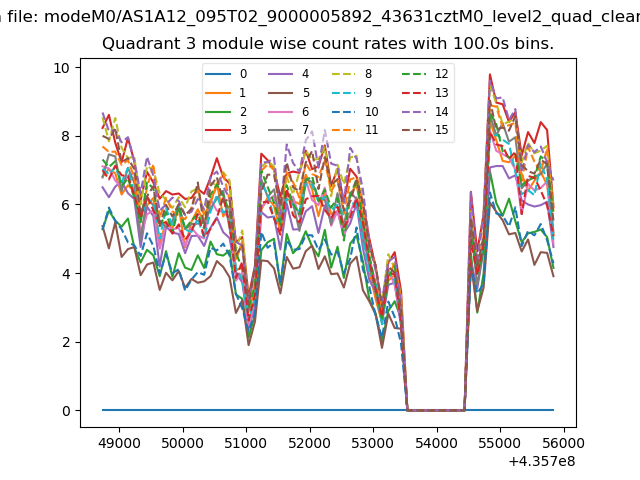 |
 |
| Parameter | Plot |
|---|---|
| CZT HV Monitor |  |
| D_VDD | 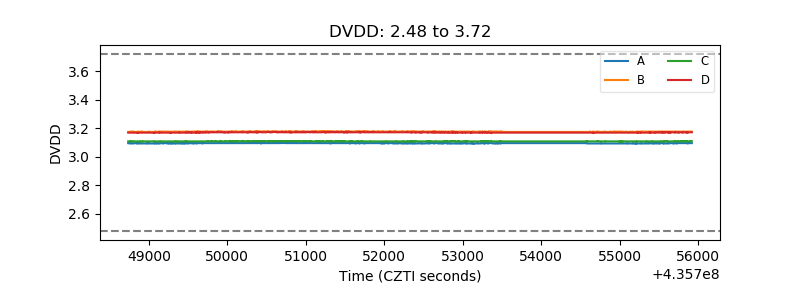 |
| Temperature 1 | 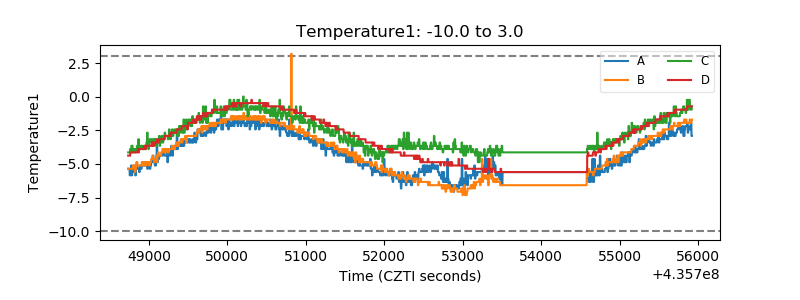 |
| Veto HV Monitor | 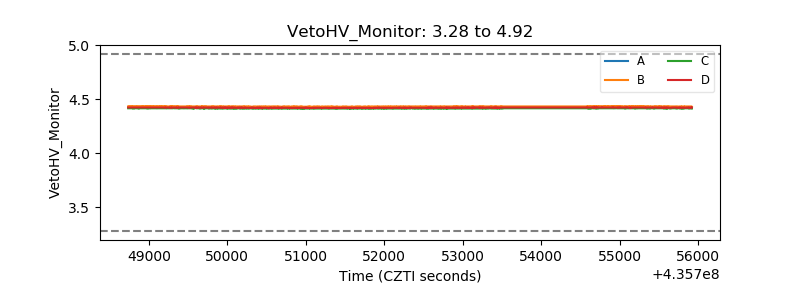 |
| Veto LLD | 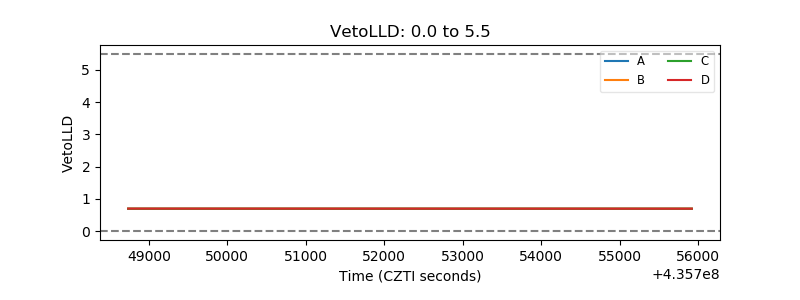 |
| Alpha Counter | 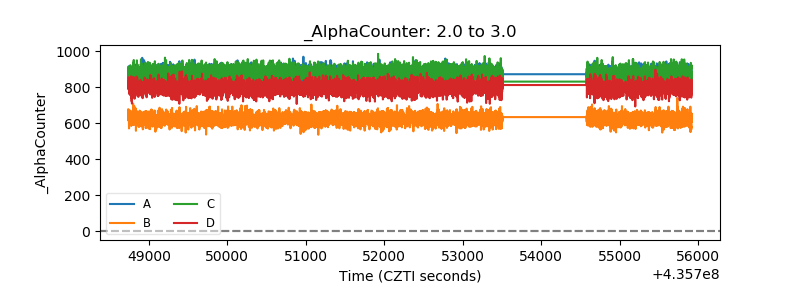 |
| _CPM_Rate | 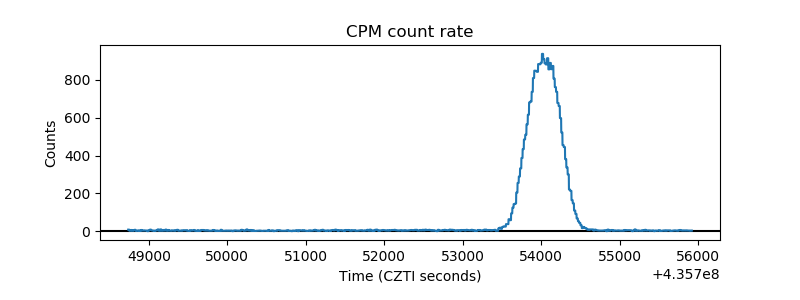 |
| CZT Counter | 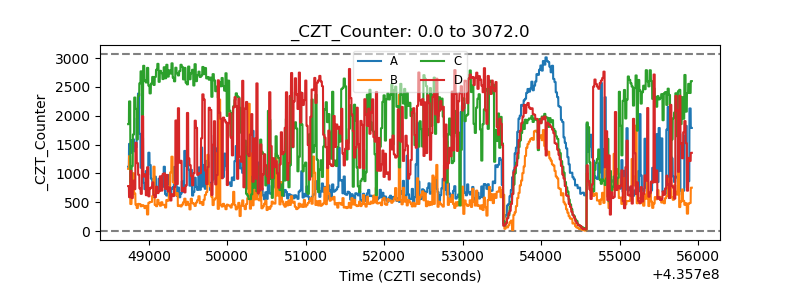 |
| +2.5 Volts monitor | 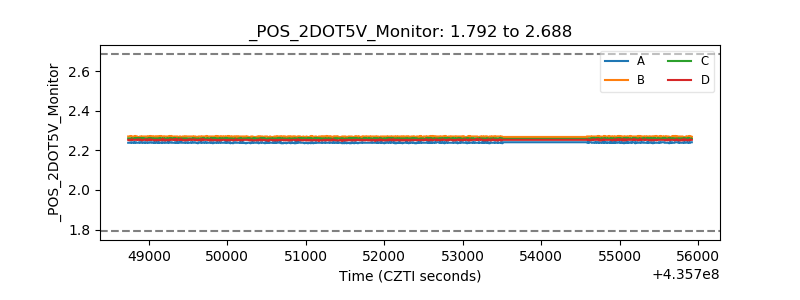 |
| +5 Volts monitor | 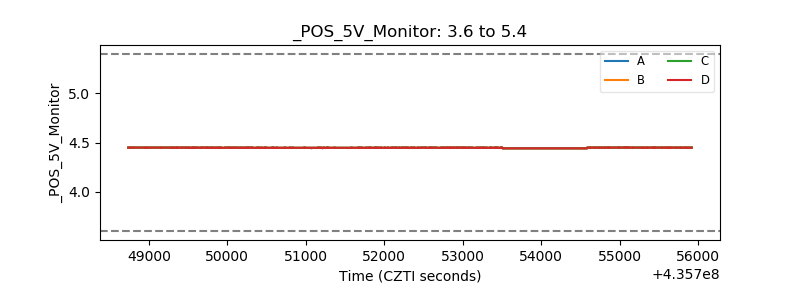 |
| _ROLL_ROT | 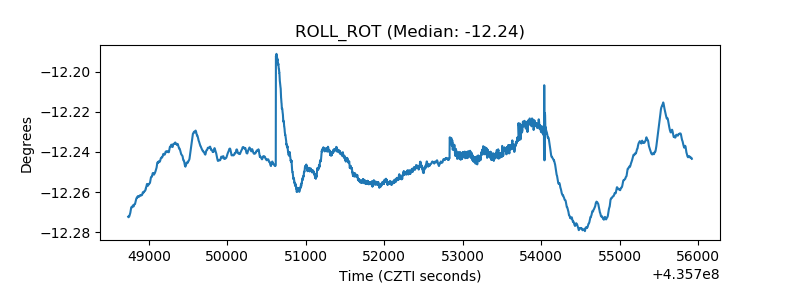 |
| _Roll_DEC | 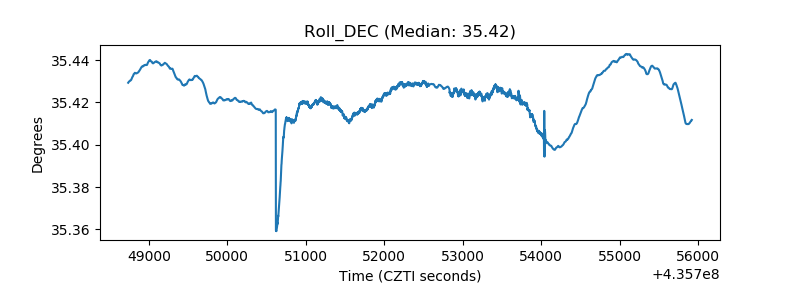 |
| _Roll_RA | 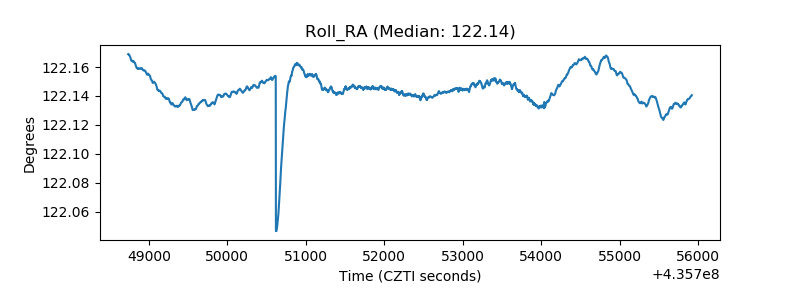 |
| Veto Counter | 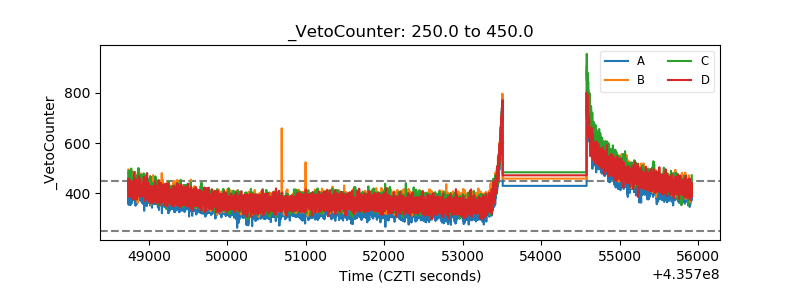 |