| Param | Original file | Final file |
|---|---|---|
| Filename | modeM0/AS1A12_095T02_9000005892_43632cztM0_level2.fits | modeM0/AS1A12_095T02_9000005892_43632cztM0_level2_quad_clean.evt |
| Size (bytes) | 929,136,960 | 101,727,360 |
| Size | 886.1 MB | 97.0 MB |
| Events in quadrant A | 5,215,243 | 770,195 |
| Events in quadrant B | 4,343,289 | 792,297 |
| Events in quadrant C | 15,391,502 | 443,063 |
| Events in quadrant D | 8,948,721 | 624,140 |
| Mode M9 | |||
|---|---|---|---|
| Quadrant | BADHDUFLAG | Total packets | Discarded packets |
| A | 0 | 11 | 0 |
| B | 0 | 11 | 0 |
| C | 0 | 11 | 0 |
| D | 0 | 11 | 0 |
| Mode M0 | |||
|---|---|---|---|
| Quadrant | BADHDUFLAG | Total packets | Discarded packets |
| A | 0 | 20368 | 1 |
| B | 0 | 17192 | 1 |
| C | 0 | 50149 | 1 |
| D | 0 | 31106 | 1 |
| Mode SS | |||
|---|---|---|---|
| Quadrant | BADHDUFLAG | Total packets | Discarded packets |
| A | 0 | 132 | 0 |
| B | 0 | 132 | 0 |
| C | 0 | 132 | 0 |
| D | 0 | 132 | 0 |
| Quadrant | Total seconds | Saturated seconds | Saturation percentage |
|---|---|---|---|
| A | 6401 | 395 | 6.170911% |
| B | 6402 | 176 | 2.749141% |
| C | 6402 | 5637 | 88.050609% |
| D | 6402 | 1580 | 24.679788% |
Noise dominated data is calculated using 1-second bins in cleaned event files. If a bin has >2000 counts, and if more than 50% of those come from <1% of pixels, then it is considered to be noise-dominated and hence unusable.
| Quadrant | # 1 sec bins | Bins with >0 counts | Bins with >2000 counts | High rate bins dominated by noise | Noise dominated (total time) | Noise dominated (detector-on time) | Marked lightcurve |
|---|---|---|---|---|---|---|---|
| A | 7556 | 6401 | 167 | 167 | 2.21% | 2.61% | 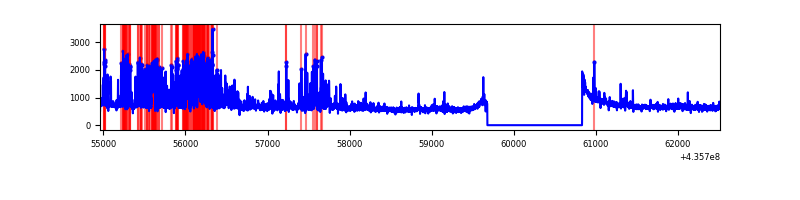 |
| B | 7557 | 6402 | 74 | 74 | 0.98% | 1.16% | 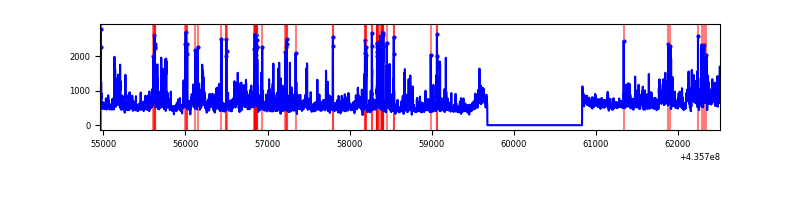 |
| C | 7556 | 6401 | 5522 | 5522 | 73.08% | 86.27% | 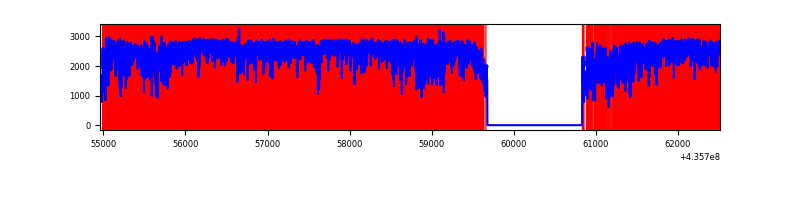 |
| D | 7557 | 6402 | 1464 | 1464 | 19.37% | 22.87% | 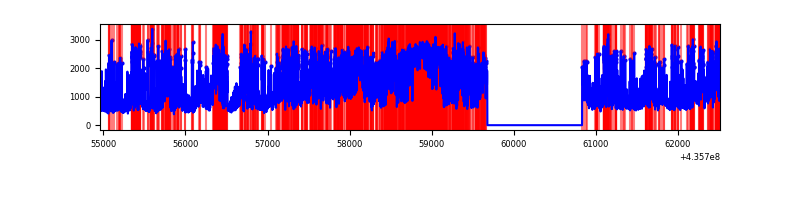 |
Top three noisy pixels from each quadrant. If the there are fewer than three noisy pixels in the level2.evt file, extra rows are filled as -1
| Pixel properties | Quadrant properties | ||||||
|---|---|---|---|---|---|---|---|
| Quadrant | DetID | PixID | Counts | Sigma | Mean | Median | Sigma |
| A | 0 | 228 | 878970 | 5565.2 | 769 | 755 | 157.8 |
| A | 10 | 83 | 779469 | 4934.67 | 769 | 755 | 157.8 |
| A | 9 | 240 | 226586 | 1431.08 | 769 | 755 | 157.8 |
| B | 5 | 235 | 471634 | 3198.4 | 768 | 747 | 147.2 |
| B | 4 | 206 | 452457 | 3068.14 | 768 | 747 | 147.2 |
| B | 0 | 183 | 65345 | 438.77 | 768 | 747 | 147.2 |
| C | 15 | 142 | 9162236 | 86943.49 | 448 | 449 | 105.4 |
| C | 15 | 174 | 1767168 | 16765.8 | 448 | 449 | 105.4 |
| C | 3 | 233 | 1395643 | 13240.11 | 448 | 449 | 105.4 |
| D | 4 | 216 | 1038088 | 5678.62 | 700 | 678 | 182.7 |
| D | 4 | 212 | 668640 | 3656.32 | 700 | 678 | 182.7 |
| D | 4 | 221 | 638305 | 3490.27 | 700 | 678 | 182.7 |
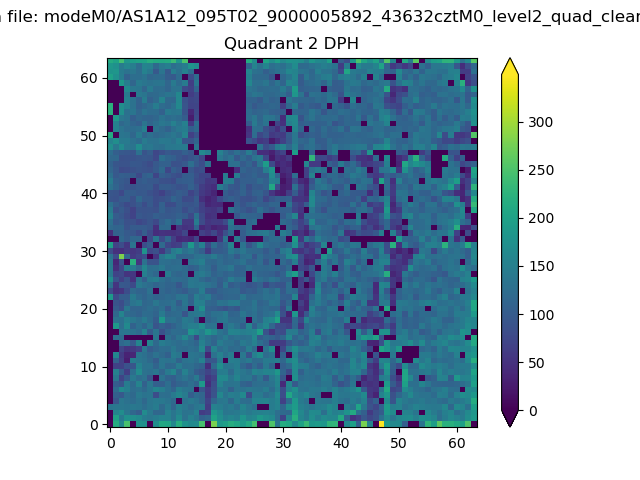
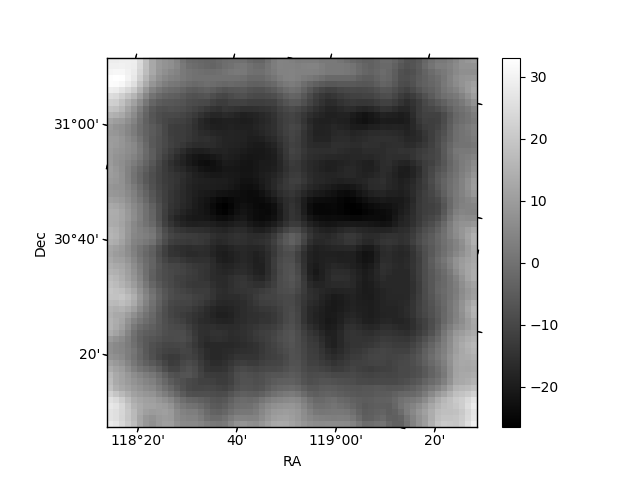
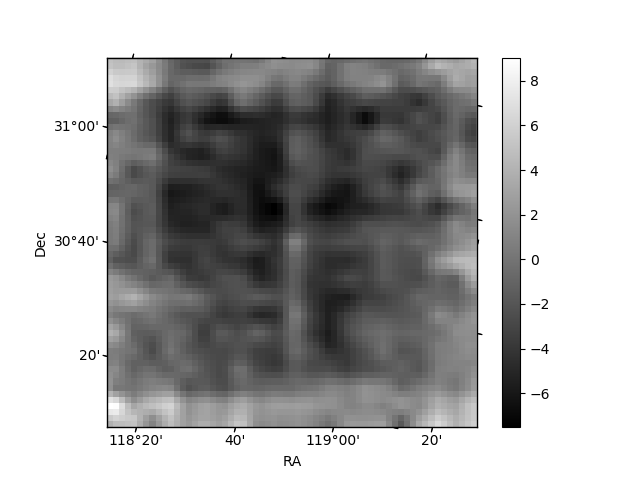
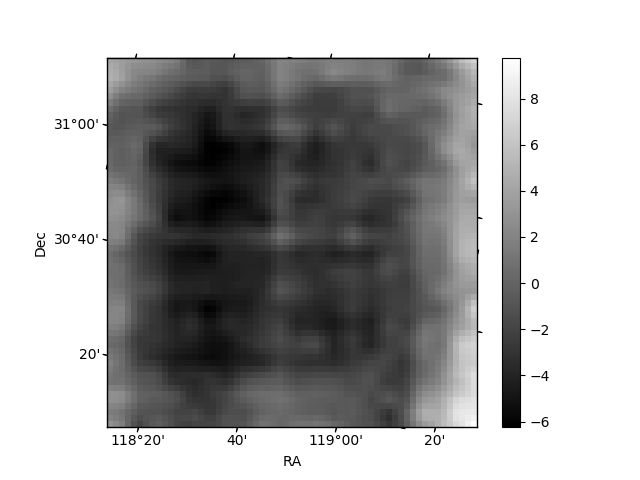
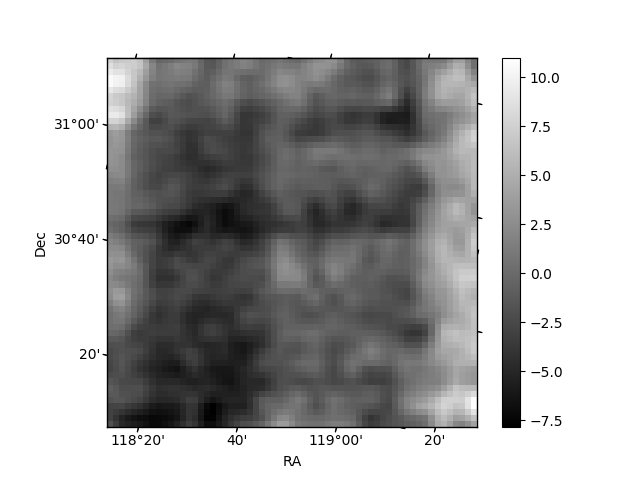
Histogram calculated using DETX and DETY for each event in the final _common_clean file
| Quadrant A | 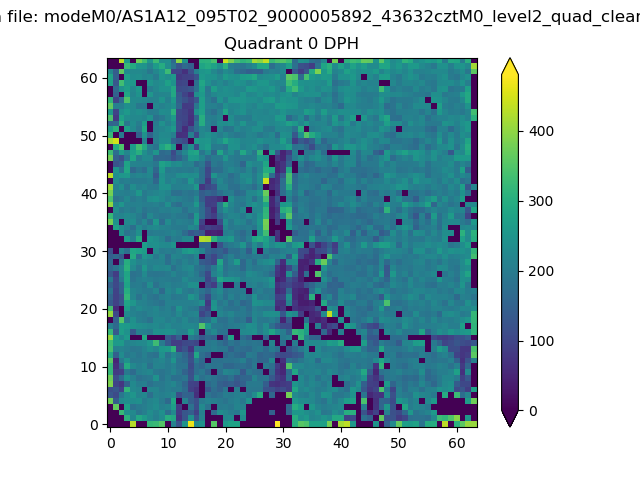 |
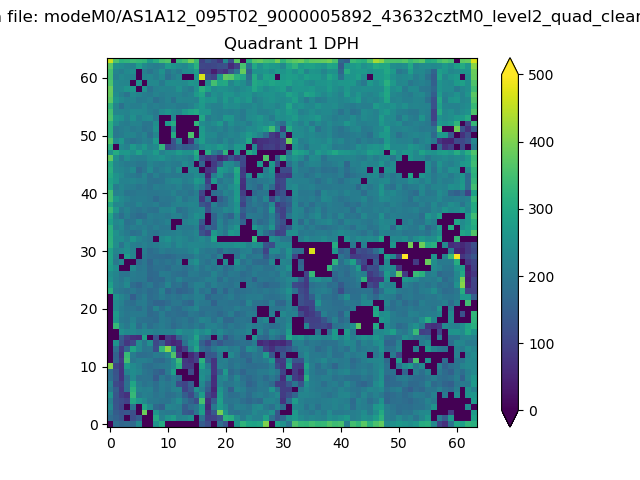 |
Quadrant B |
|---|---|---|---|
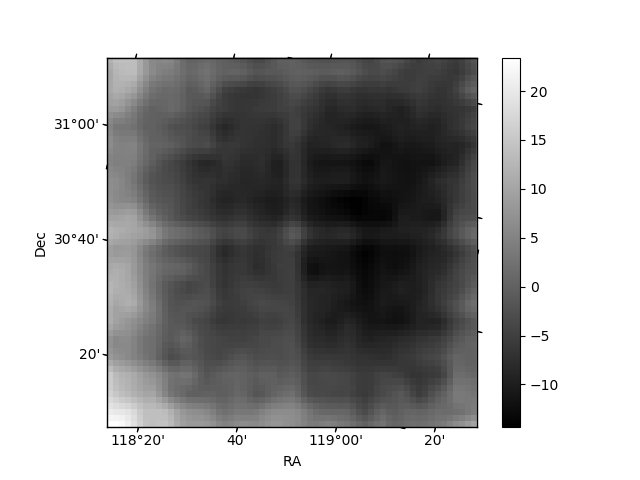
| Quadrant D | 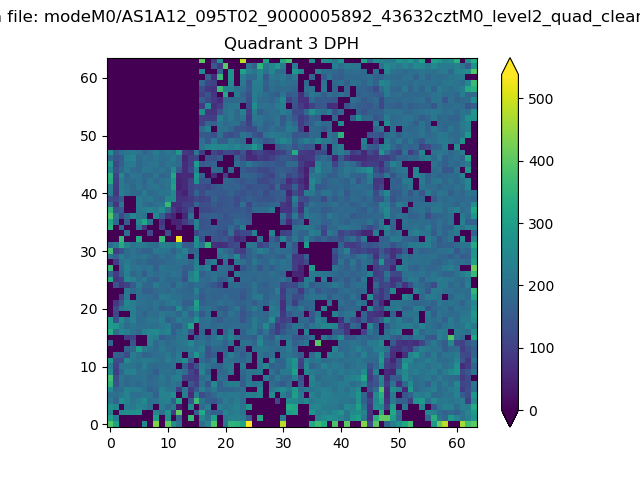 |
 |
Quadrant C |
| Plot type | Count rate plots | Images |
|---|---|---|
| Comparison with Poisson distribution Blue bars denote a histogram of data divided into 1 sec bins. Red curve is a Poisson curve with rate = median count rate of data. |
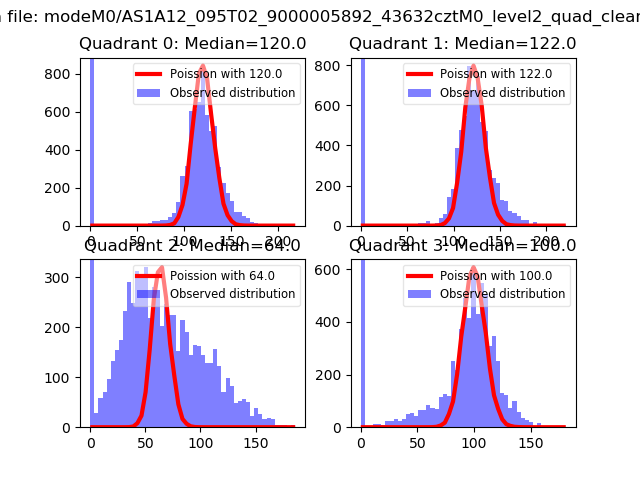 |
 |
| Quadrant-wise count rates Data is divided into 100 sec bins |
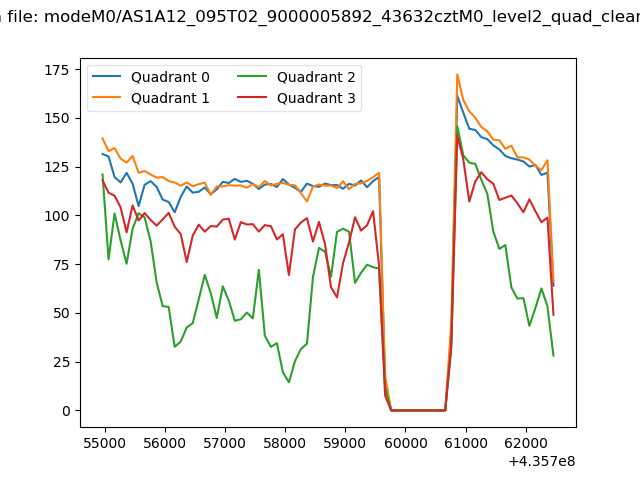 |
|
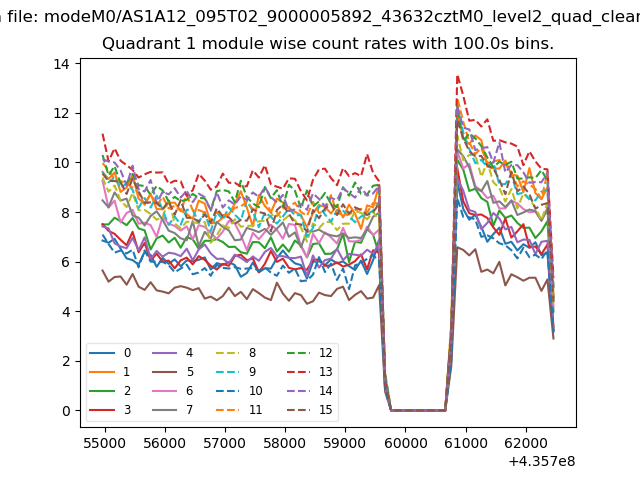
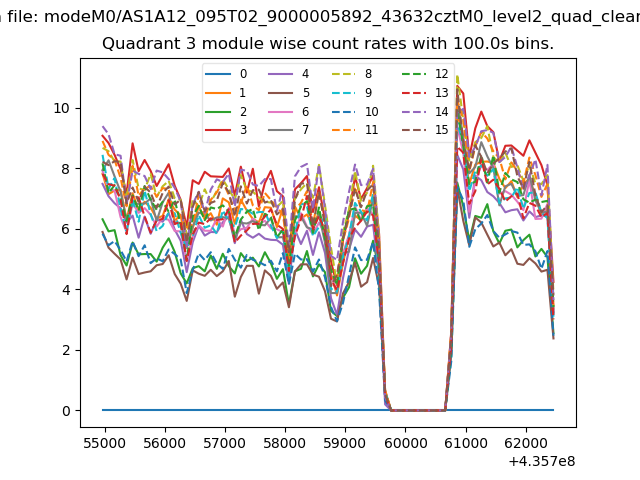
| Module-wise count rates for Quadrant A Data is divided into 100 sec bins |
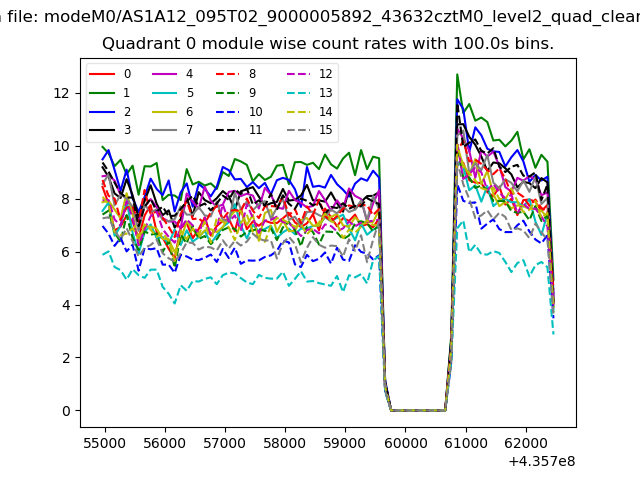 |
 |
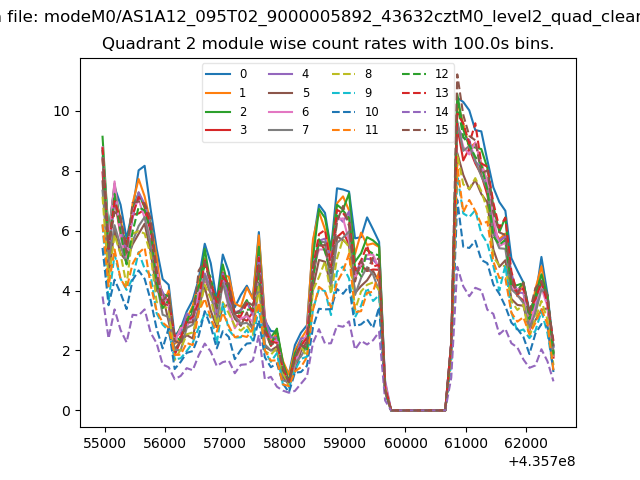
| Module-wise count rates for Quadrant B Data is divided into 100 sec bins |
 |
 |
| Module-wise count rates for Quadrant C Data is divided into 100 sec bins |
 |
 |
| Module-wise count rates for Quadrant D Data is divided into 100 sec bins |
 |
 |
| Parameter | Plot |
|---|---|
| CZT HV Monitor |  |
| D_VDD | 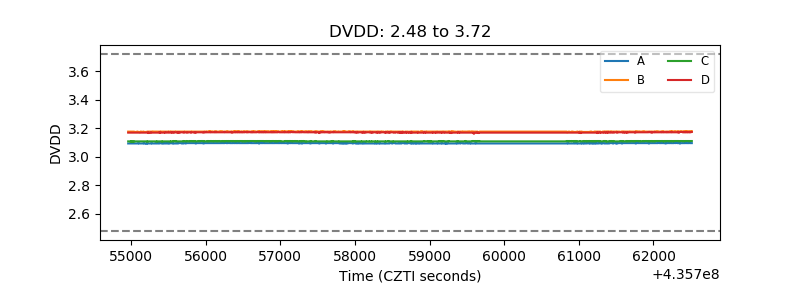 |
| Temperature 1 | 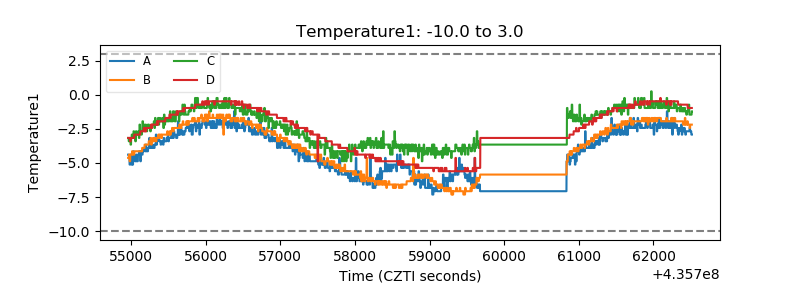 |
| Veto HV Monitor | 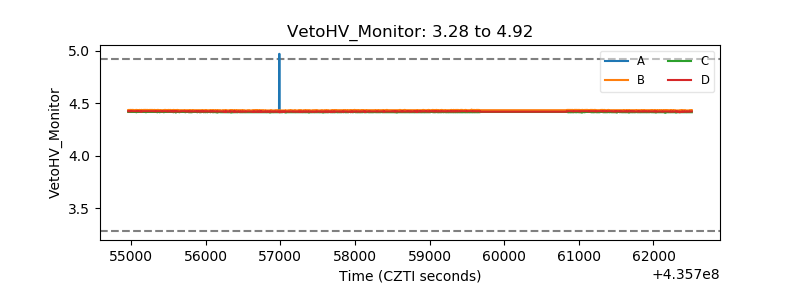 |
| Veto LLD | 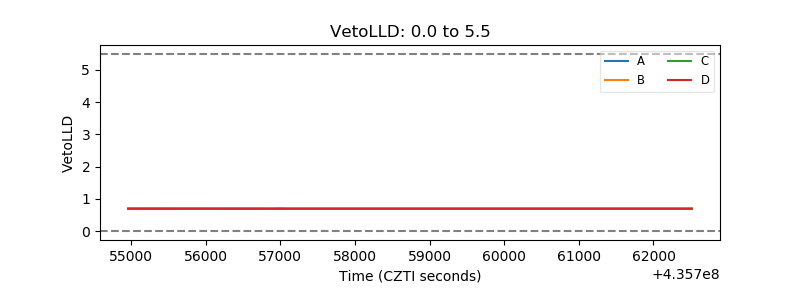 |
| Alpha Counter | 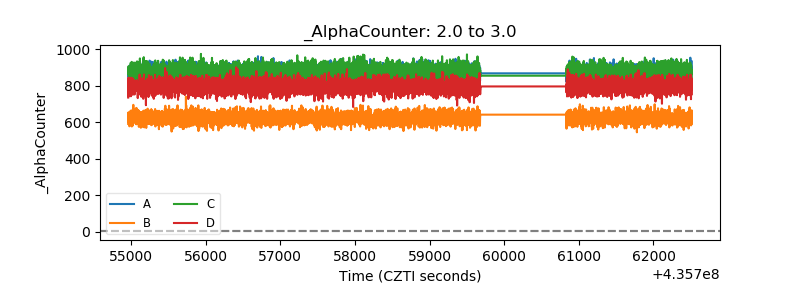 |
| _CPM_Rate | 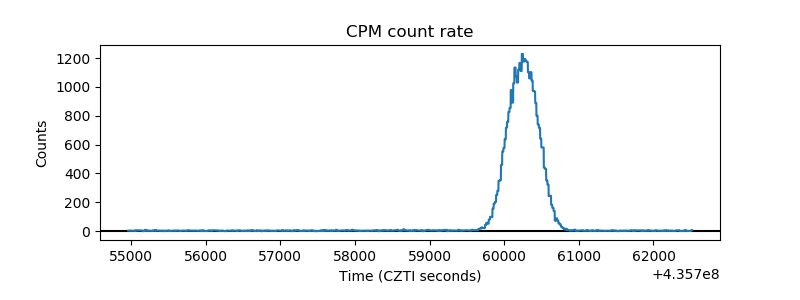 |
| CZT Counter | 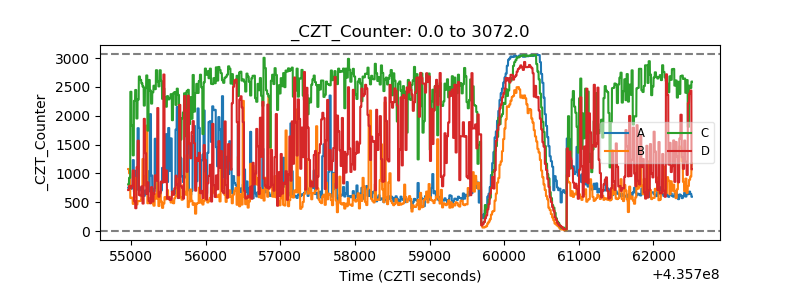 |
| +2.5 Volts monitor | 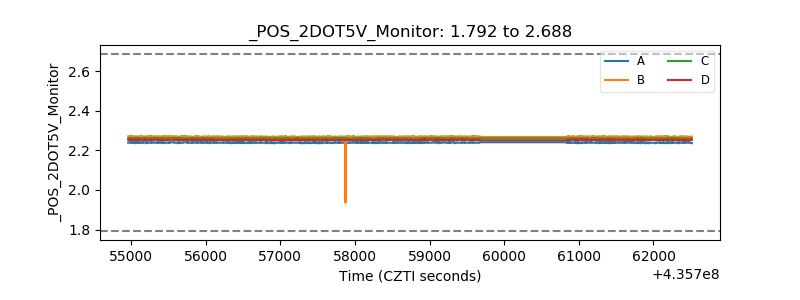 |
| +5 Volts monitor | 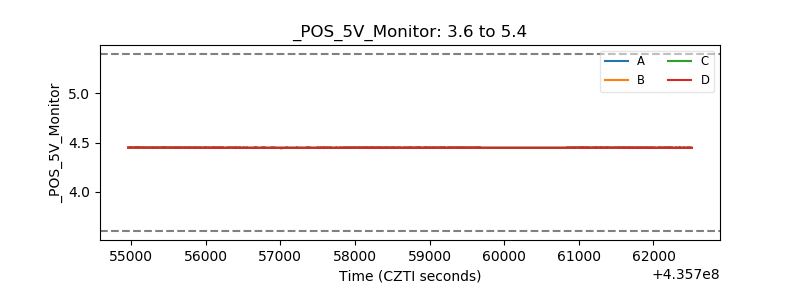 |
| _ROLL_ROT | 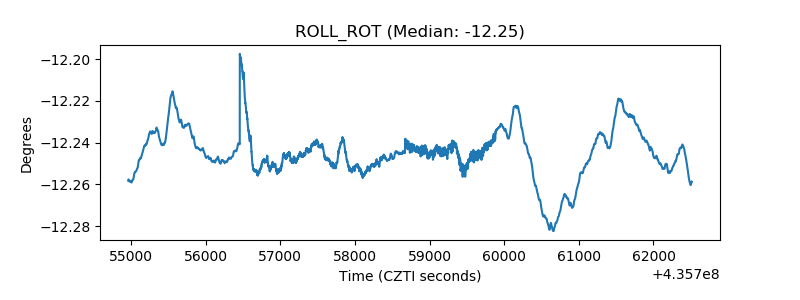 |
| _Roll_DEC | 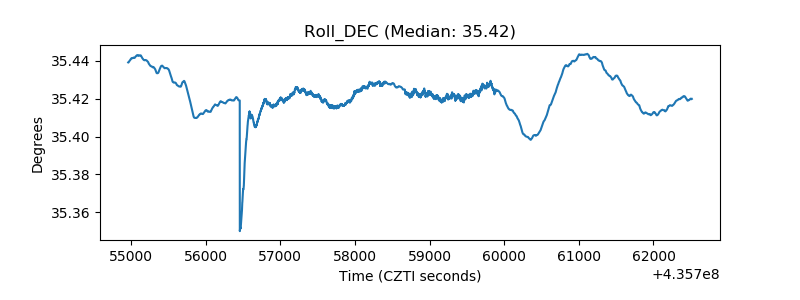 |
| _Roll_RA | 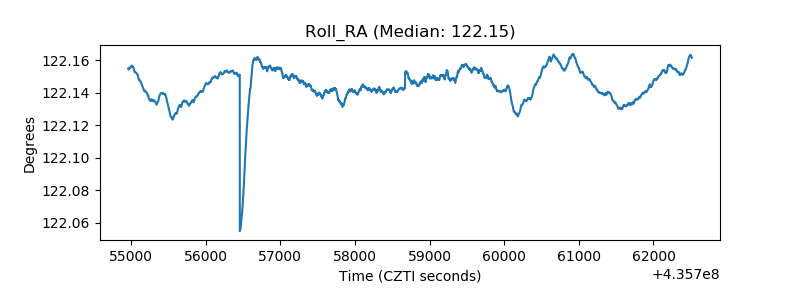 |
| Veto Counter | 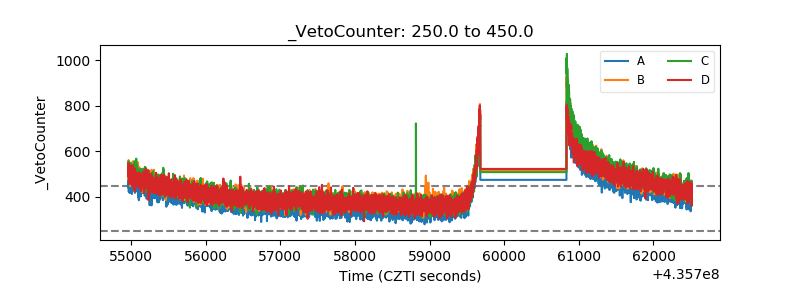 |