| Param | Original file | Final file |
|---|---|---|
| Filename | modeM0/AS1A12_095T02_9000005892_43633cztM0_level2.fits | modeM0/AS1A12_095T02_9000005892_43633cztM0_level2_quad_clean.evt |
| Size (bytes) | 516,902,400 | 46,586,880 |
| Size | 493.0 MB | 44.4 MB |
| Events in quadrant A | 2,232,789 | 424,718 |
| Events in quadrant B | 2,722,264 | 427,251 |
| Events in quadrant C | 8,674,423 | 31,037 |
| Events in quadrant D | 5,238,217 | 284,979 |
| Mode M0 | |||
|---|---|---|---|
| Quadrant | BADHDUFLAG | Total packets | Discarded packets |
| A | 0 | 9244 | 0 |
| B | 0 | 10472 | 0 |
| C | 0 | 28167 | 0 |
| D | 0 | 17956 | 0 |
| Mode SS | |||
|---|---|---|---|
| Quadrant | BADHDUFLAG | Total packets | Discarded packets |
| A | 0 | 68 | 0 |
| B | 0 | 68 | 0 |
| C | 0 | 68 | 0 |
| D | 0 | 68 | 0 |
| Quadrant | Total seconds | Saturated seconds | Saturation percentage |
|---|---|---|---|
| A | 3424 | 20 | 0.584112% |
| B | 3424 | 95 | 2.774533% |
| C | 3424 | 3238 | 94.567757% |
| D | 3424 | 1053 | 30.753505% |
Noise dominated data is calculated using 1-second bins in cleaned event files. If a bin has >2000 counts, and if more than 50% of those come from <1% of pixels, then it is considered to be noise-dominated and hence unusable.
| Quadrant | # 1 sec bins | Bins with >0 counts | Bins with >2000 counts | High rate bins dominated by noise | Noise dominated (total time) | Noise dominated (detector-on time) | Marked lightcurve |
|---|---|---|---|---|---|---|---|
| A | 3424 | 3424 | 18 | 18 | 0.53% | 0.53% | 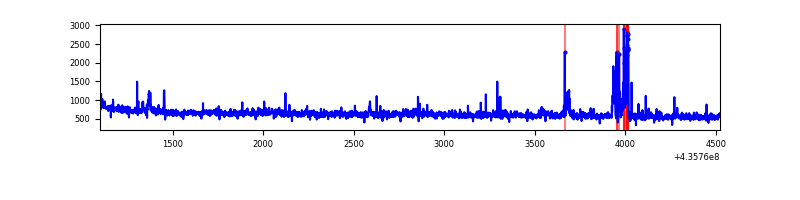 |
| B | 3424 | 3424 | 71 | 71 | 2.07% | 2.07% | 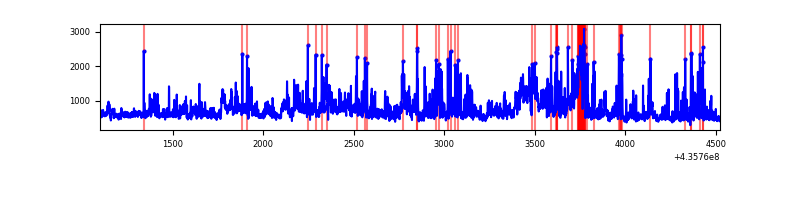 |
| C | 3423 | 3423 | 3199 | 3199 | 93.46% | 93.46% | 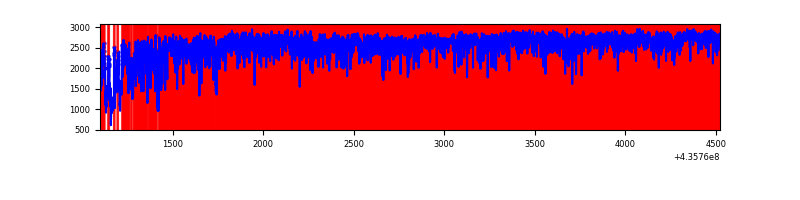 |
| D | 3424 | 3424 | 1013 | 1013 | 29.59% | 29.59% | 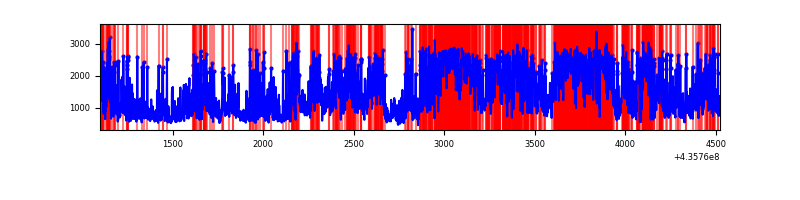 |
Top three noisy pixels from each quadrant. If the there are fewer than three noisy pixels in the level2.evt file, extra rows are filled as -1
| Pixel properties | Quadrant properties | ||||||
|---|---|---|---|---|---|---|---|
| Quadrant | DetID | PixID | Counts | Sigma | Mean | Median | Sigma |
| A | 10 | 83 | 397046 | 4584.86 | 413 | 405 | 86.5 |
| A | 15 | 223 | 110701 | 1274.93 | 413 | 405 | 86.5 |
| A | 9 | 240 | 52703 | 604.52 | 413 | 405 | 86.5 |
| B | 5 | 235 | 404218 | 5203.3 | 403 | 393 | 77.6 |
| B | 4 | 206 | 342175 | 4403.87 | 403 | 393 | 77.6 |
| B | 12 | 32 | 158398 | 2035.9 | 403 | 393 | 77.6 |
| C | 15 | 142 | 6183381 | 134947.77 | 190 | 192 | 45.8 |
| C | 15 | 174 | 892441 | 19473.29 | 190 | 192 | 45.8 |
| C | 3 | 233 | 534414 | 11659.37 | 190 | 192 | 45.8 |
| D | 7 | 80 | 1434199 | 14992.73 | 362 | 350 | 95.6 |
| D | 12 | 233 | 331198 | 3459.44 | 362 | 350 | 95.6 |
| D | 12 | 6 | 237003 | 2474.51 | 362 | 350 | 95.6 |
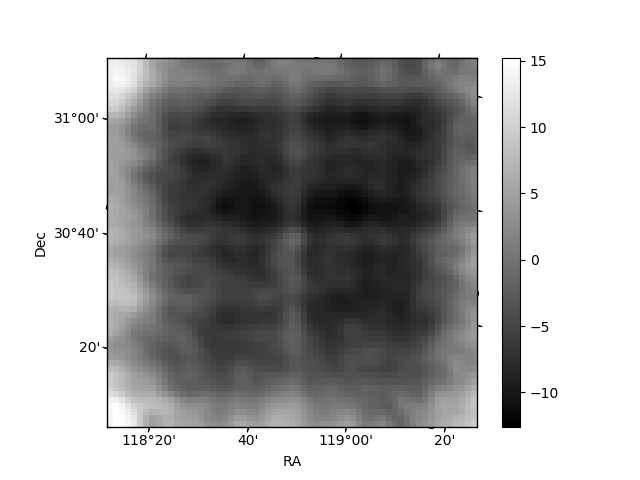
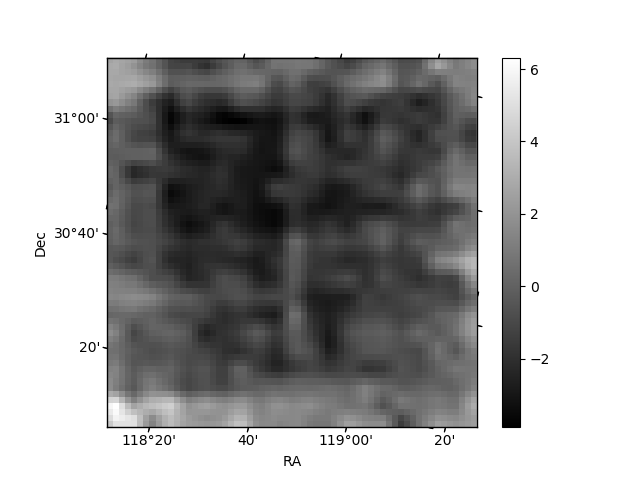
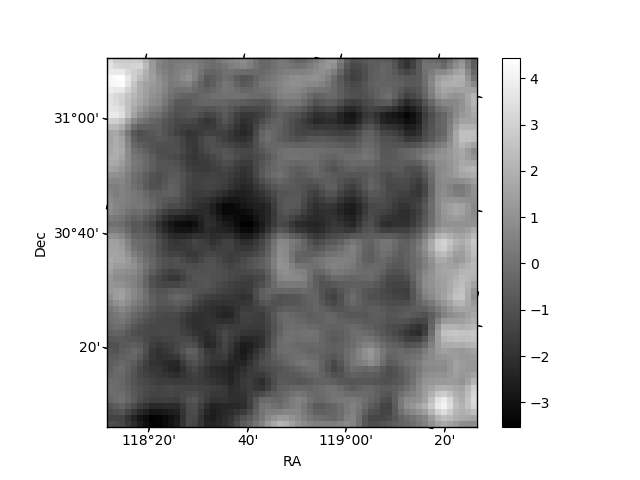
Histogram calculated using DETX and DETY for each event in the final _common_clean file
| Quadrant A | 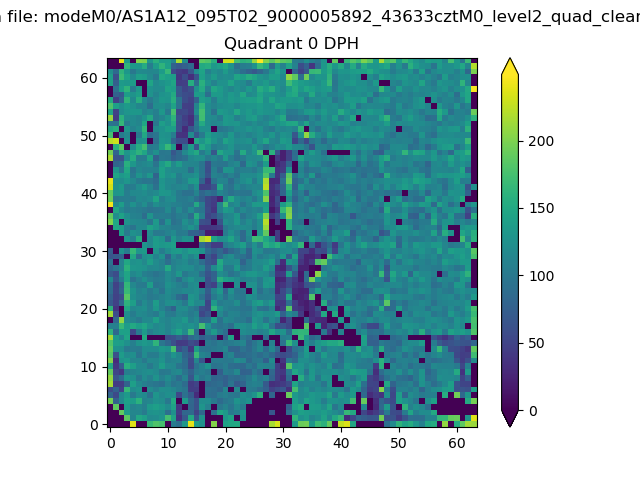 |
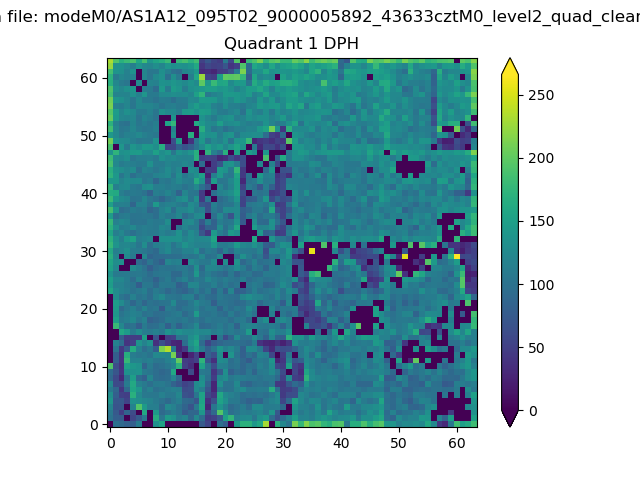 |
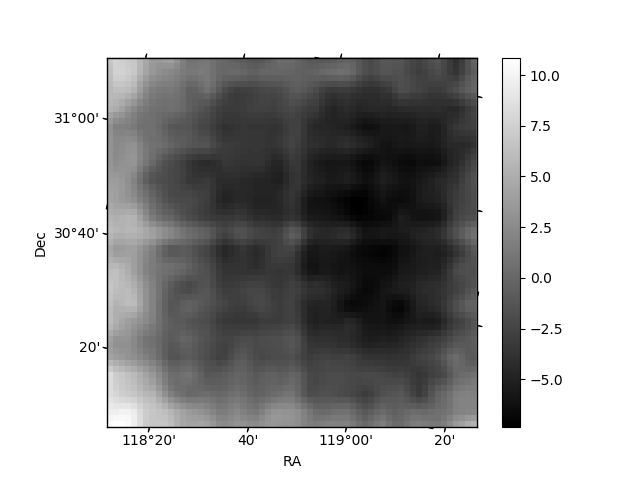
Quadrant B |
|---|---|---|---|
| Quadrant D | 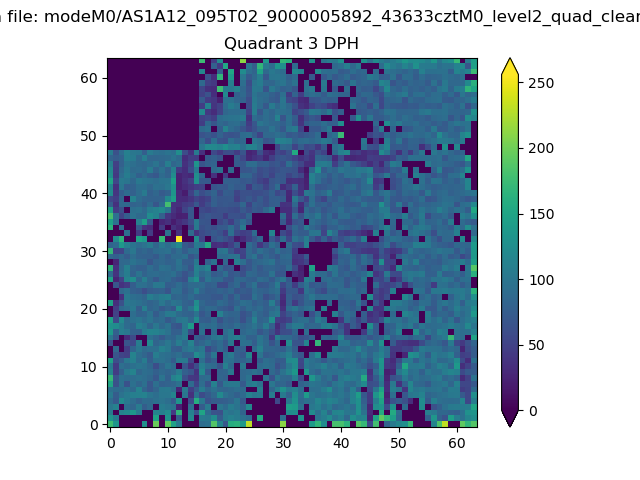 |
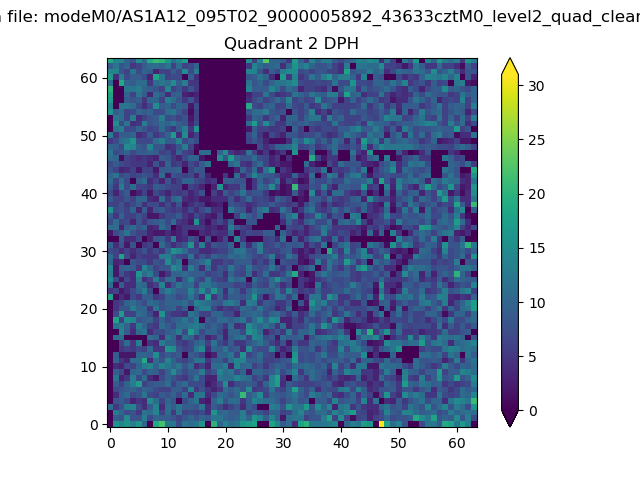 |
Quadrant C |
| Plot type | Count rate plots | Images |
|---|---|---|
| Comparison with Poisson distribution Blue bars denote a histogram of data divided into 1 sec bins. Red curve is a Poisson curve with rate = median count rate of data. |
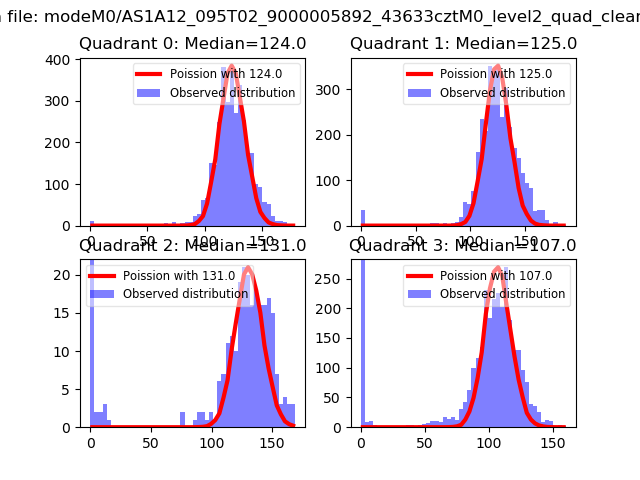 |
 |
| Quadrant-wise count rates Data is divided into 100 sec bins |
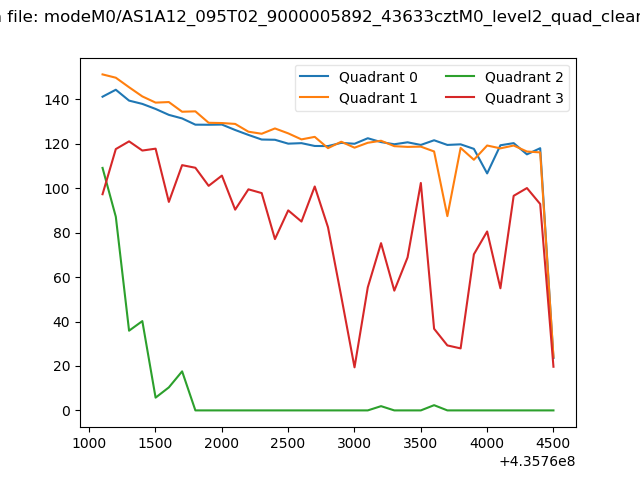 |
|
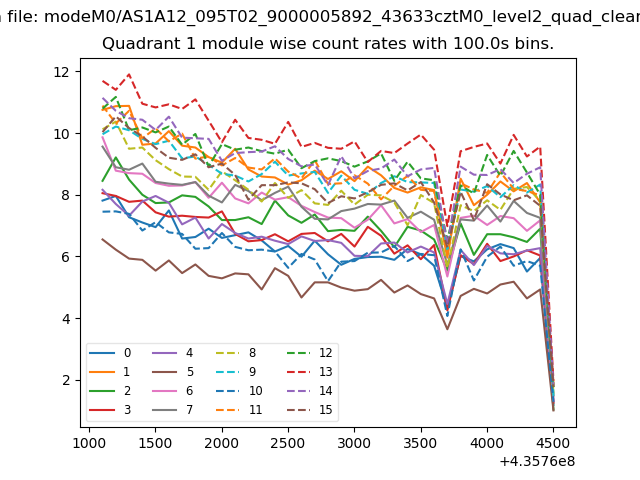
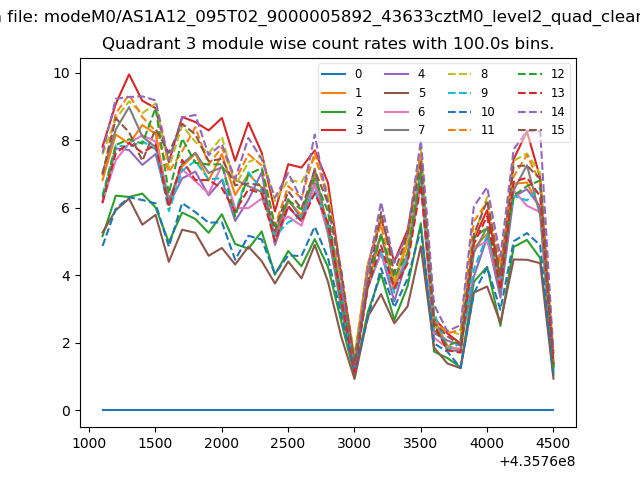
| Module-wise count rates for Quadrant A Data is divided into 100 sec bins |
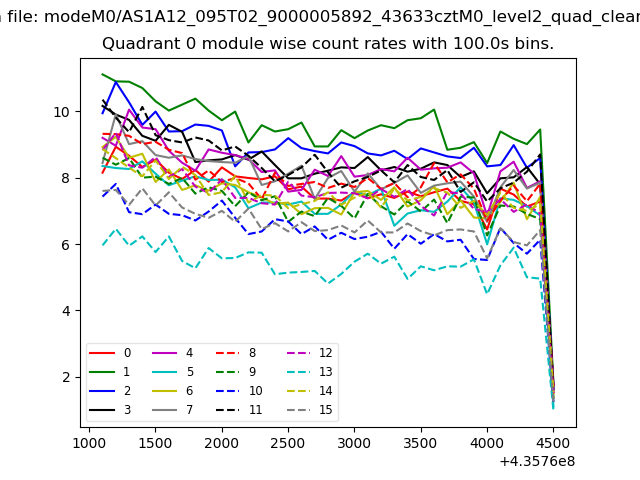 |
 |
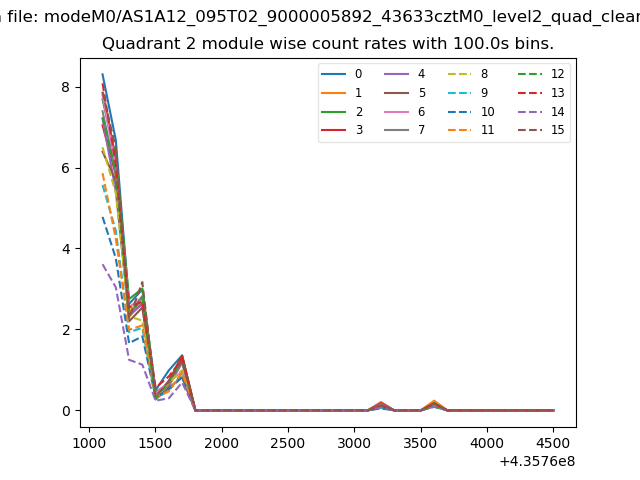
| Module-wise count rates for Quadrant B Data is divided into 100 sec bins |
 |
 |
| Module-wise count rates for Quadrant C Data is divided into 100 sec bins |
 |
 |
| Module-wise count rates for Quadrant D Data is divided into 100 sec bins |
 |
 |
| Parameter | Plot |
|---|---|
| CZT HV Monitor | 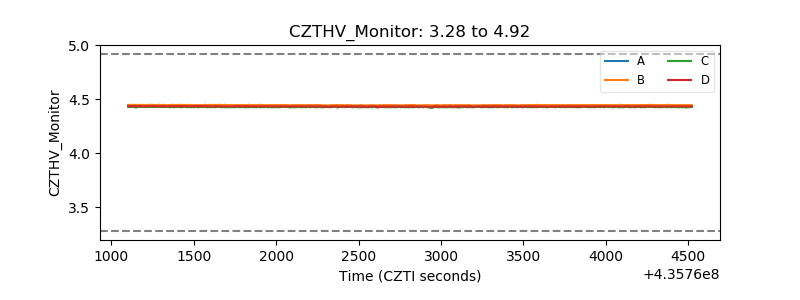 |
| D_VDD | 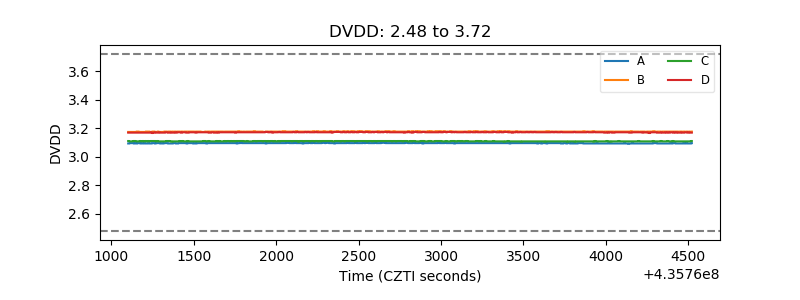 |
| Temperature 1 | 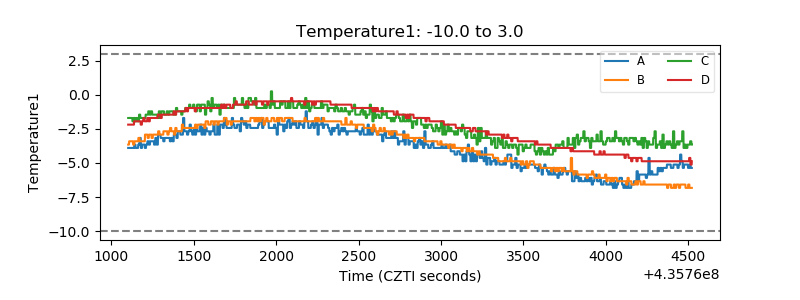 |
| Veto HV Monitor | 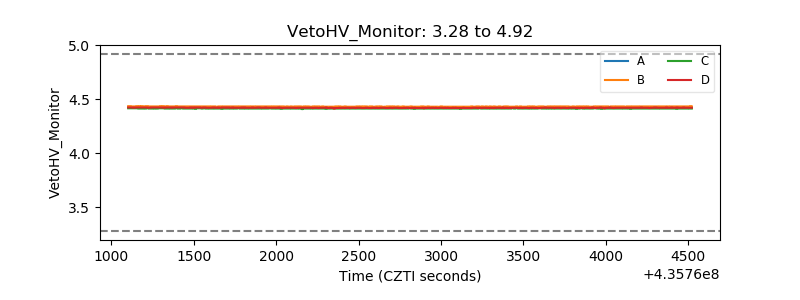 |
| Veto LLD | 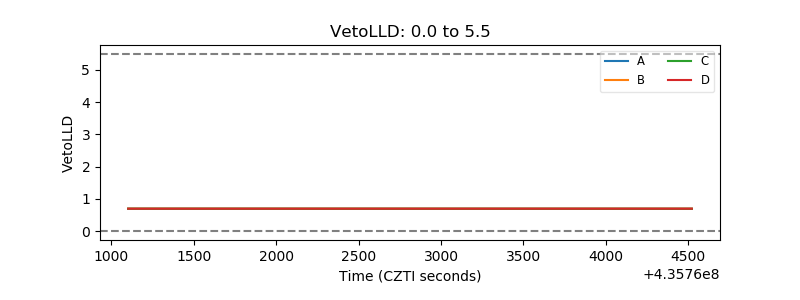 |
| Alpha Counter | 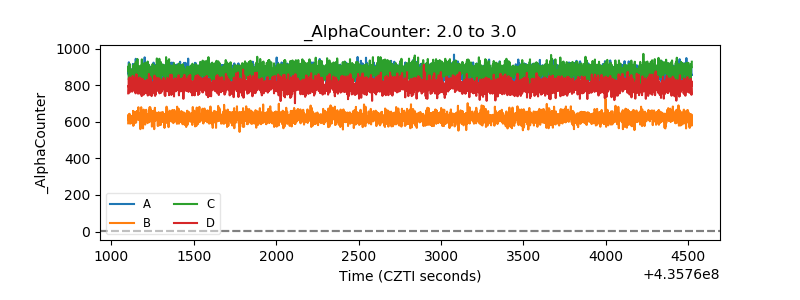 |
| _CPM_Rate | 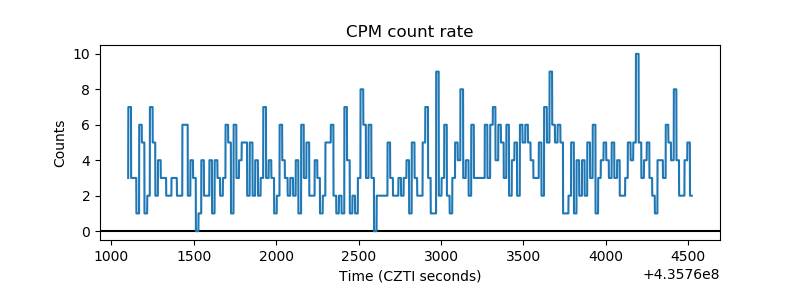 |
| CZT Counter | 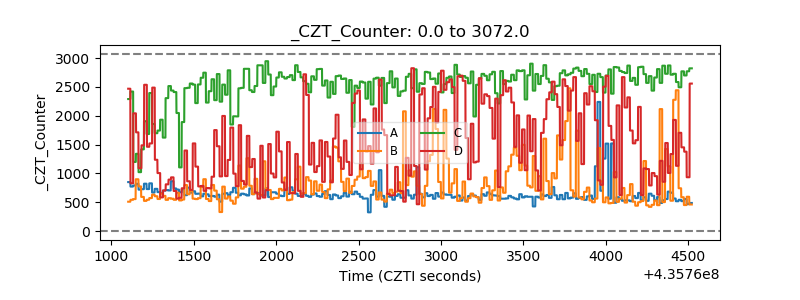 |
| +2.5 Volts monitor | 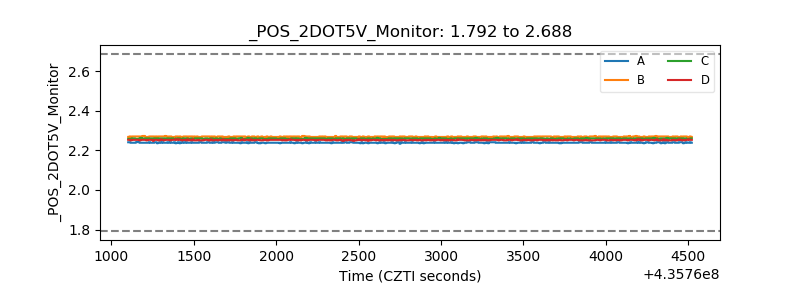 |
| +5 Volts monitor | 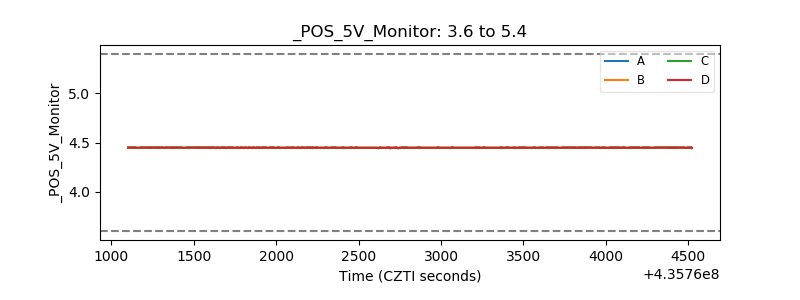 |
| _ROLL_ROT | 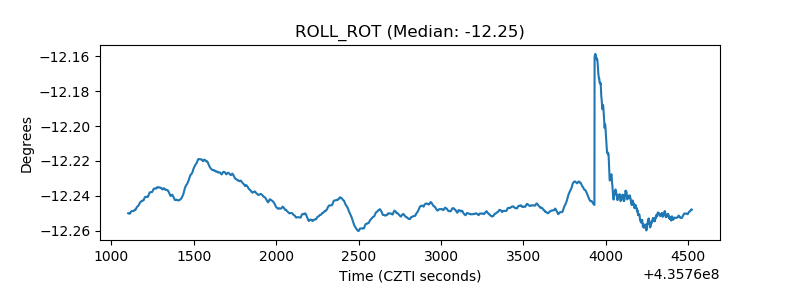 |
| _Roll_DEC | 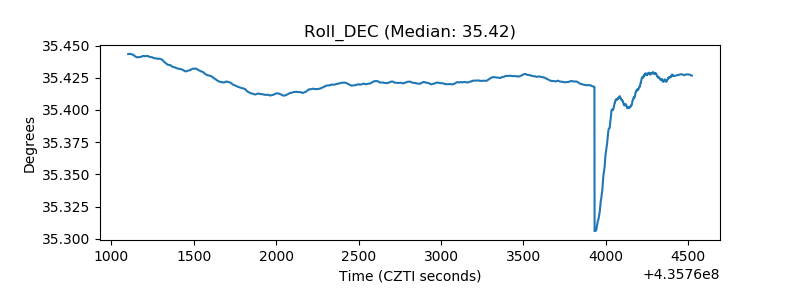 |
| _Roll_RA | 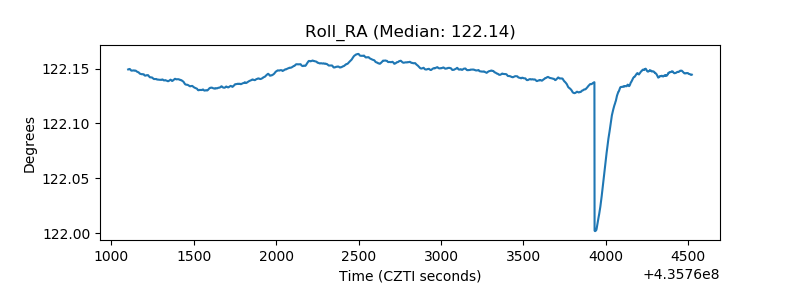 |
| Veto Counter | 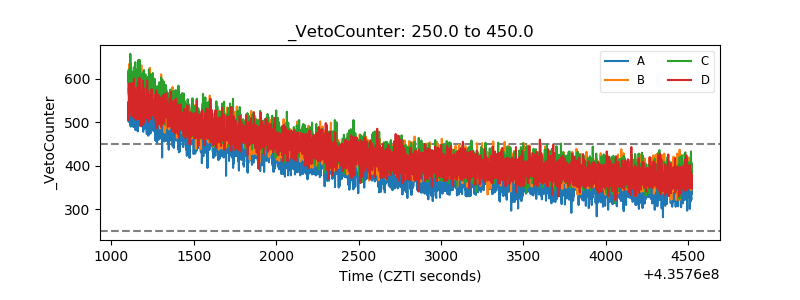 |