| Param | Original file | Final file |
|---|---|---|
| Filename | modeM0/AS1A12_068T05_9000005894_43633cztM0_level2.fits | modeM0/AS1A12_068T05_9000005894_43633cztM0_level2_quad_clean.evt |
| Size (bytes) | 361,226,880 | 34,344,000 |
| Size | 344.5 MB | 32.8 MB |
| Events in quadrant A | 1,669,198 | 307,218 |
| Events in quadrant B | 1,842,517 | 313,606 |
| Events in quadrant C | 5,834,038 | 47,934 |
| Events in quadrant D | 3,835,749 | 196,691 |
| Mode SS | |||
|---|---|---|---|
| Quadrant | BADHDUFLAG | Total packets | Discarded packets |
| A | 0 | 50 | 0 |
| B | 0 | 50 | 0 |
| C | 0 | 50 | 0 |
| D | 0 | 50 | 0 |
| Mode M9 | |||
|---|---|---|---|
| Quadrant | BADHDUFLAG | Total packets | Discarded packets |
| A | 0 | 12 | 0 |
| B | 0 | 12 | 0 |
| C | 0 | 12 | 0 |
| D | 0 | 12 | 0 |
| Mode M0 | |||
|---|---|---|---|
| Quadrant | BADHDUFLAG | Total packets | Discarded packets |
| A | 0 | 6907 | 1 |
| B | 0 | 7190 | 1 |
| C | 0 | 18974 | 6 |
| D | 0 | 13092 | 1 |
| Quadrant | Total seconds | Saturated seconds | Saturation percentage |
|---|---|---|---|
| A | 2428 | 79 | 3.253707% |
| B | 2428 | 116 | 4.777595% |
| C | 2427 | 2136 | 88.009889% |
| D | 2427 | 888 | 36.588381% |
Noise dominated data is calculated using 1-second bins in cleaned event files. If a bin has >2000 counts, and if more than 50% of those come from <1% of pixels, then it is considered to be noise-dominated and hence unusable.
| Quadrant | # 1 sec bins | Bins with >0 counts | Bins with >2000 counts | High rate bins dominated by noise | Noise dominated (total time) | Noise dominated (detector-on time) | Marked lightcurve |
|---|---|---|---|---|---|---|---|
| A | 3638 | 2429 | 3 | 3 | 0.08% | 0.12% | 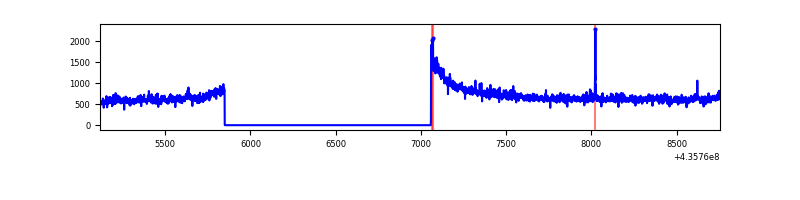 |
| B | 3638 | 2428 | 26 | 26 | 0.71% | 1.07% | 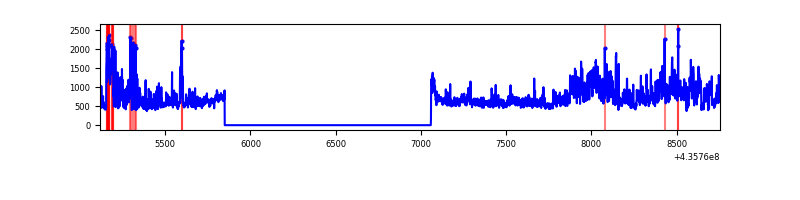 |
| C | 3637 | 2427 | 2081 | 2081 | 57.22% | 85.74% | 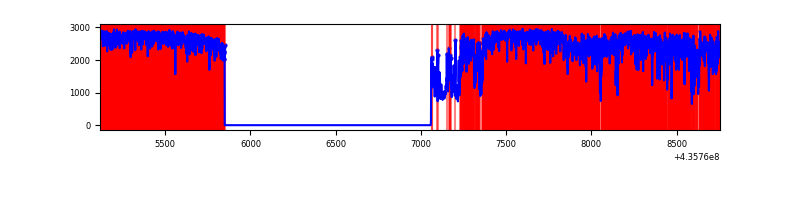 |
| D | 3637 | 2427 | 773 | 773 | 21.25% | 31.85% | 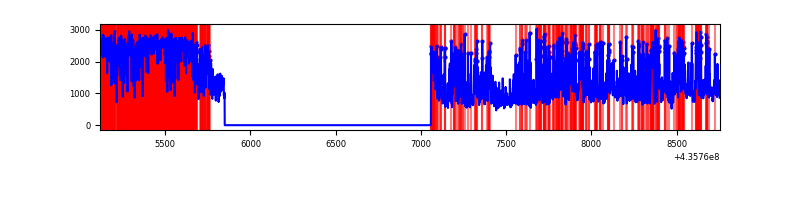 |
Top three noisy pixels from each quadrant. If the there are fewer than three noisy pixels in the level2.evt file, extra rows are filled as -1
| Pixel properties | Quadrant properties | ||||||
|---|---|---|---|---|---|---|---|
| Quadrant | DetID | PixID | Counts | Sigma | Mean | Median | Sigma |
| A | 10 | 83 | 366638 | 5712.9 | 307 | 301 | 64.1 |
| A | 8 | 4 | 34967 | 540.6 | 307 | 301 | 64.1 |
| A | 15 | 223 | 24832 | 382.55 | 307 | 301 | 64.1 |
| B | 4 | 206 | 418577 | 7080.27 | 302 | 293 | 59.1 |
| B | 5 | 235 | 110352 | 1862.96 | 302 | 293 | 59.1 |
| B | 12 | 32 | 59014 | 993.97 | 302 | 293 | 59.1 |
| C | 15 | 142 | 4016450 | 111855.43 | 150 | 151 | 35.9 |
| C | 15 | 174 | 355755 | 9903.7 | 150 | 151 | 35.9 |
| C | 15 | 157 | 351261 | 9778.54 | 150 | 151 | 35.9 |
| D | 4 | 216 | 752794 | 10951.11 | 266 | 258 | 68.7 |
| D | 12 | 6 | 410768 | 5973.85 | 266 | 258 | 68.7 |
| D | 8 | 192 | 227278 | 3303.66 | 266 | 258 | 68.7 |
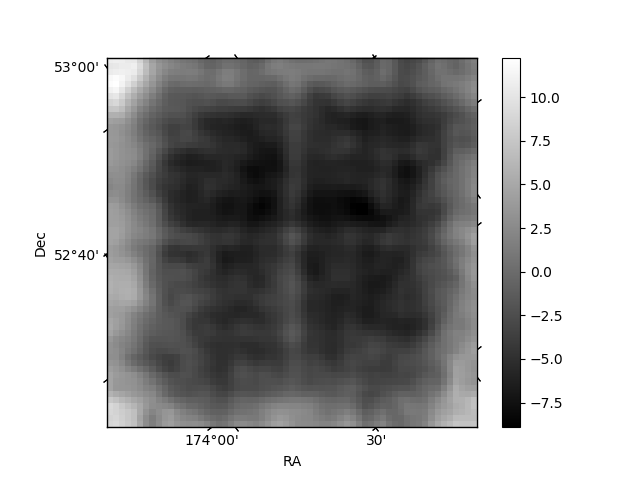
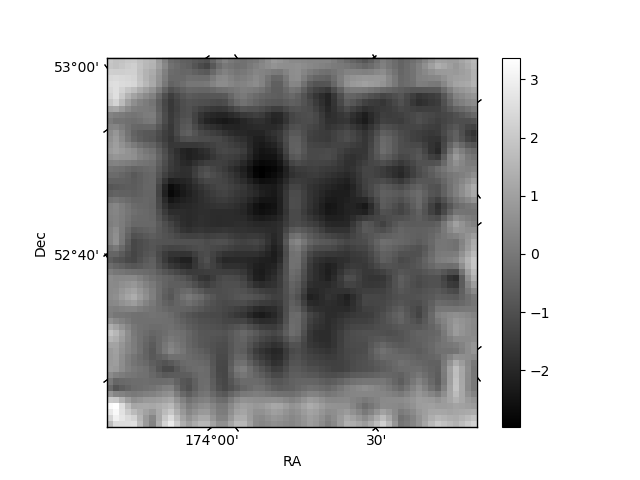
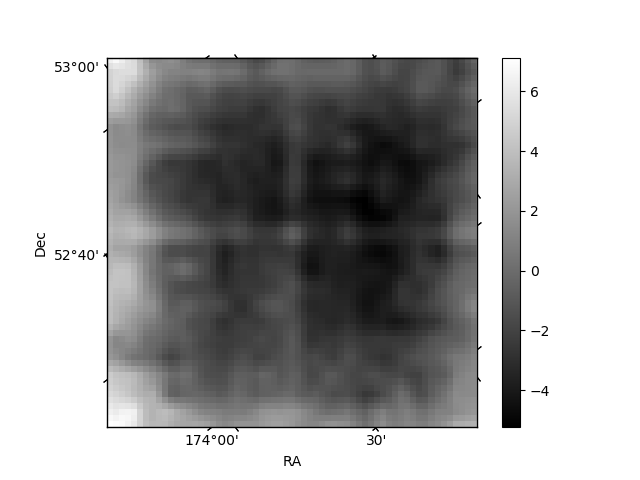
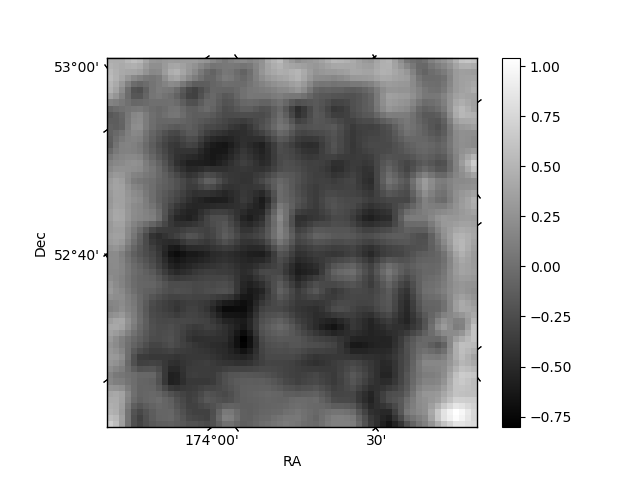
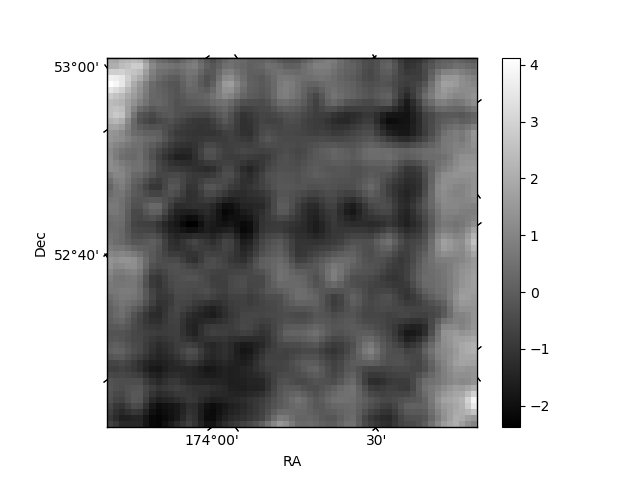
Histogram calculated using DETX and DETY for each event in the final _common_clean file
| Quadrant A | 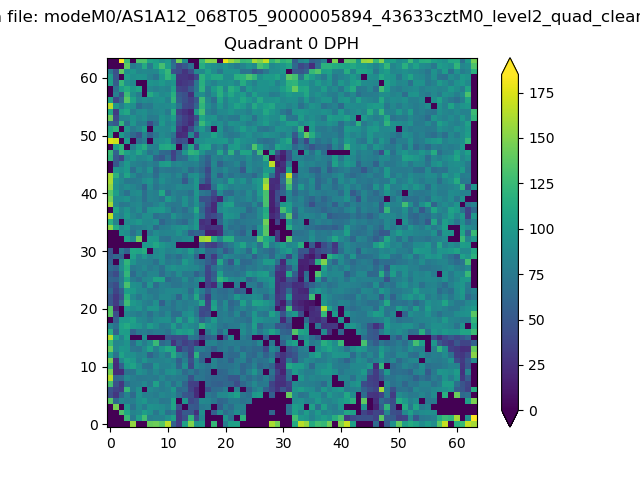 |
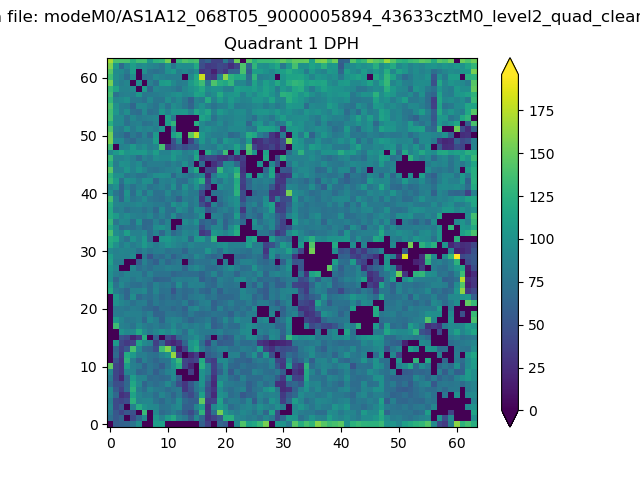 |
Quadrant B |
|---|---|---|---|
| Quadrant D | 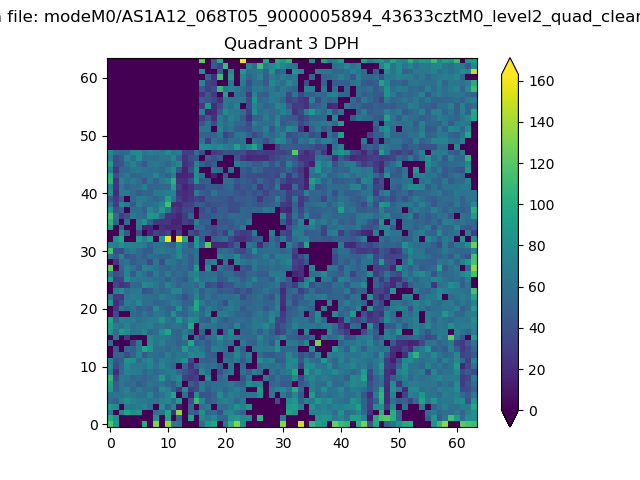 |
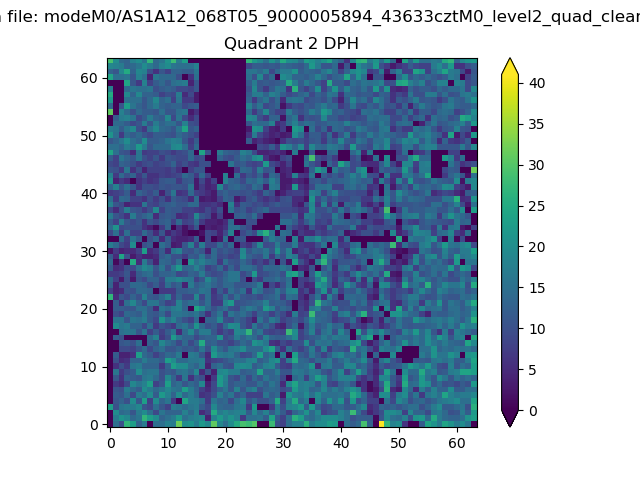 |
Quadrant C |
| Plot type | Count rate plots | Images |
|---|---|---|
| Comparison with Poisson distribution Blue bars denote a histogram of data divided into 1 sec bins. Red curve is a Poisson curve with rate = median count rate of data. |
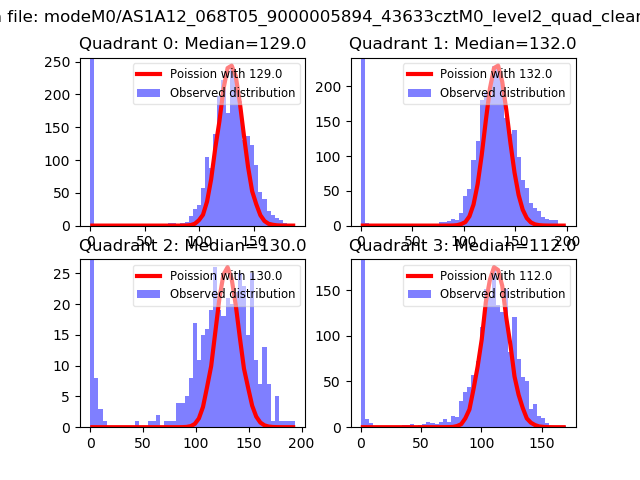 |
 |
| Quadrant-wise count rates Data is divided into 100 sec bins |
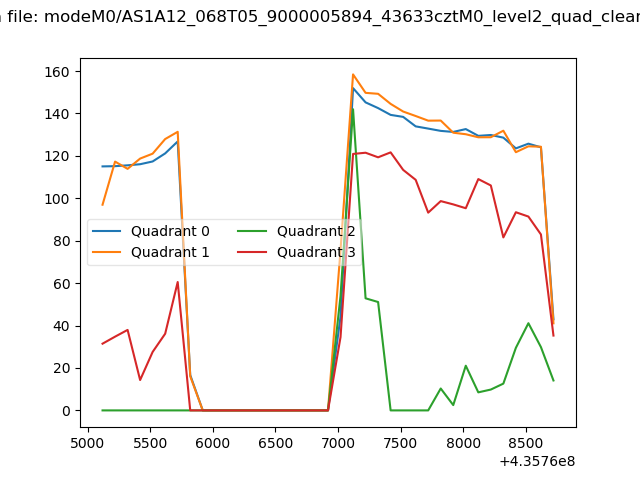 |
|
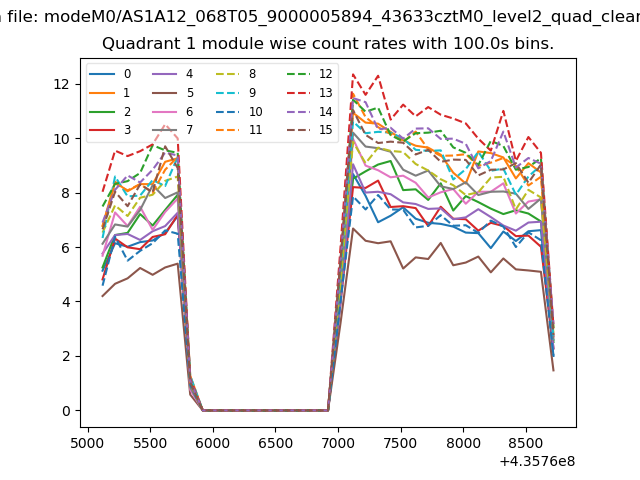
| Module-wise count rates for Quadrant A Data is divided into 100 sec bins |
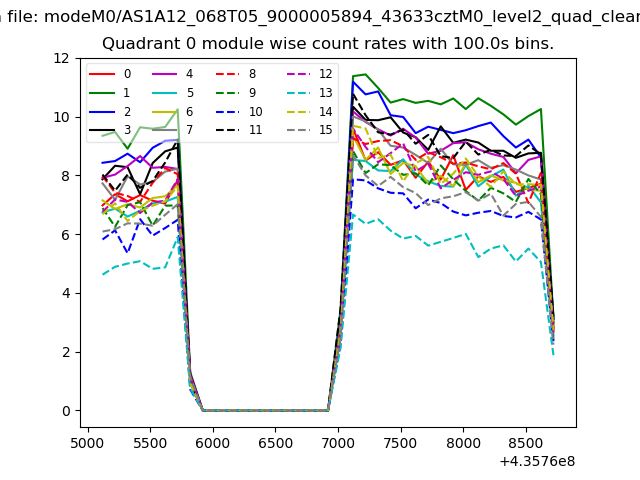 |
 |
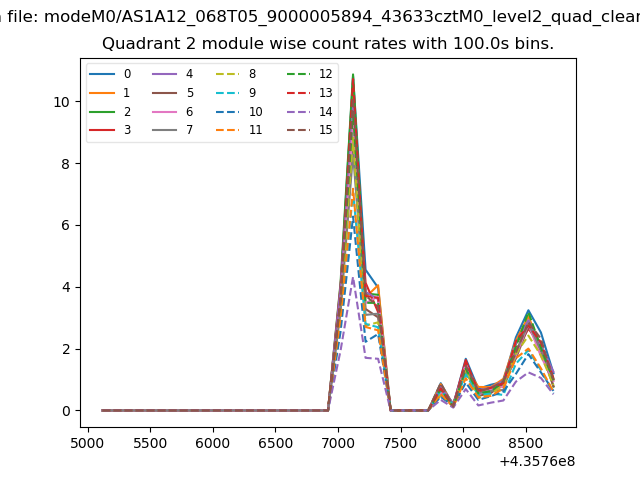
| Module-wise count rates for Quadrant B Data is divided into 100 sec bins |
 |
 |
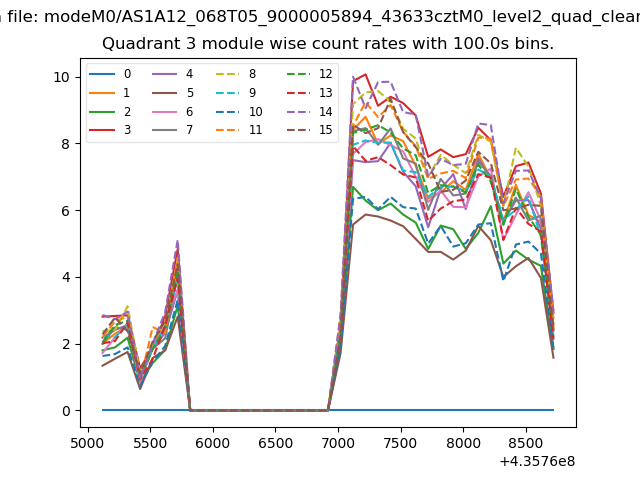
| Module-wise count rates for Quadrant C Data is divided into 100 sec bins |
 |
 |
| Module-wise count rates for Quadrant D Data is divided into 100 sec bins |
 |
 |
| Parameter | Plot |
|---|---|
| CZT HV Monitor | 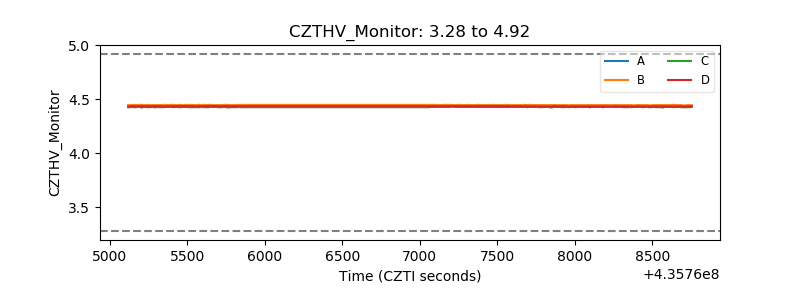 |
| D_VDD | 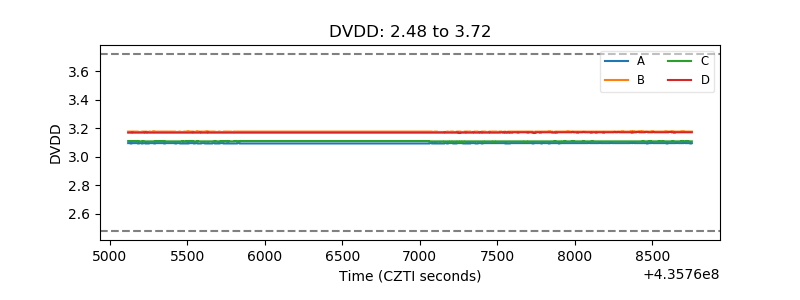 |
| Temperature 1 | 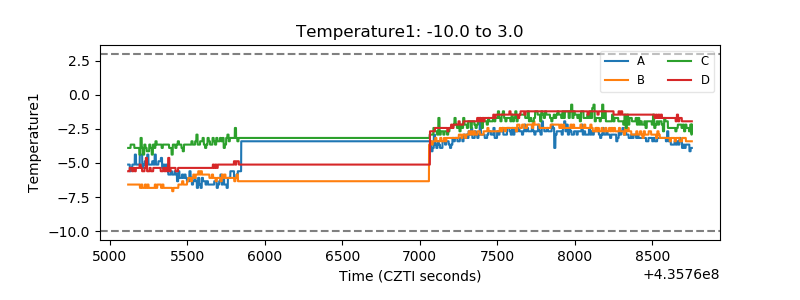 |
| Veto HV Monitor |  |
| Veto LLD | 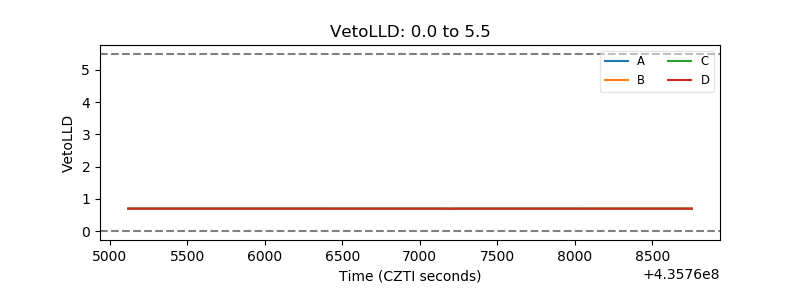 |
| Alpha Counter | 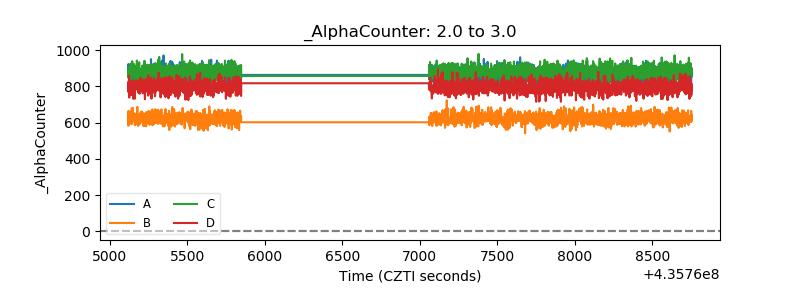 |
| _CPM_Rate | 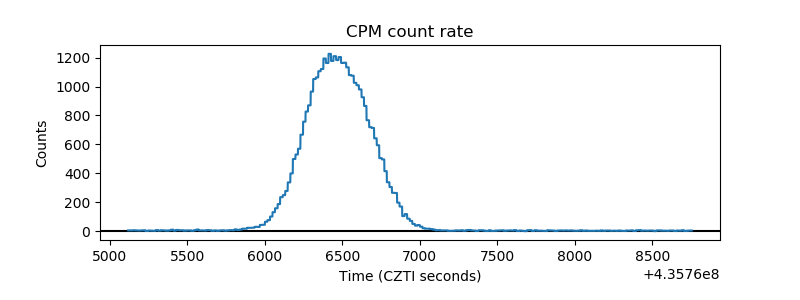 |
| CZT Counter | 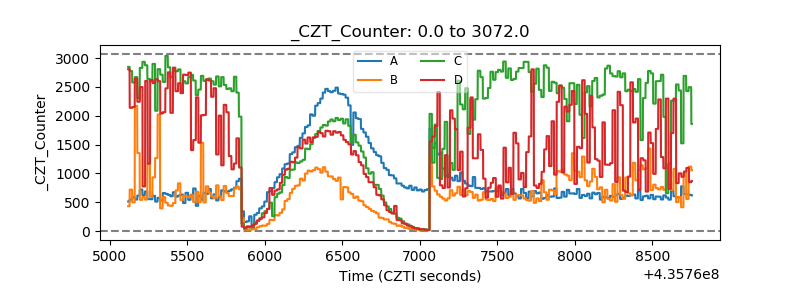 |
| +2.5 Volts monitor | 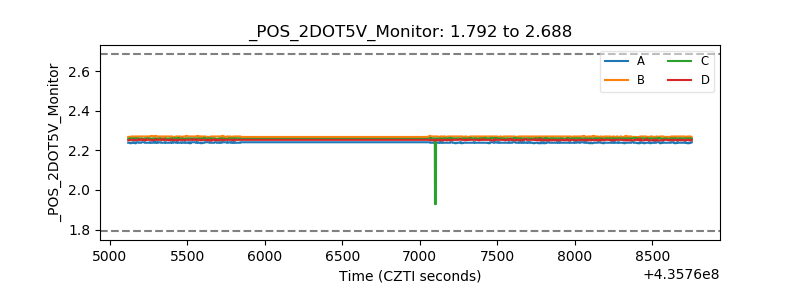 |
| +5 Volts monitor | 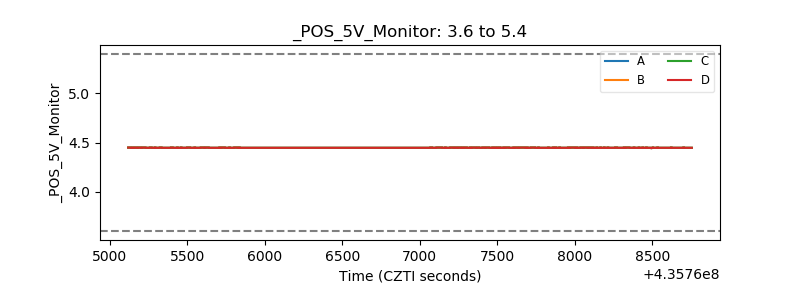 |
| _ROLL_ROT | 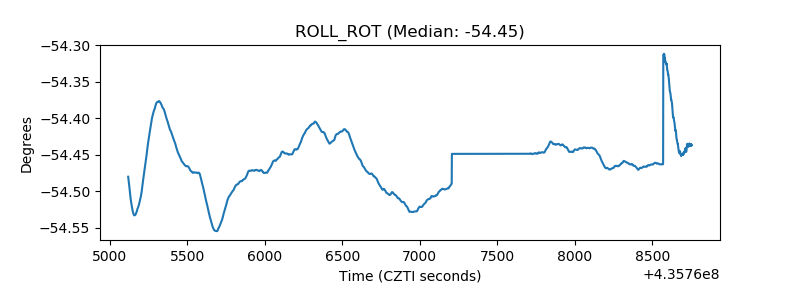 |
| _Roll_DEC | 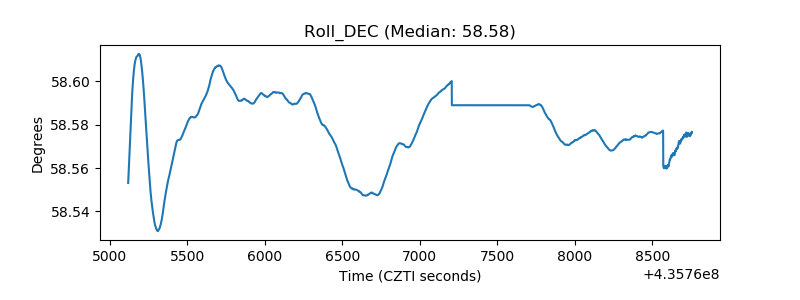 |
| _Roll_RA | 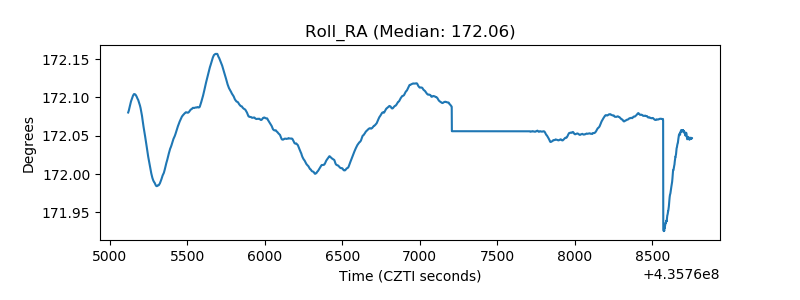 |
| Veto Counter | 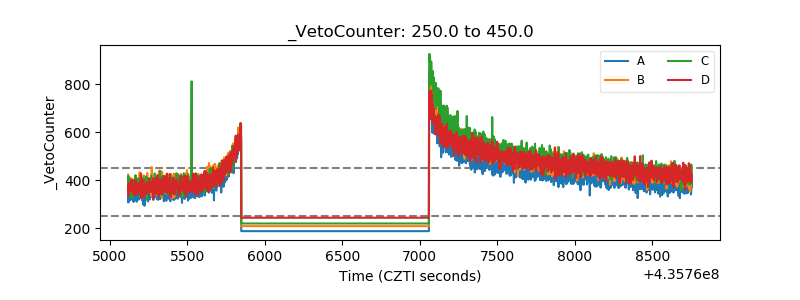 |