| Param | Original file | Final file |
|---|---|---|
| Filename | modeM0/AS1A12_068T05_9000005894_43637cztM0_level2.fits | modeM0/AS1A12_068T05_9000005894_43637cztM0_level2_quad_clean.evt |
| Size (bytes) | 1,052,340,480 | 103,754,880 |
| Size | 1003.6 MB | 98.9 MB |
| Events in quadrant A | 5,202,538 | 794,271 |
| Events in quadrant B | 6,701,846 | 775,750 |
| Events in quadrant C | 17,820,130 | 399,407 |
| Events in quadrant D | 8,671,232 | 664,701 |
| Mode SS | |||
|---|---|---|---|
| Quadrant | BADHDUFLAG | Total packets | Discarded packets |
| A | 0 | 146 | 0 |
| B | 0 | 146 | 0 |
| C | 0 | 146 | 0 |
| D | 0 | 146 | 0 |
| Mode M9 | |||
|---|---|---|---|
| Quadrant | BADHDUFLAG | Total packets | Discarded packets |
| A | 0 | 2 | 0 |
| B | 0 | 2 | 0 |
| C | 0 | 2 | 0 |
| D | 0 | 2 | 0 |
| Mode M0 | |||
|---|---|---|---|
| Quadrant | BADHDUFLAG | Total packets | Discarded packets |
| A | 0 | 20448 | 1 |
| B | 0 | 25073 | 1 |
| C | 0 | 57916 | 1 |
| D | 0 | 30911 | 2 |
| Quadrant | Total seconds | Saturated seconds | Saturation percentage |
|---|---|---|---|
| A | 7226 | 325 | 4.497647% |
| B | 7227 | 1032 | 14.279784% |
| C | 7227 | 6794 | 94.008579% |
| D | 7226 | 1287 | 17.810684% |
Noise dominated data is calculated using 1-second bins in cleaned event files. If a bin has >2000 counts, and if more than 50% of those come from <1% of pixels, then it is considered to be noise-dominated and hence unusable.
| Quadrant | # 1 sec bins | Bins with >0 counts | Bins with >2000 counts | High rate bins dominated by noise | Noise dominated (total time) | Noise dominated (detector-on time) | Marked lightcurve |
|---|---|---|---|---|---|---|---|
| A | 7475 | 7226 | 184 | 184 | 2.46% | 2.55% | 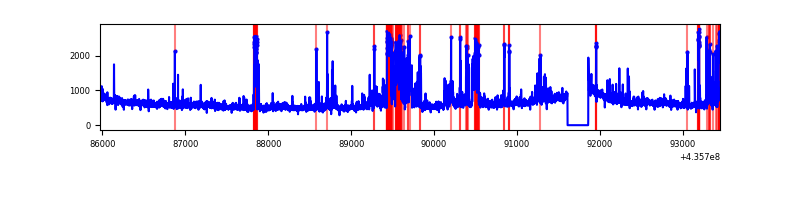 |
| B | 7477 | 7227 | 518 | 518 | 6.93% | 7.17% | 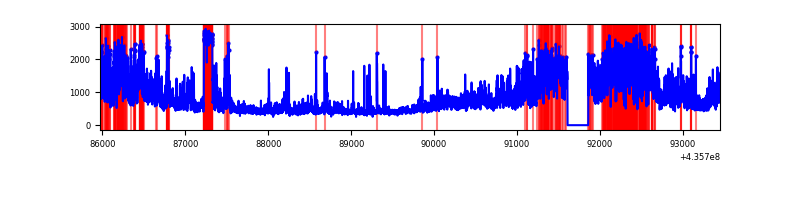 |
| C | 7476 | 7226 | 6524 | 6524 | 87.27% | 90.29% |  |
| D | 7476 | 7226 | 915 | 915 | 12.24% | 12.66% | 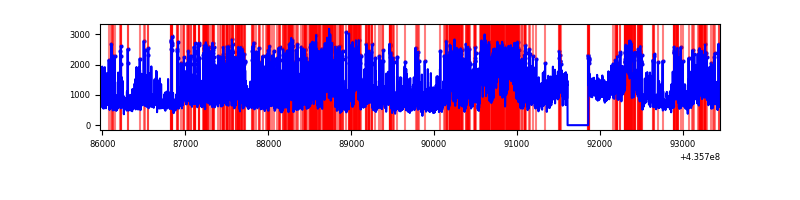 |
Top three noisy pixels from each quadrant. If the there are fewer than three noisy pixels in the level2.evt file, extra rows are filled as -1
| Pixel properties | Quadrant properties | ||||||
|---|---|---|---|---|---|---|---|
| Quadrant | DetID | PixID | Counts | Sigma | Mean | Median | Sigma |
| A | 15 | 223 | 908590 | 5449.12 | 807 | 789 | 166.6 |
| A | 10 | 83 | 809681 | 4855.42 | 807 | 789 | 166.6 |
| A | 15 | 222 | 140605 | 839.25 | 807 | 789 | 166.6 |
| B | 4 | 206 | 2482112 | 16628.11 | 772 | 750 | 149.2 |
| B | 5 | 235 | 738371 | 4942.95 | 772 | 750 | 149.2 |
| B | 0 | 200 | 96055 | 638.66 | 772 | 750 | 149.2 |
| C | 15 | 142 | 10642447 | 108954.36 | 415 | 417 | 97.7 |
| C | 3 | 233 | 2882609 | 29508.22 | 415 | 417 | 97.7 |
| C | 15 | 157 | 1564391 | 16012.15 | 415 | 417 | 97.7 |
| D | 13 | 249 | 514827 | 2599.73 | 757 | 731 | 197.7 |
| D | 4 | 212 | 513666 | 2593.86 | 757 | 731 | 197.7 |
| D | 4 | 221 | 511840 | 2584.63 | 757 | 731 | 197.7 |
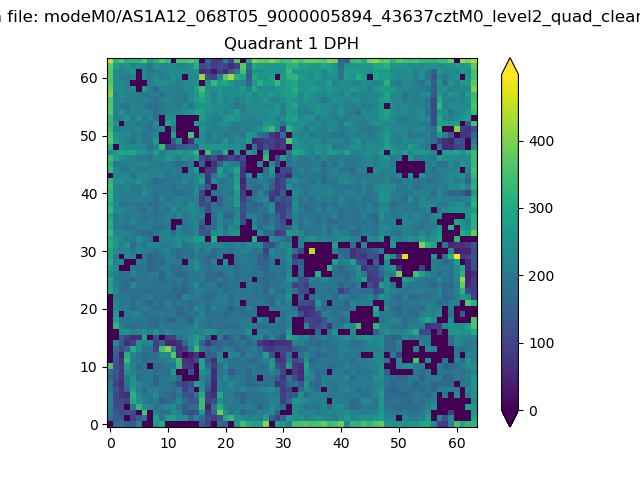
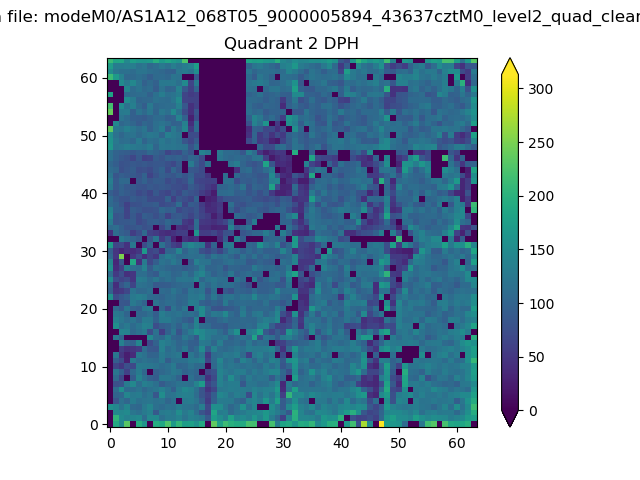
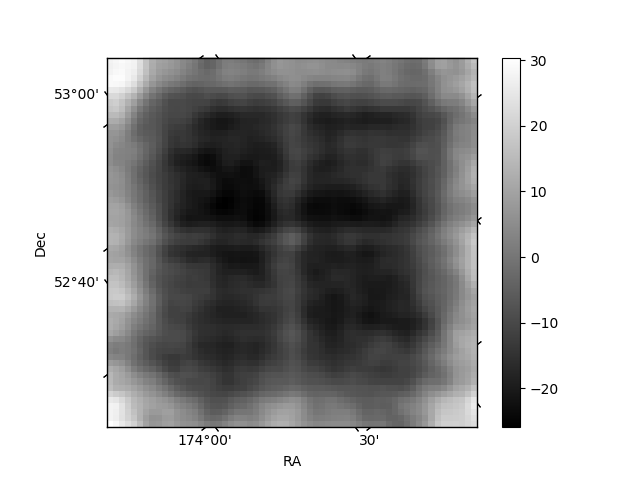
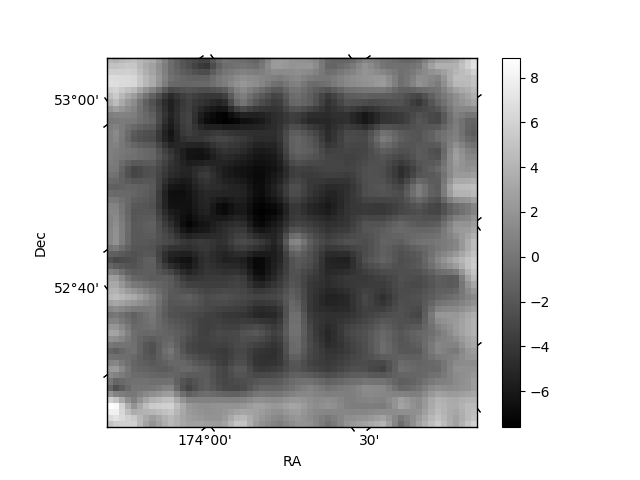
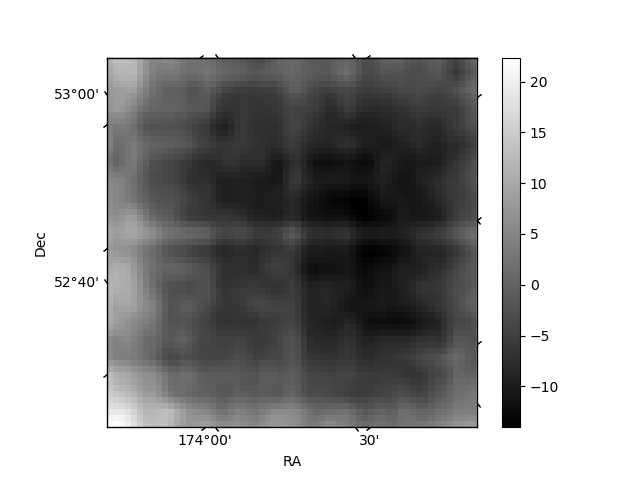
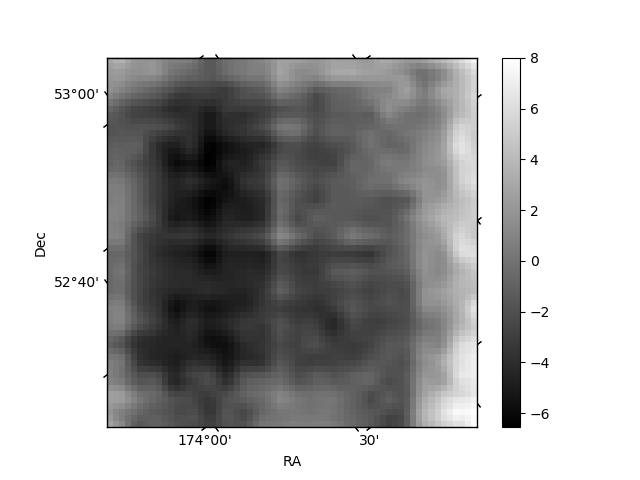
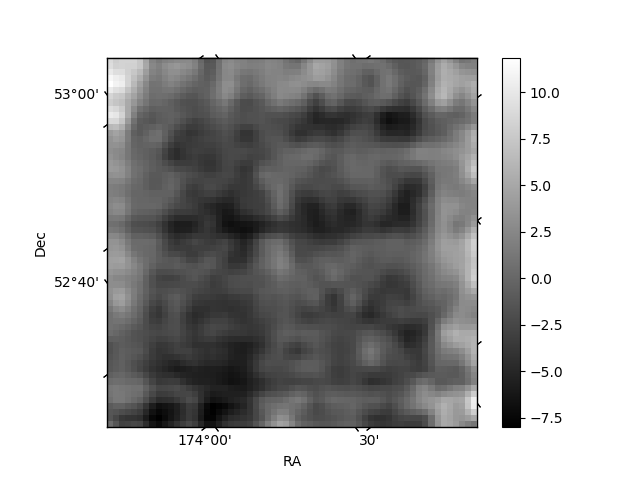
Histogram calculated using DETX and DETY for each event in the final _common_clean file
| Quadrant A | 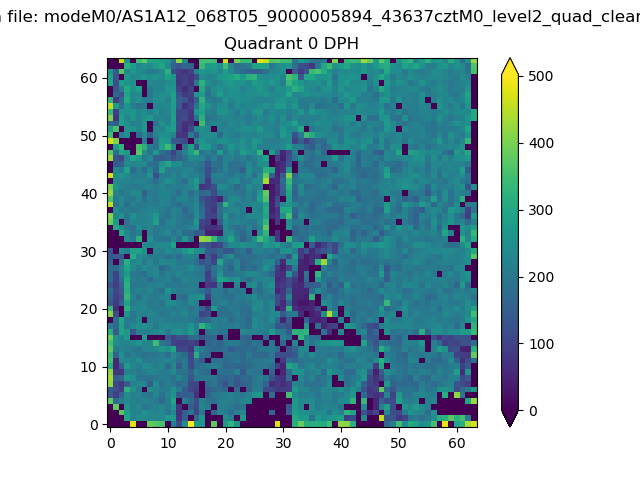 |
 |
Quadrant B |
|---|---|---|---|
| Quadrant D | 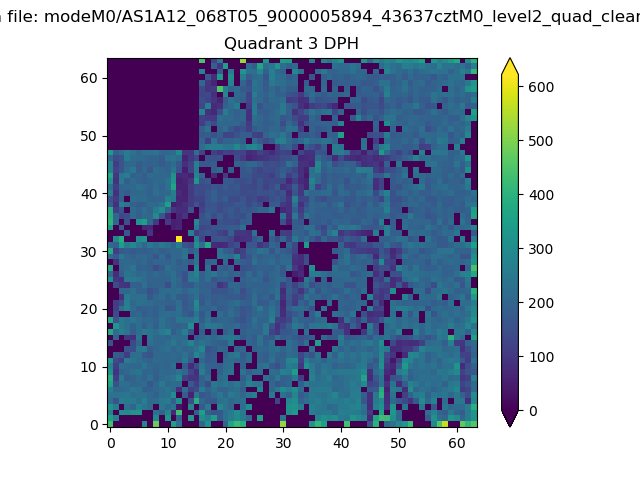 |
 |
Quadrant C |
| Plot type | Count rate plots | Images |
|---|---|---|
| Comparison with Poisson distribution Blue bars denote a histogram of data divided into 1 sec bins. Red curve is a Poisson curve with rate = median count rate of data. |
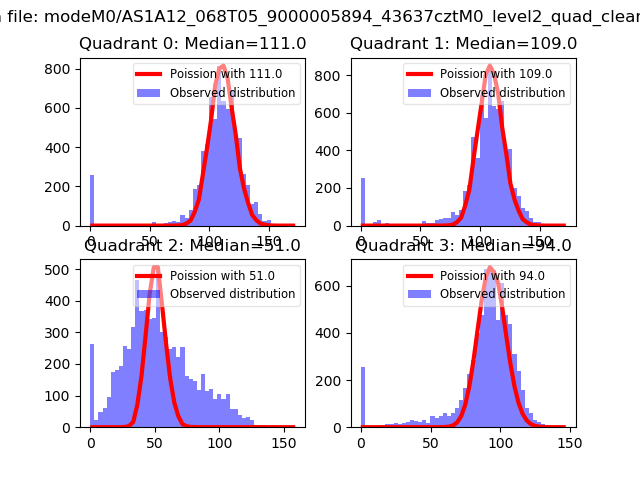 |
 |
| Quadrant-wise count rates Data is divided into 100 sec bins |
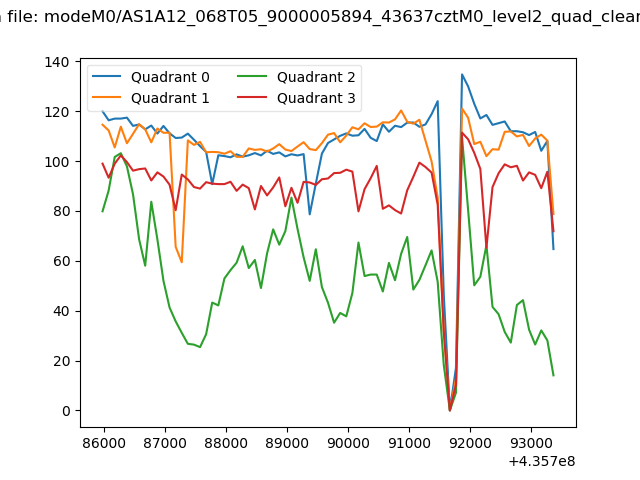 |
|
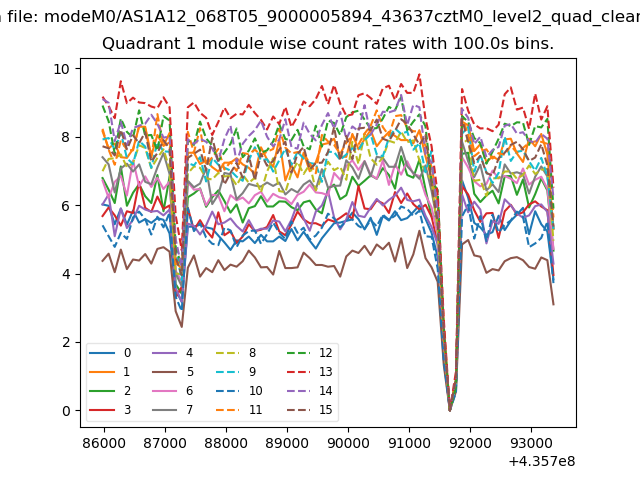
| Module-wise count rates for Quadrant A Data is divided into 100 sec bins |
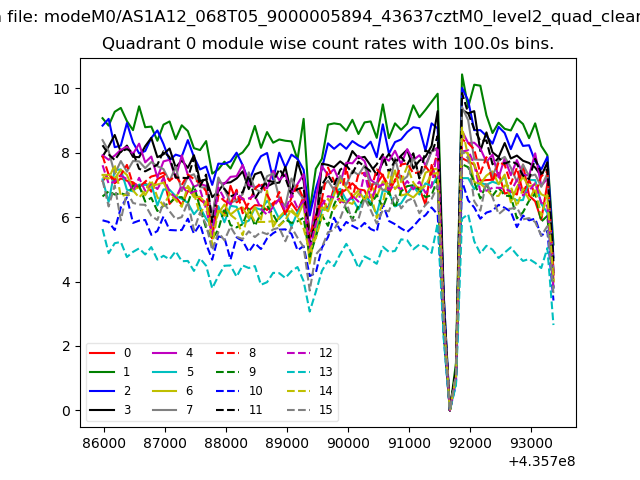 |
 |
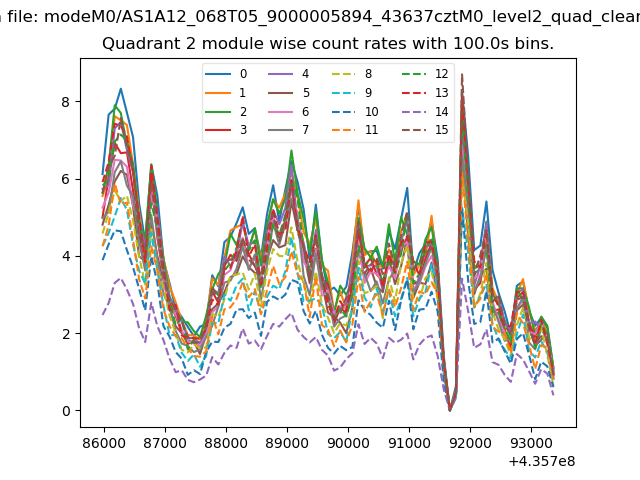
| Module-wise count rates for Quadrant B Data is divided into 100 sec bins |
 |
 |
| Module-wise count rates for Quadrant C Data is divided into 100 sec bins |
 |
 |
| Module-wise count rates for Quadrant D Data is divided into 100 sec bins |
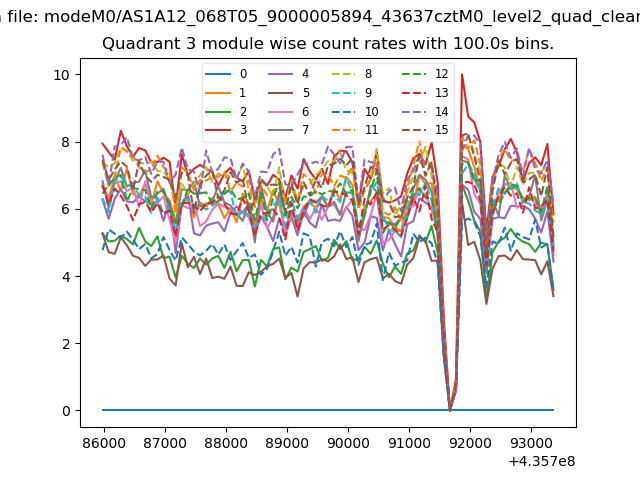 |
 |
| Parameter | Plot |
|---|---|
| CZT HV Monitor | 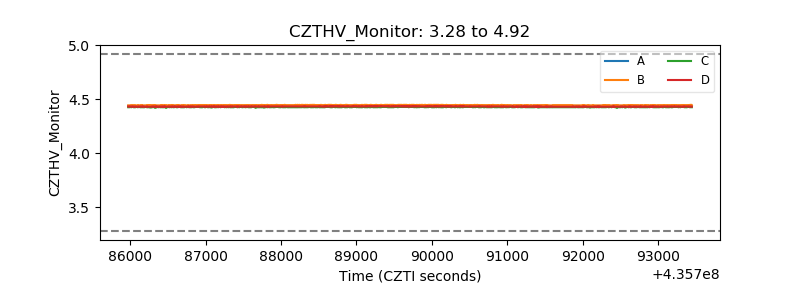 |
| D_VDD | 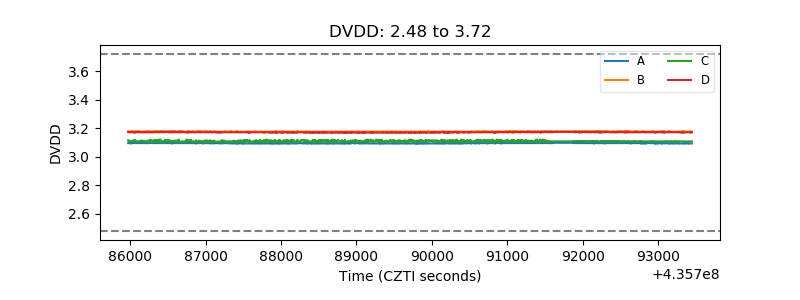 |
| Temperature 1 | 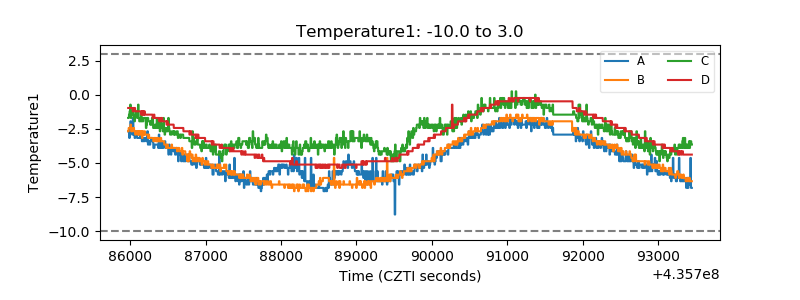 |
| Veto HV Monitor | 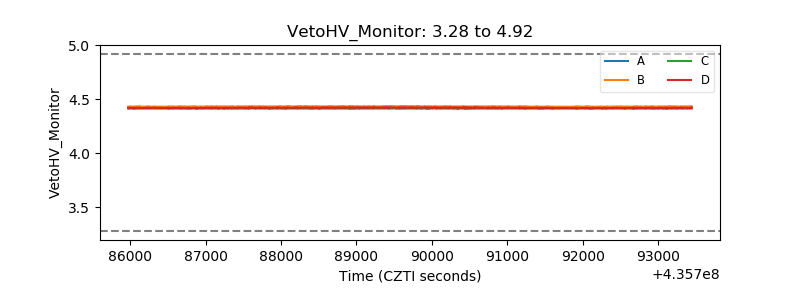 |
| Veto LLD | 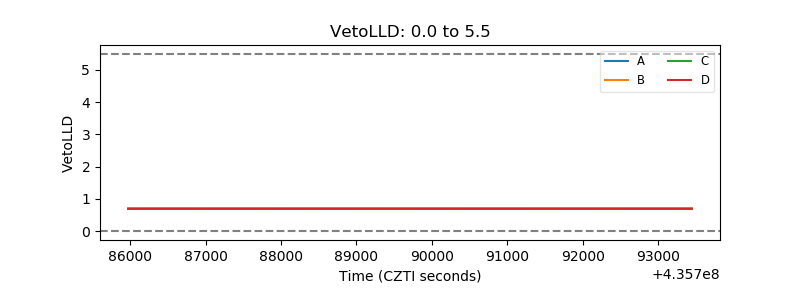 |
| Alpha Counter | 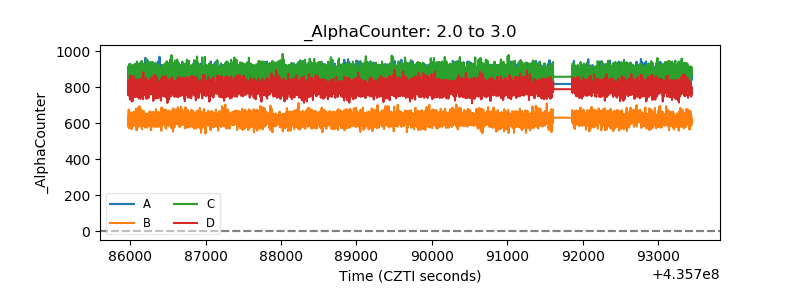 |
| _CPM_Rate | 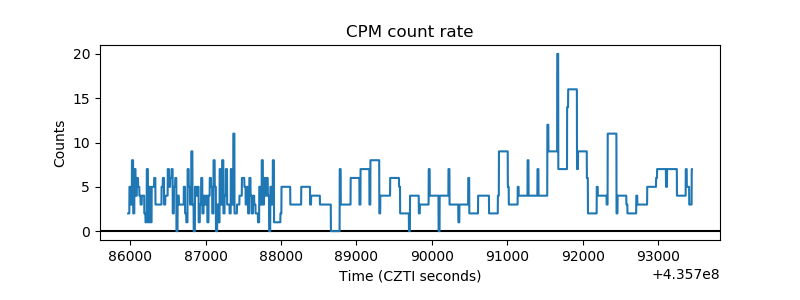 |
| CZT Counter | 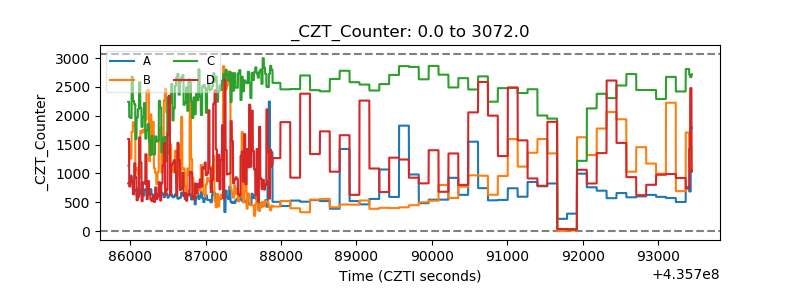 |
| +2.5 Volts monitor | 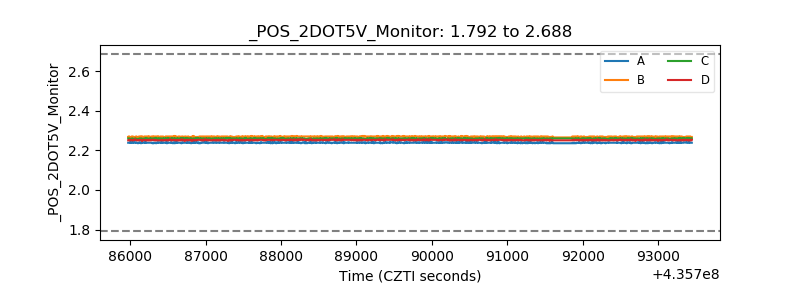 |
| +5 Volts monitor | 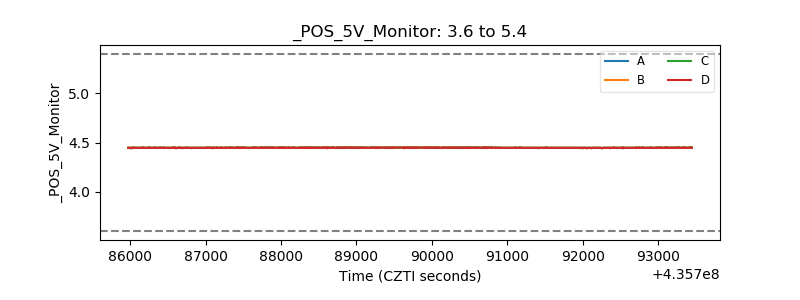 |
| _ROLL_ROT | 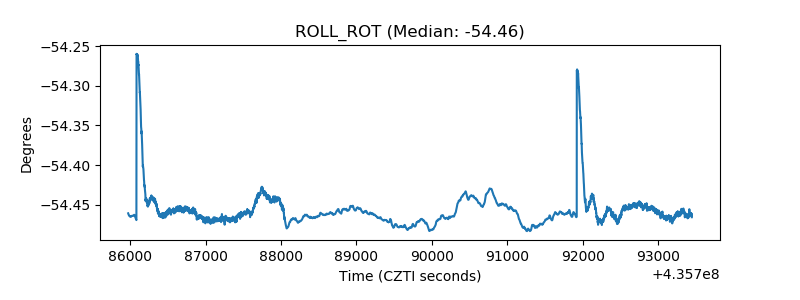 |
| _Roll_DEC |  |
| _Roll_RA | 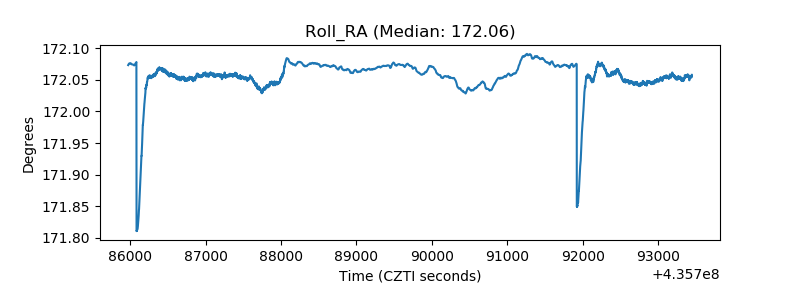 |
| Veto Counter | 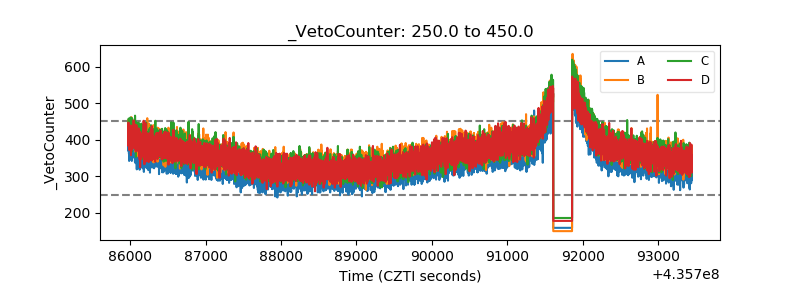 |