| Param | Original file | Final file |
|---|---|---|
| Filename | modeM0/AS1A12_068T05_9000005894_43638cztM0_level2.fits | modeM0/AS1A12_068T05_9000005894_43638cztM0_level2_quad_clean.evt |
| Size (bytes) | 1,230,059,520 | 114,310,080 |
| Size | 1.1 GB | 109.0 MB |
| Events in quadrant A | 5,785,759 | 889,021 |
| Events in quadrant B | 8,626,417 | 862,111 |
| Events in quadrant C | 19,863,453 | 420,040 |
| Events in quadrant D | 10,634,362 | 723,444 |
| Mode SS | |||
|---|---|---|---|
| Quadrant | BADHDUFLAG | Total packets | Discarded packets |
| A | 0 | 162 | 0 |
| B | 0 | 162 | 0 |
| C | 0 | 162 | 0 |
| D | 0 | 162 | 0 |
| Mode M0 | |||
|---|---|---|---|
| Quadrant | BADHDUFLAG | Total packets | Discarded packets |
| A | 0 | 23029 | 1 |
| B | 0 | 31338 | 1 |
| C | 0 | 64578 | 1 |
| D | 0 | 37299 | 1 |
| Quadrant | Total seconds | Saturated seconds | Saturation percentage |
|---|---|---|---|
| A | 8074 | 220 | 2.724796% |
| B | 8075 | 1389 | 17.201238% |
| C | 8075 | 7452 | 92.284830% |
| D | 8074 | 1863 | 23.074065% |
Noise dominated data is calculated using 1-second bins in cleaned event files. If a bin has >2000 counts, and if more than 50% of those come from <1% of pixels, then it is considered to be noise-dominated and hence unusable.
| Quadrant | # 1 sec bins | Bins with >0 counts | Bins with >2000 counts | High rate bins dominated by noise | Noise dominated (total time) | Noise dominated (detector-on time) | Marked lightcurve |
|---|---|---|---|---|---|---|---|
| A | 8074 | 8074 | 128 | 128 | 1.59% | 1.59% | 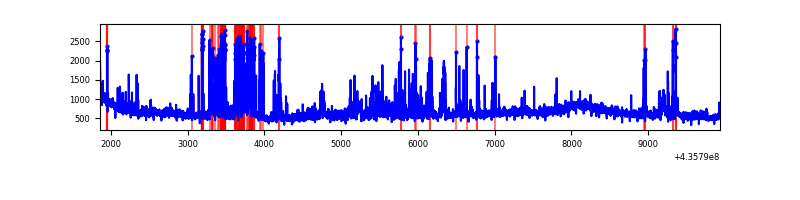 |
| B | 8075 | 8075 | 720 | 720 | 8.92% | 8.92% | 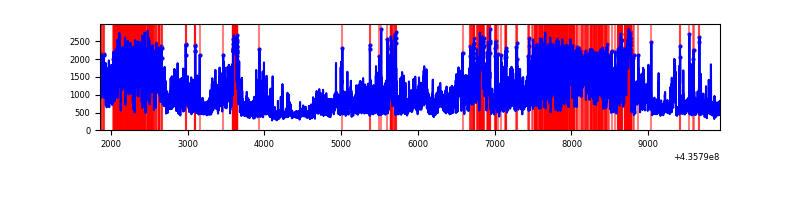 |
| C | 8074 | 8074 | 7088 | 7088 | 87.79% | 87.79% | 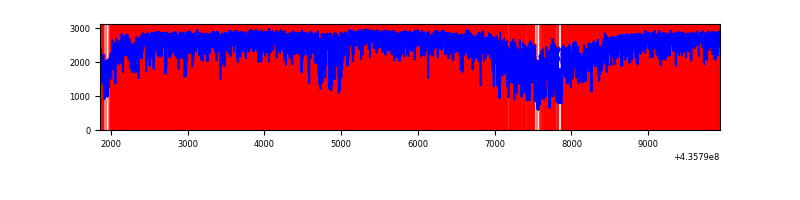 |
| D | 8074 | 8074 | 1216 | 1216 | 15.06% | 15.06% | 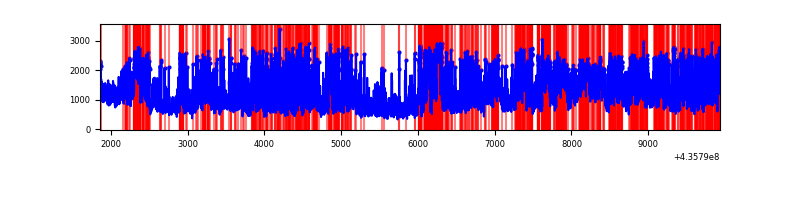 |
Top three noisy pixels from each quadrant. If the there are fewer than three noisy pixels in the level2.evt file, extra rows are filled as -1
| Pixel properties | Quadrant properties | ||||||
|---|---|---|---|---|---|---|---|
| Quadrant | DetID | PixID | Counts | Sigma | Mean | Median | Sigma |
| A | 10 | 83 | 917283 | 4935.06 | 911 | 891 | 185.7 |
| A | 15 | 223 | 754467 | 4058.24 | 911 | 891 | 185.7 |
| A | 15 | 222 | 158393 | 848.2 | 911 | 891 | 185.7 |
| B | 4 | 206 | 3920752 | 23646.18 | 866 | 840 | 165.8 |
| B | 5 | 235 | 1012017 | 6099.75 | 866 | 840 | 165.8 |
| B | 0 | 200 | 54586 | 324.21 | 866 | 840 | 165.8 |
| C | 15 | 142 | 10776832 | 102327.07 | 448 | 450 | 105.3 |
| C | 15 | 174 | 3160108 | 30002.51 | 448 | 450 | 105.3 |
| C | 3 | 233 | 2486328 | 23604.64 | 448 | 450 | 105.3 |
| D | 4 | 221 | 1764108 | 8355.04 | 828 | 800 | 211.0 |
| D | 4 | 216 | 772603 | 3657.01 | 828 | 800 | 211.0 |
| D | 1 | 52 | 556574 | 2633.41 | 828 | 800 | 211.0 |
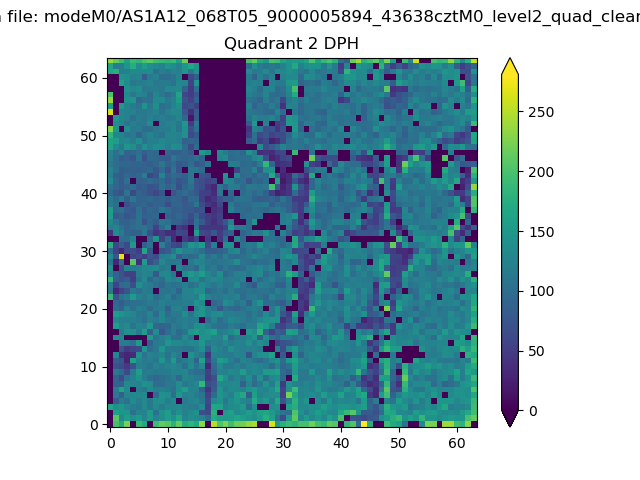
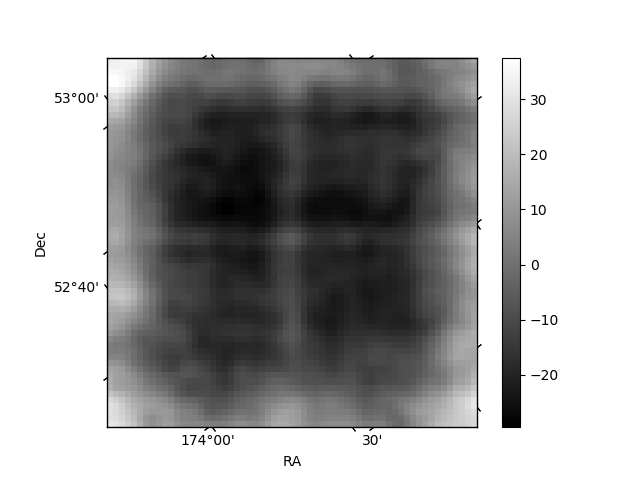
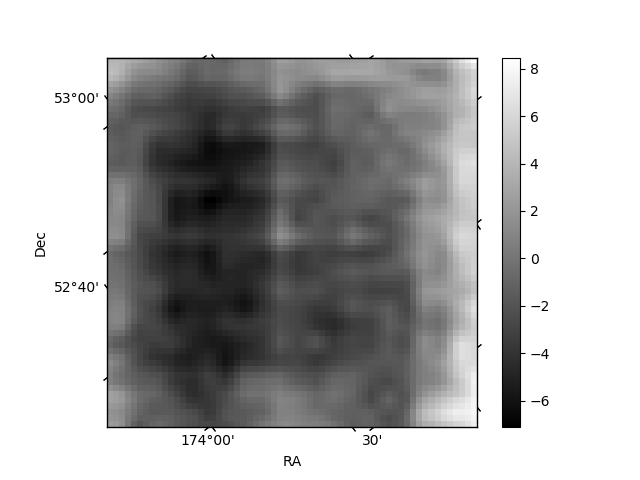
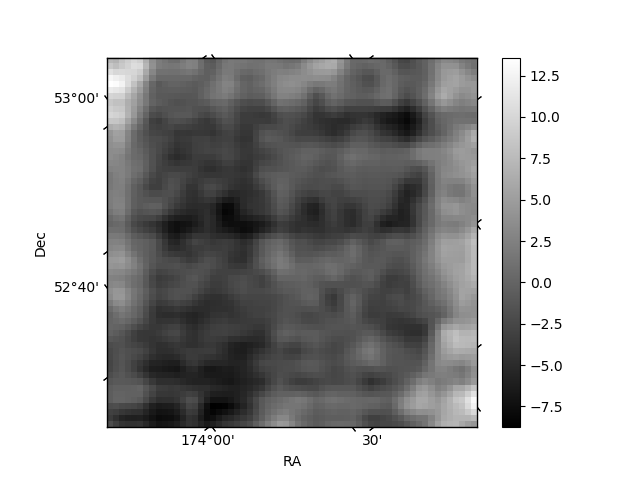
Histogram calculated using DETX and DETY for each event in the final _common_clean file
| Quadrant A | 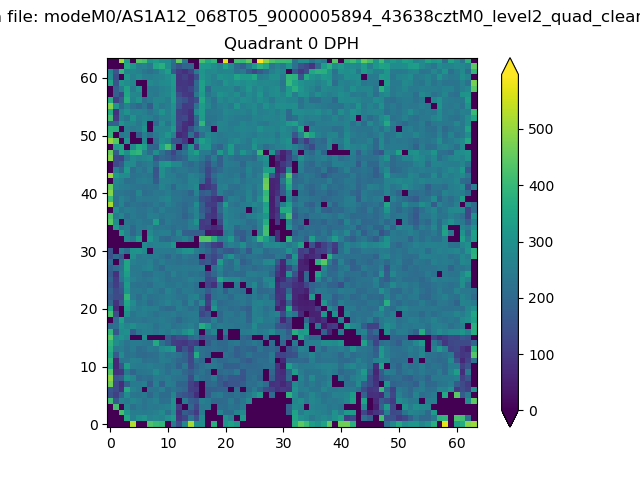 |
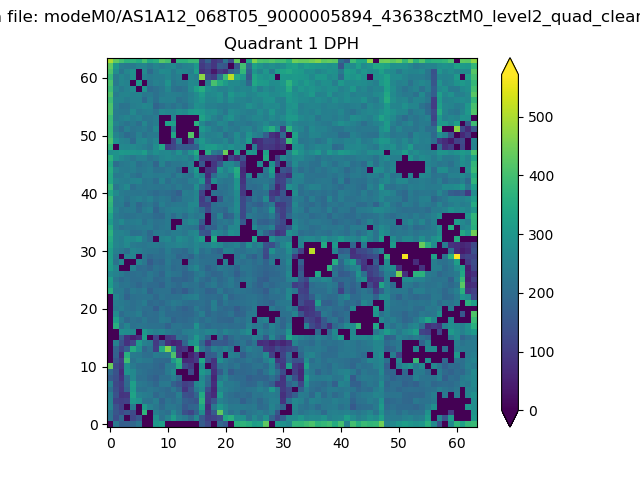 |
Quadrant B |
|---|---|---|---|
| Quadrant D | 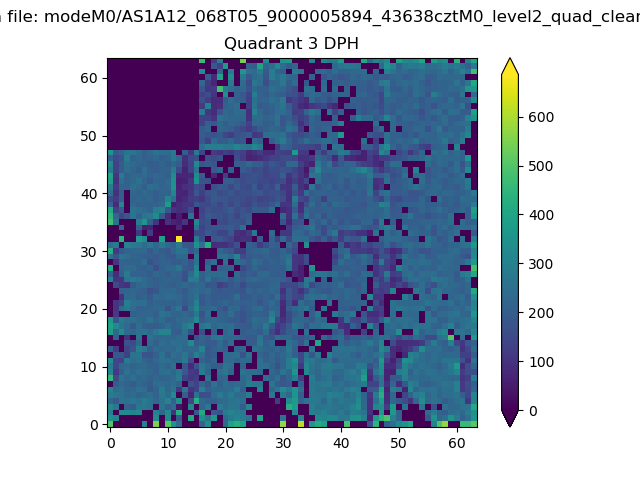 |
 |
Quadrant C |
| Plot type | Count rate plots | Images |
|---|---|---|
| Comparison with Poisson distribution Blue bars denote a histogram of data divided into 1 sec bins. Red curve is a Poisson curve with rate = median count rate of data. |
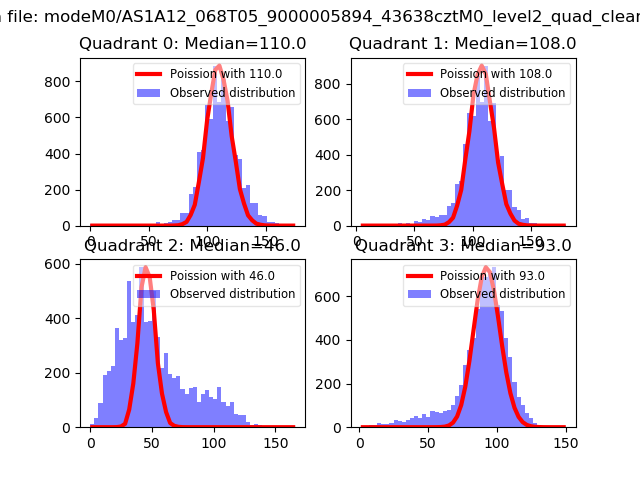 |
 |
| Quadrant-wise count rates Data is divided into 100 sec bins |
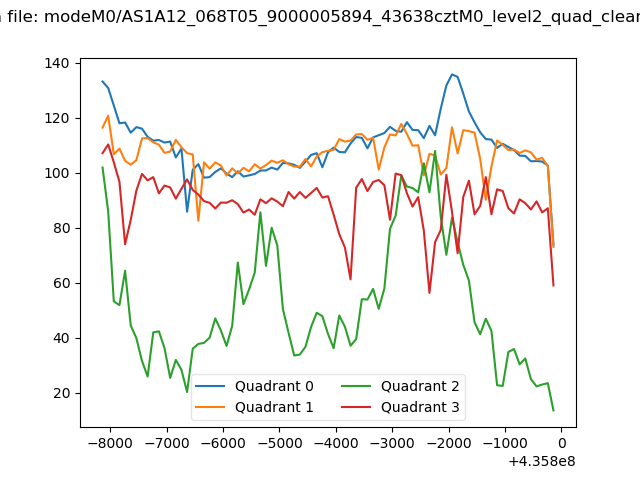 |
|
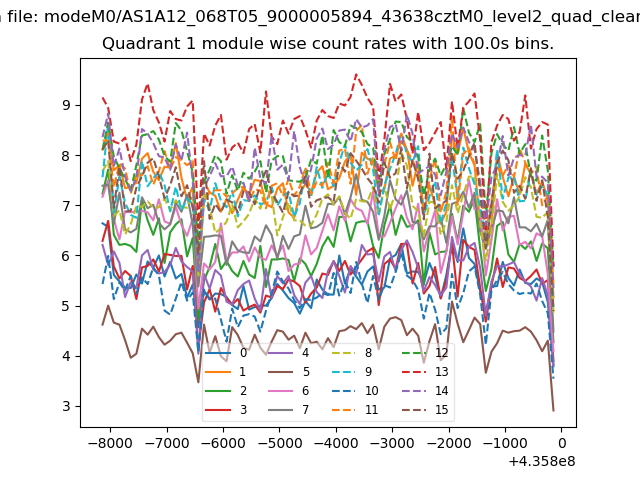
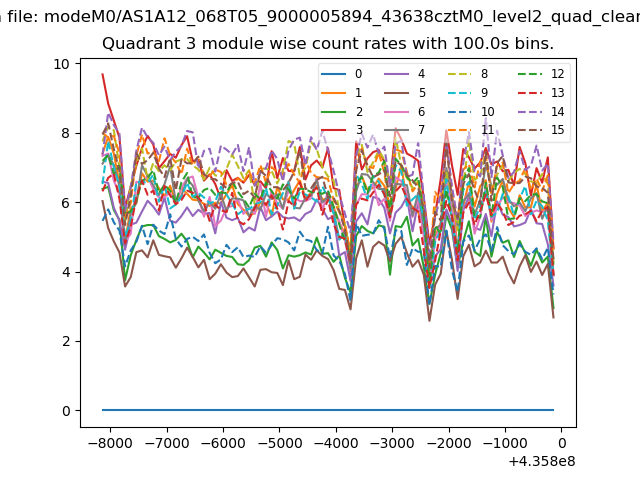
| Module-wise count rates for Quadrant A Data is divided into 100 sec bins |
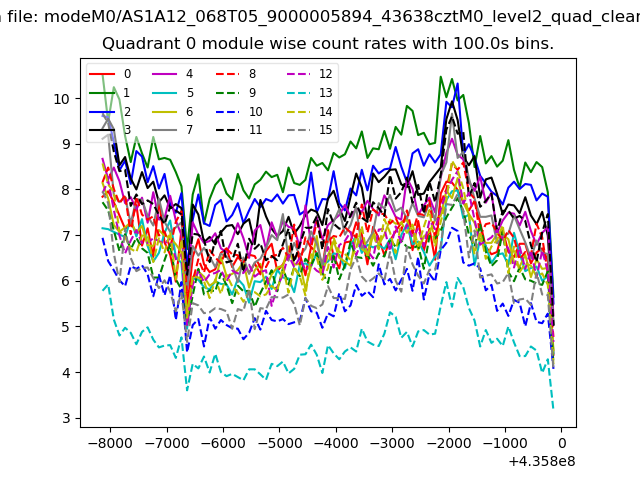 |
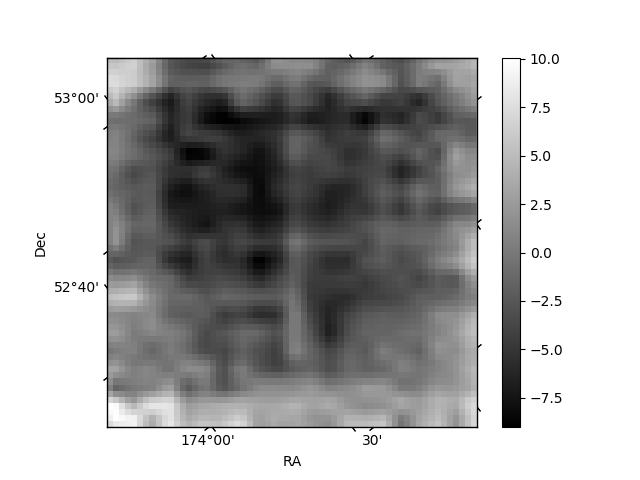 |
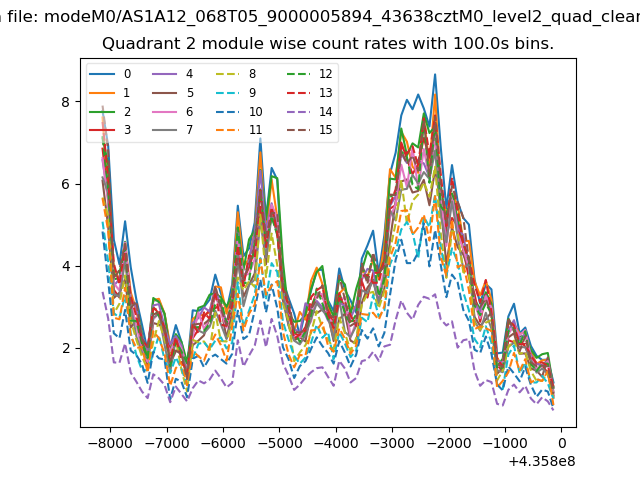
| Module-wise count rates for Quadrant B Data is divided into 100 sec bins |
 |
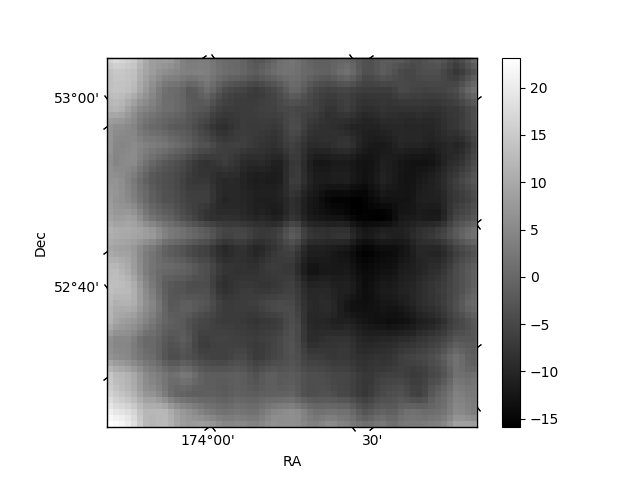 |
| Module-wise count rates for Quadrant C Data is divided into 100 sec bins |
 |
 |
| Module-wise count rates for Quadrant D Data is divided into 100 sec bins |
 |
 |
| Parameter | Plot |
|---|---|
| CZT HV Monitor |  |
| D_VDD | 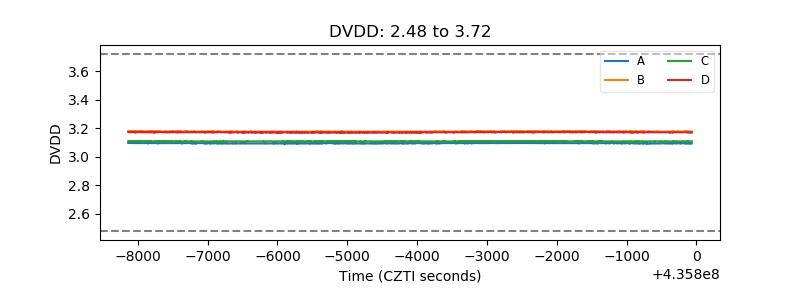 |
| Temperature 1 | 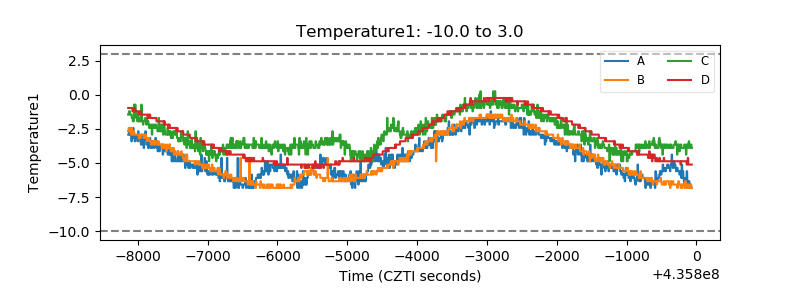 |
| Veto HV Monitor | 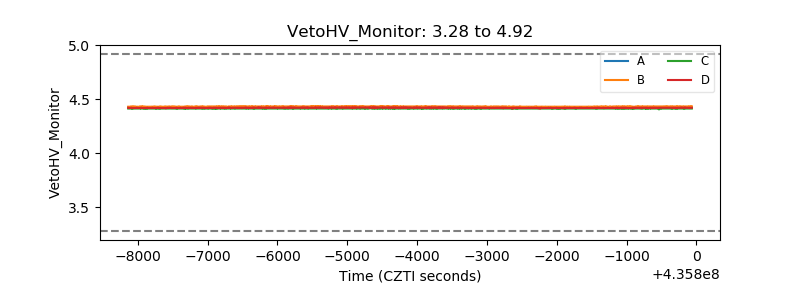 |
| Veto LLD | 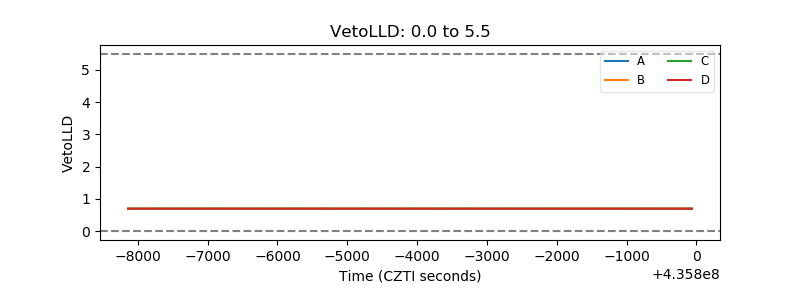 |
| Alpha Counter | 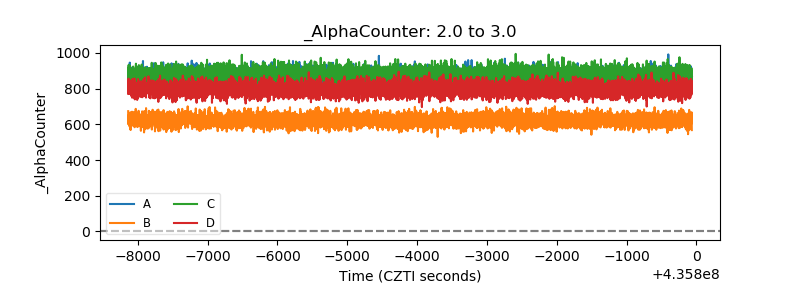 |
| _CPM_Rate | 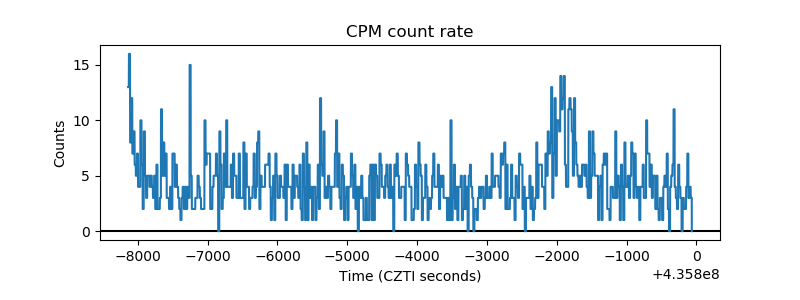 |
| CZT Counter | 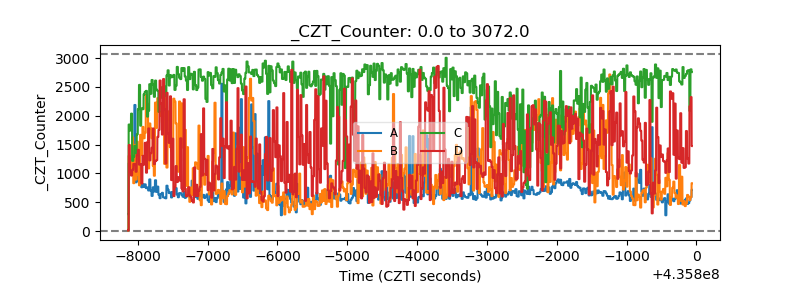 |
| +2.5 Volts monitor | 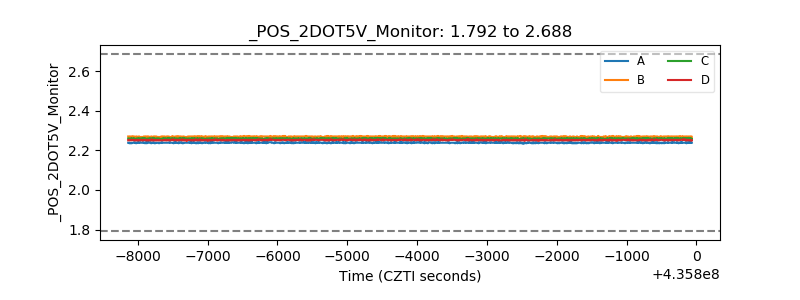 |
| +5 Volts monitor | 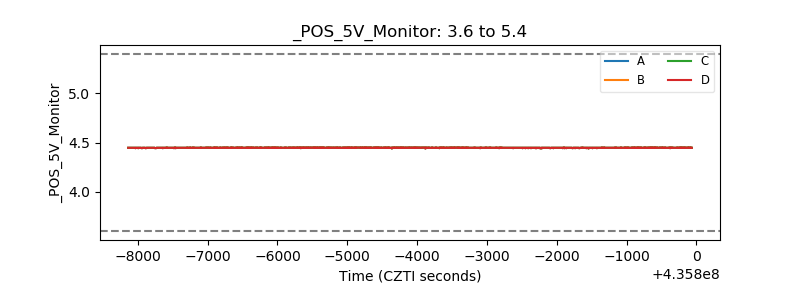 |
| _ROLL_ROT | 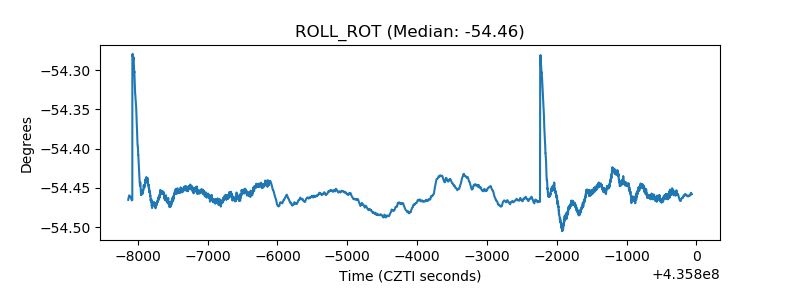 |
| _Roll_DEC | 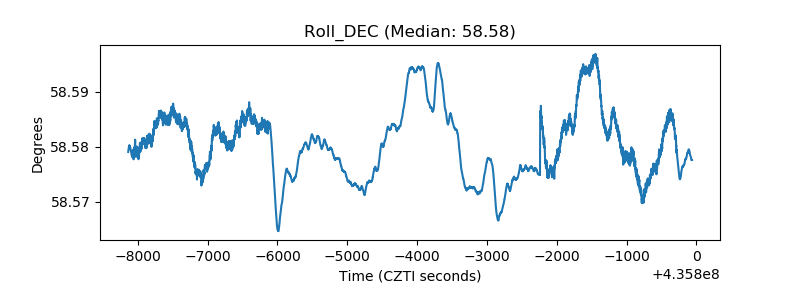 |
| _Roll_RA | 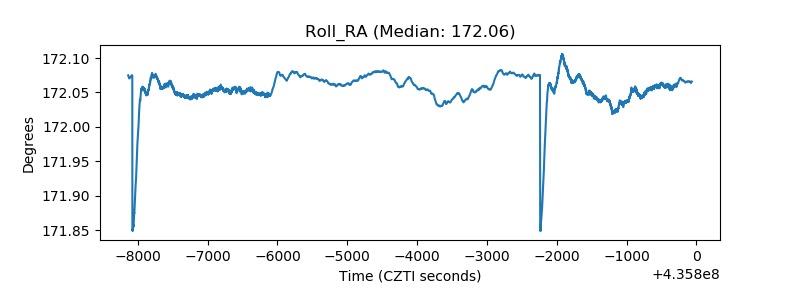 |
| Veto Counter | 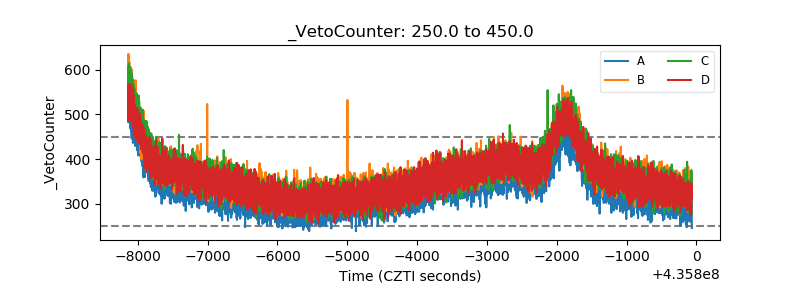 |