| Param | Original file | Final file |
|---|---|---|
| Filename | modeM0/AS1A12_068T05_9000005894_43639cztM0_level2.fits | modeM0/AS1A12_068T05_9000005894_43639cztM0_level2_quad_clean.evt |
| Size (bytes) | 1,225,200,960 | 106,427,520 |
| Size | 1.1 GB | 101.5 MB |
| Events in quadrant A | 5,532,036 | 854,970 |
| Events in quadrant B | 6,365,527 | 851,920 |
| Events in quadrant C | 19,980,226 | 306,481 |
| Events in quadrant D | 12,868,604 | 656,790 |
| Mode SS | |||
|---|---|---|---|
| Quadrant | BADHDUFLAG | Total packets | Discarded packets |
| A | 0 | 158 | 0 |
| B | 0 | 158 | 0 |
| C | 0 | 158 | 0 |
| D | 0 | 158 | 0 |
| Mode M0 | |||
|---|---|---|---|
| Quadrant | BADHDUFLAG | Total packets | Discarded packets |
| A | 0 | 21662 | 1 |
| B | 0 | 24363 | 1 |
| C | 0 | 64796 | 7 |
| D | 0 | 43748 | 1 |
| Quadrant | Total seconds | Saturated seconds | Saturation percentage |
|---|---|---|---|
| A | 7862 | 228 | 2.900025% |
| B | 7863 | 679 | 8.635381% |
| C | 7862 | 7491 | 95.281099% |
| D | 7862 | 3323 | 42.266599% |
Noise dominated data is calculated using 1-second bins in cleaned event files. If a bin has >2000 counts, and if more than 50% of those come from <1% of pixels, then it is considered to be noise-dominated and hence unusable.
| Quadrant | # 1 sec bins | Bins with >0 counts | Bins with >2000 counts | High rate bins dominated by noise | Noise dominated (total time) | Noise dominated (detector-on time) | Marked lightcurve |
|---|---|---|---|---|---|---|---|
| A | 7912 | 7863 | 50 | 50 | 0.63% | 0.64% |  |
| B | 7913 | 7864 | 241 | 241 | 3.05% | 3.06% | 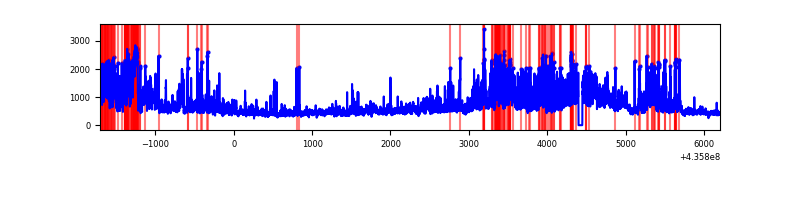 |
| C | 7911 | 7861 | 7295 | 7295 | 92.21% | 92.80% | 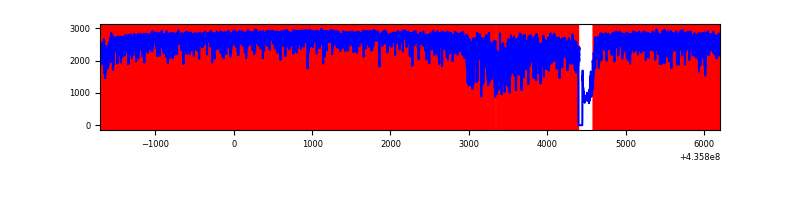 |
| D | 7912 | 7863 | 2784 | 2784 | 35.19% | 35.41% | 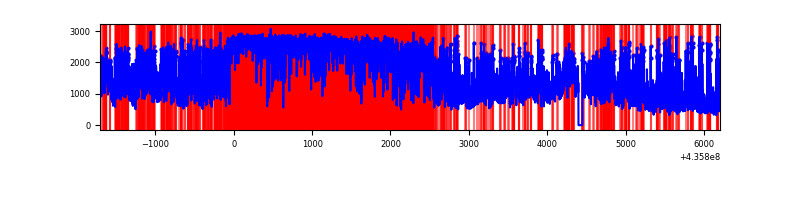 |
Top three noisy pixels from each quadrant. If the there are fewer than three noisy pixels in the level2.evt file, extra rows are filled as -1
| Pixel properties | Quadrant properties | ||||||
|---|---|---|---|---|---|---|---|
| Quadrant | DetID | PixID | Counts | Sigma | Mean | Median | Sigma |
| A | 10 | 83 | 879841 | 4785.1 | 880 | 859 | 183.7 |
| A | 15 | 223 | 332353 | 1804.62 | 880 | 859 | 183.7 |
| A | 15 | 222 | 242037 | 1312.95 | 880 | 859 | 183.7 |
| B | 4 | 206 | 1720561 | 10345.1 | 860 | 834 | 166.2 |
| B | 5 | 235 | 796104 | 4783.98 | 860 | 834 | 166.2 |
| B | 0 | 200 | 109697 | 654.87 | 860 | 834 | 166.2 |
| C | 15 | 142 | 8918170 | 109548.2 | 345 | 346 | 81.4 |
| C | 15 | 174 | 7258187 | 89156.66 | 345 | 346 | 81.4 |
| C | 3 | 233 | 1124616 | 13810.74 | 345 | 346 | 81.4 |
| D | 4 | 216 | 3856360 | 19499.96 | 756 | 731 | 197.7 |
| D | 4 | 221 | 1341528 | 6781.12 | 756 | 731 | 197.7 |
| D | 14 | 210 | 545157 | 2753.45 | 756 | 731 | 197.7 |
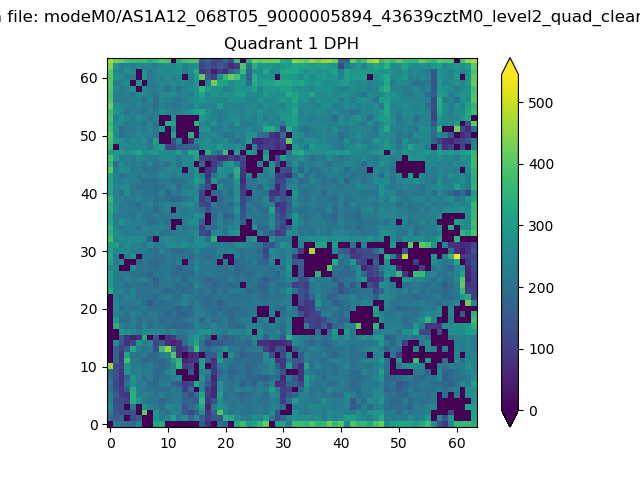
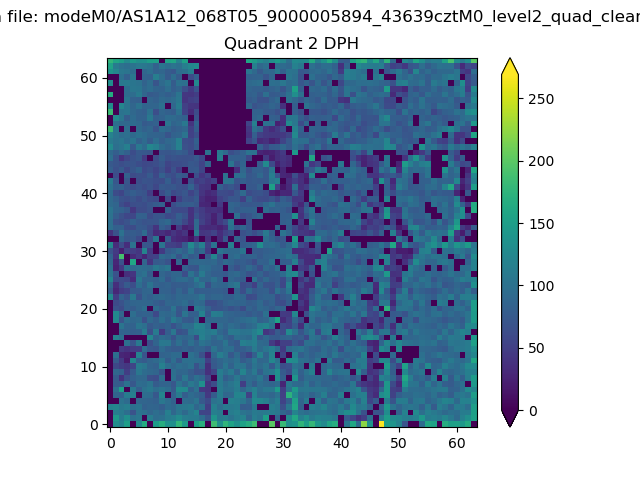
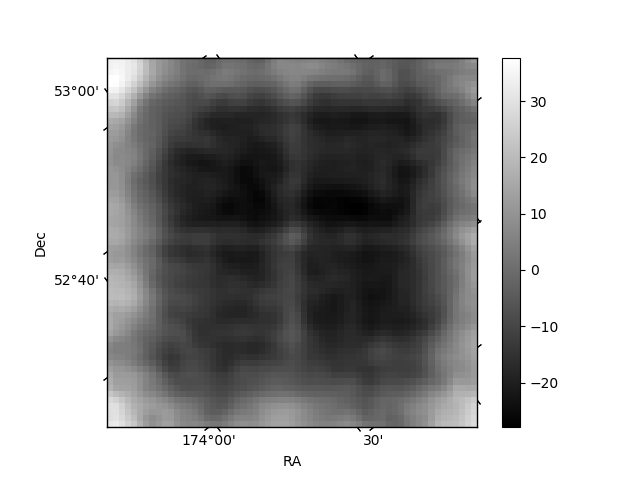
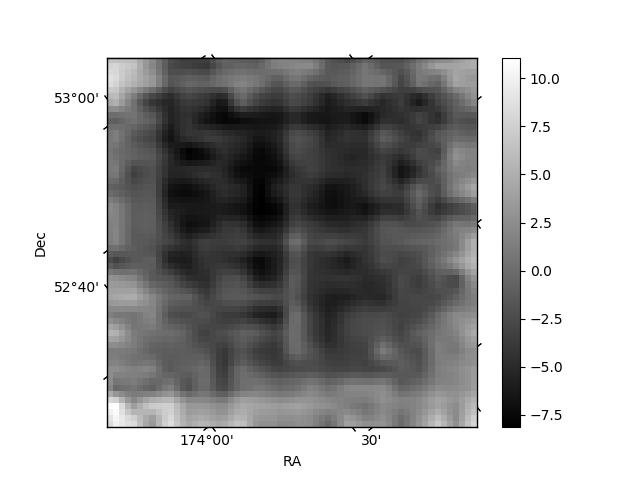
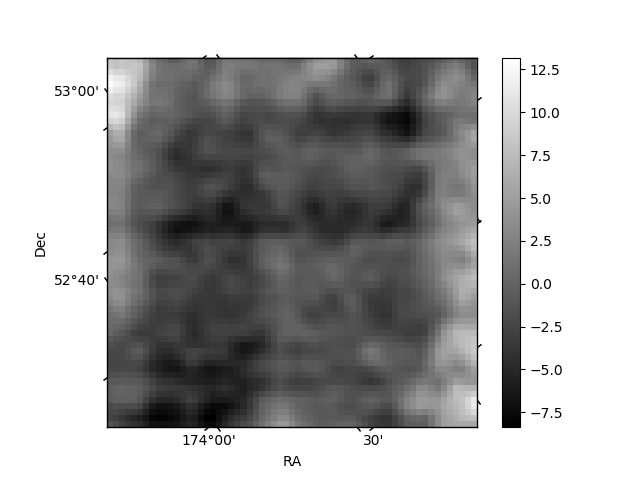
Histogram calculated using DETX and DETY for each event in the final _common_clean file
| Quadrant A | 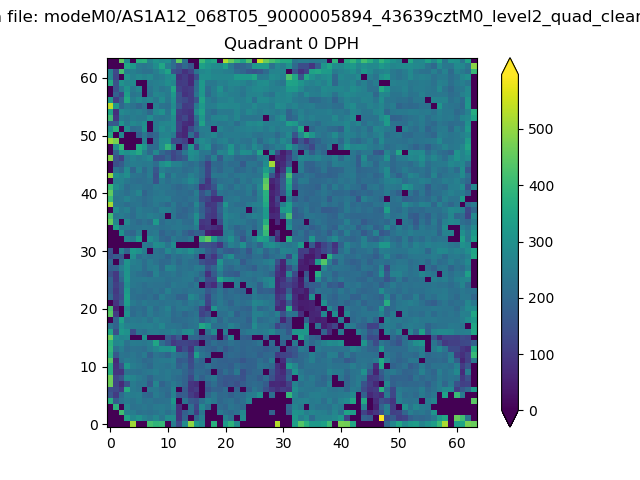 |
 |
Quadrant B |
|---|---|---|---|
| Quadrant D | 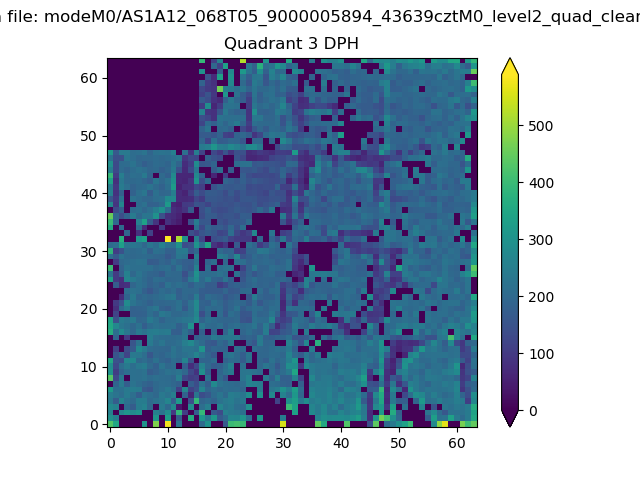 |
 |
Quadrant C |
| Plot type | Count rate plots | Images |
|---|---|---|
| Comparison with Poisson distribution Blue bars denote a histogram of data divided into 1 sec bins. Red curve is a Poisson curve with rate = median count rate of data. |
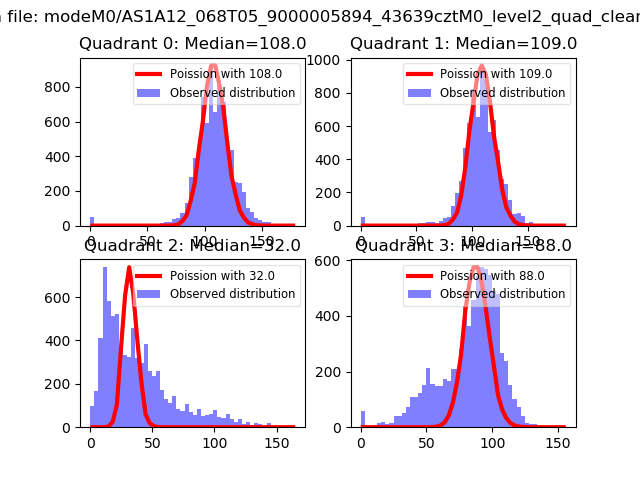 |
 |
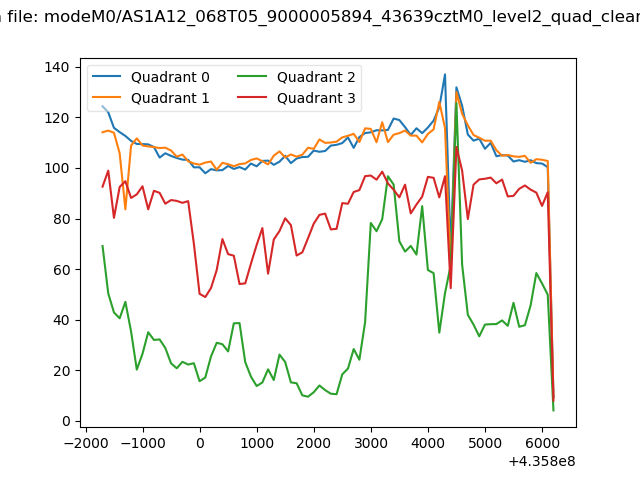
| Quadrant-wise count rates Data is divided into 100 sec bins |
 |
|
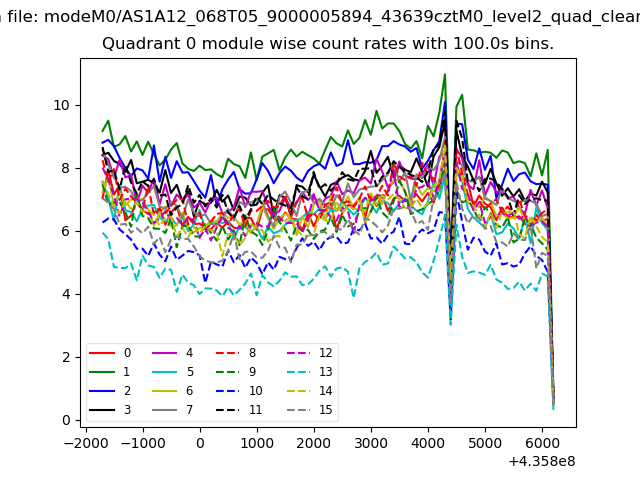
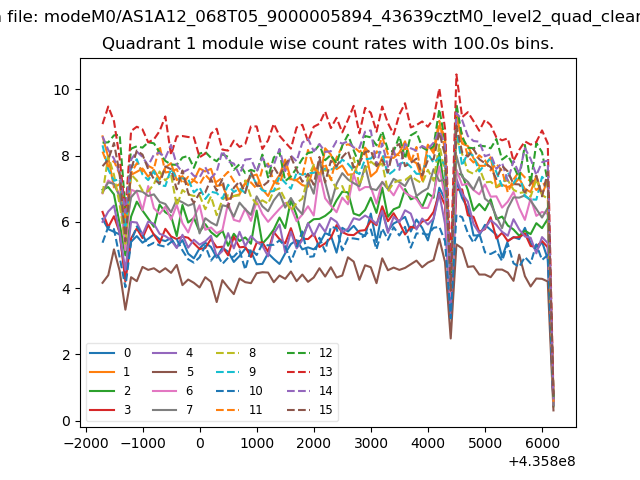
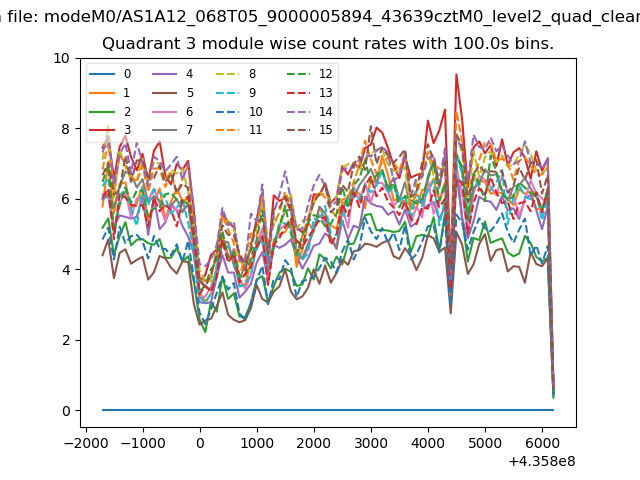
| Module-wise count rates for Quadrant A Data is divided into 100 sec bins |
 |
 |
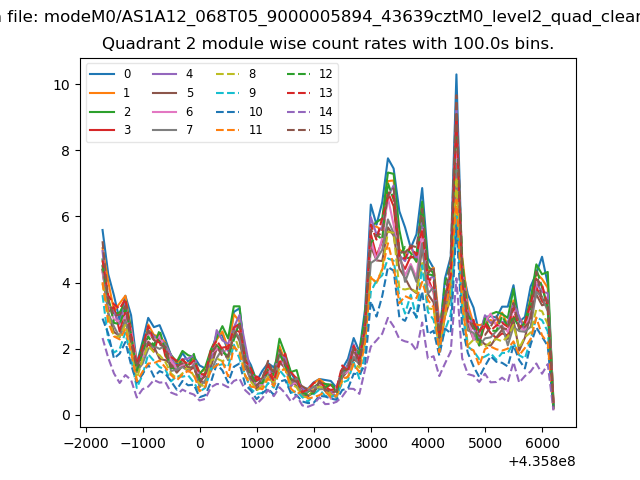
| Module-wise count rates for Quadrant B Data is divided into 100 sec bins |
 |
 |
| Module-wise count rates for Quadrant C Data is divided into 100 sec bins |
 |
 |
| Module-wise count rates for Quadrant D Data is divided into 100 sec bins |
 |
 |
| Parameter | Plot |
|---|---|
| CZT HV Monitor | 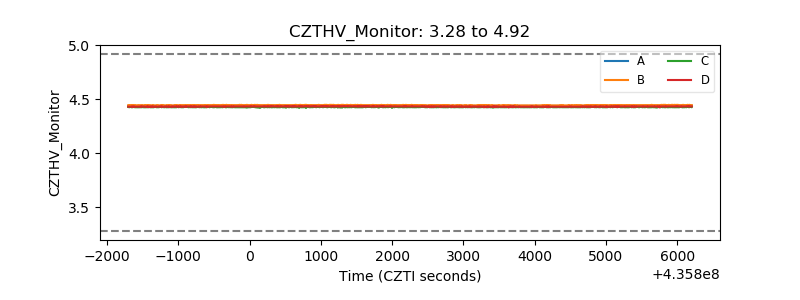 |
| D_VDD | 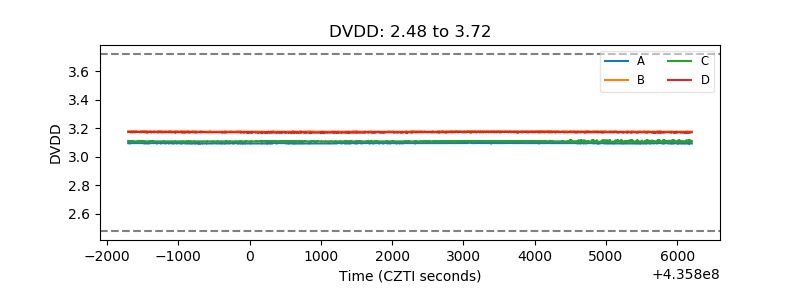 |
| Temperature 1 | 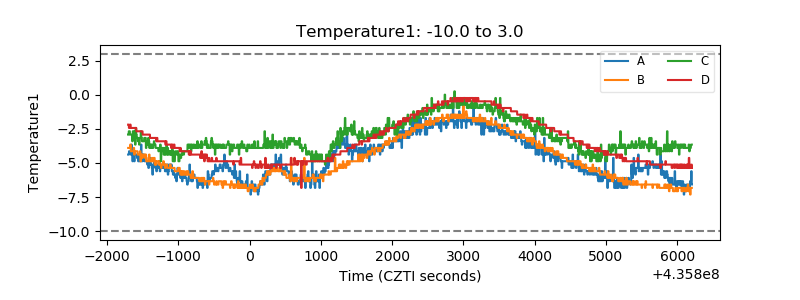 |
| Veto HV Monitor | 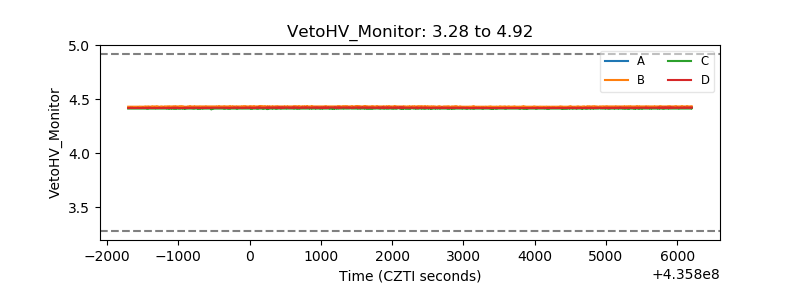 |
| Veto LLD | 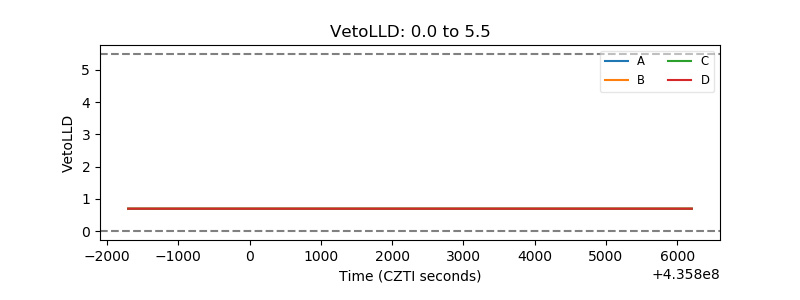 |
| Alpha Counter | 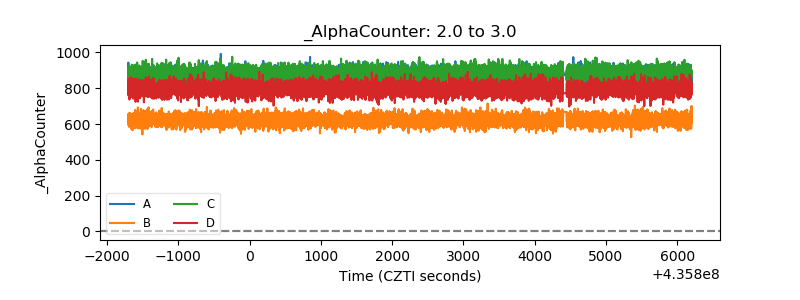 |
| _CPM_Rate | 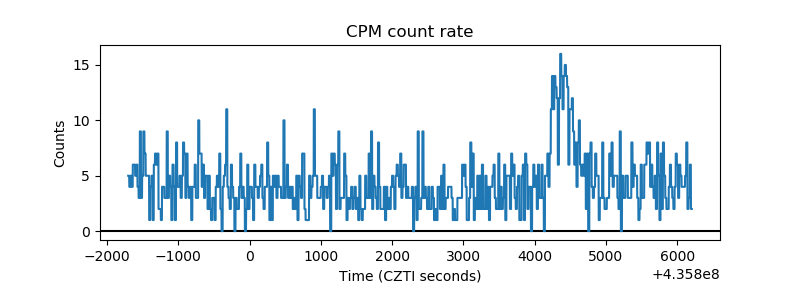 |
| CZT Counter | 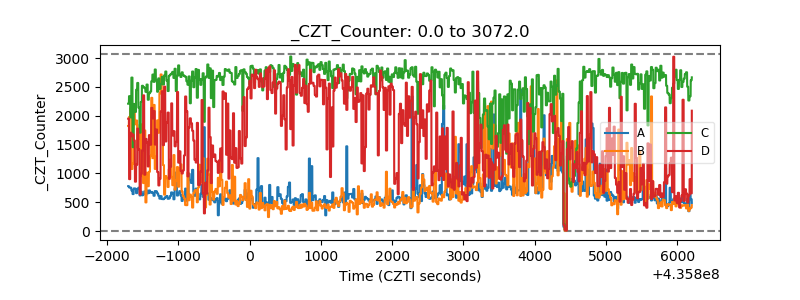 |
| +2.5 Volts monitor | 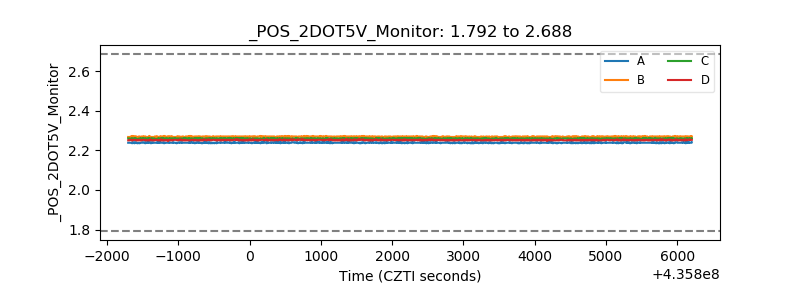 |
| +5 Volts monitor | 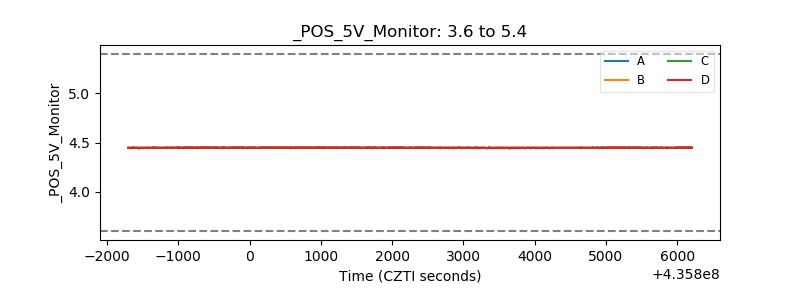 |
| _ROLL_ROT | 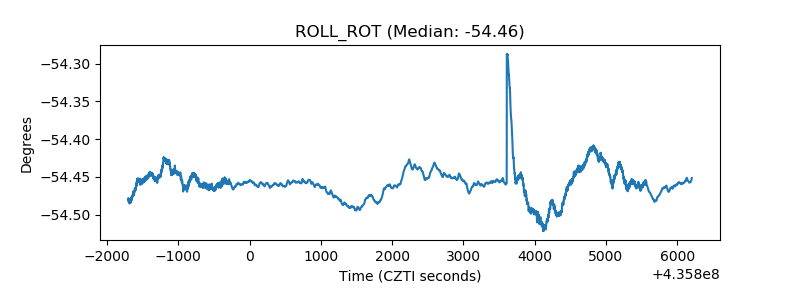 |
| _Roll_DEC | 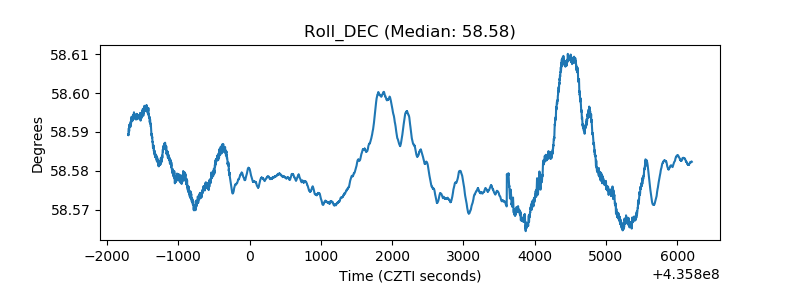 |
| _Roll_RA | 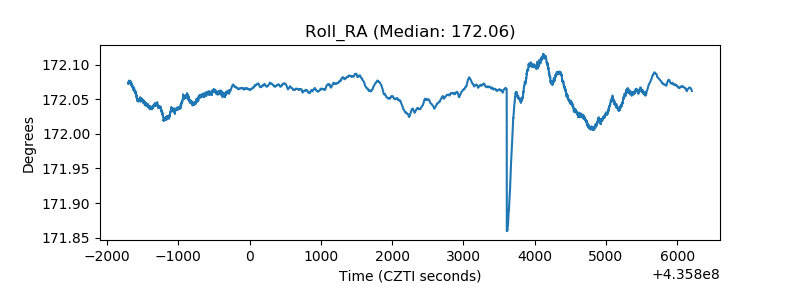 |
| Veto Counter | 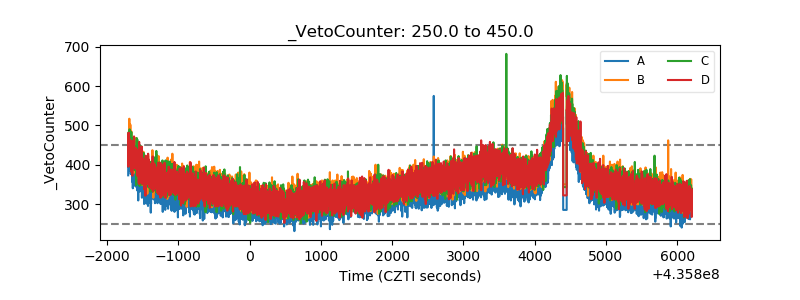 |