| Param | Original file | Final file |
|---|---|---|
| Filename | modeM0/AS1A12_068T05_9000005894_43645cztM0_level2.fits | modeM0/AS1A12_068T05_9000005894_43645cztM0_level2_quad_clean.evt |
| Size (bytes) | 860,673,600 | 92,825,280 |
| Size | 820.8 MB | 88.5 MB |
| Events in quadrant A | 4,551,214 | 700,482 |
| Events in quadrant B | 4,125,123 | 721,679 |
| Events in quadrant C | 15,624,766 | 357,789 |
| Events in quadrant D | 7,068,460 | 585,757 |
| Mode SS | |||
|---|---|---|---|
| Quadrant | BADHDUFLAG | Total packets | Discarded packets |
| A | 0 | 128 | 0 |
| B | 0 | 128 | 0 |
| C | 0 | 128 | 0 |
| D | 0 | 128 | 0 |
| Mode M9 | |||
|---|---|---|---|
| Quadrant | BADHDUFLAG | Total packets | Discarded packets |
| A | 0 | 10 | 0 |
| B | 0 | 10 | 0 |
| C | 0 | 10 | 0 |
| D | 0 | 10 | 0 |
| Mode M0 | |||
|---|---|---|---|
| Quadrant | BADHDUFLAG | Total packets | Discarded packets |
| A | 0 | 17501 | 1 |
| B | 0 | 16415 | 1 |
| C | 0 | 50725 | 7 |
| D | 0 | 25407 | 1 |
| Quadrant | Total seconds | Saturated seconds | Saturation percentage |
|---|---|---|---|
| A | 6322 | 312 | 4.935147% |
| B | 6323 | 255 | 4.032896% |
| C | 6322 | 5646 | 89.307181% |
| D | 6322 | 1038 | 16.418855% |
Noise dominated data is calculated using 1-second bins in cleaned event files. If a bin has >2000 counts, and if more than 50% of those come from <1% of pixels, then it is considered to be noise-dominated and hence unusable.
| Quadrant | # 1 sec bins | Bins with >0 counts | Bins with >2000 counts | High rate bins dominated by noise | Noise dominated (total time) | Noise dominated (detector-on time) | Marked lightcurve |
|---|---|---|---|---|---|---|---|
| A | 7342 | 6322 | 210 | 210 | 2.86% | 3.32% | 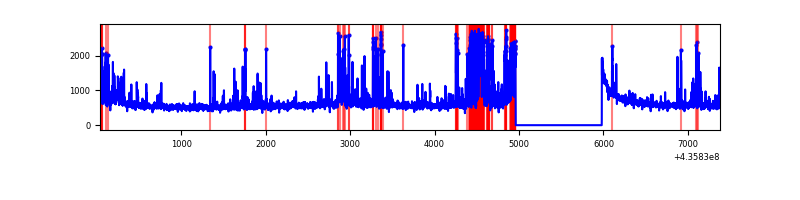 |
| B | 7343 | 6323 | 132 | 132 | 1.80% | 2.09% | 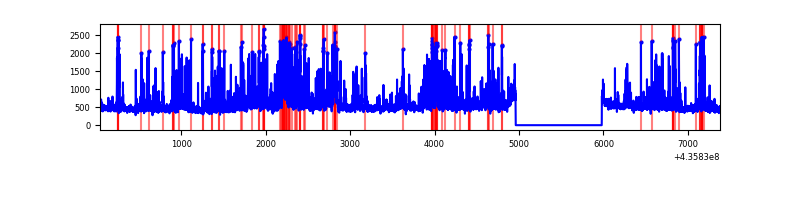 |
| C | 7341 | 6321 | 5690 | 5690 | 77.51% | 90.02% | 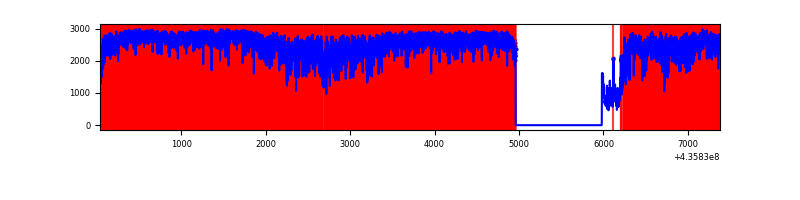 |
| D | 7342 | 6322 | 873 | 873 | 11.89% | 13.81% | 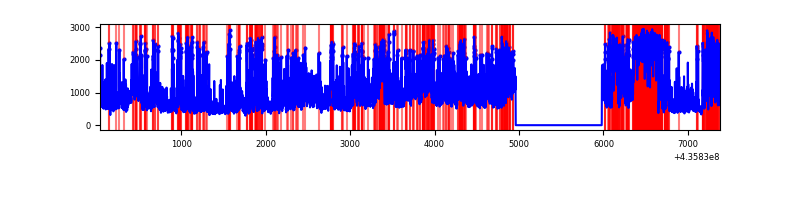 |
Top three noisy pixels from each quadrant. If the there are fewer than three noisy pixels in the level2.evt file, extra rows are filled as -1
| Pixel properties | Quadrant properties | ||||||
|---|---|---|---|---|---|---|---|
| Quadrant | DetID | PixID | Counts | Sigma | Mean | Median | Sigma |
| A | 13 | 248 | 810916 | 5651.81 | 698 | 683 | 143.4 |
| A | 10 | 83 | 769971 | 5366.19 | 698 | 683 | 143.4 |
| A | 15 | 223 | 146018 | 1013.79 | 698 | 683 | 143.4 |
| B | 12 | 32 | 939001 | 6914.19 | 698 | 678 | 135.7 |
| B | 5 | 235 | 224337 | 1648.07 | 698 | 678 | 135.7 |
| B | 4 | 206 | 79308 | 579.4 | 698 | 678 | 135.7 |
| C | 15 | 142 | 9986847 | 116796.95 | 363 | 364 | 85.5 |
| C | 15 | 157 | 1549054 | 18112.71 | 363 | 364 | 85.5 |
| C | 3 | 233 | 1038177 | 12137.75 | 363 | 364 | 85.5 |
| D | 13 | 249 | 1537627 | 8890.1 | 651 | 626 | 172.9 |
| D | 4 | 221 | 446075 | 2576.5 | 651 | 626 | 172.9 |
| D | 14 | 210 | 401710 | 2319.89 | 651 | 626 | 172.9 |
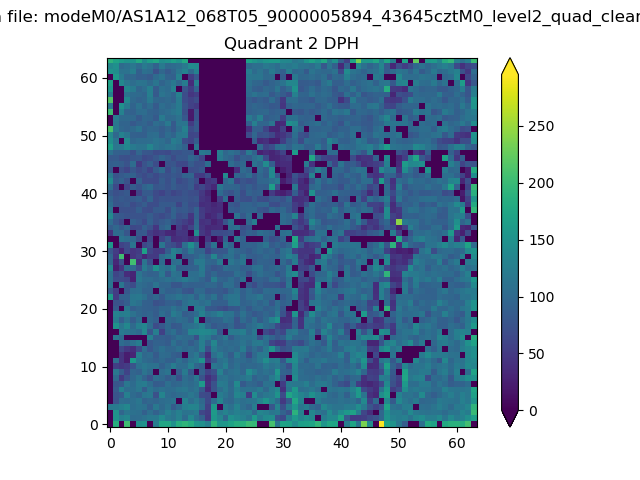
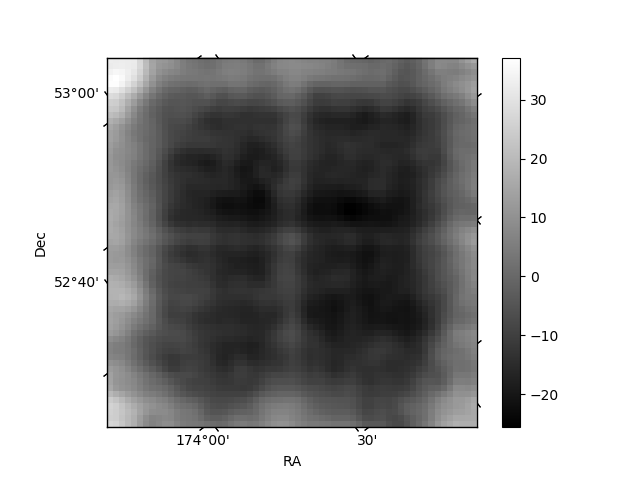
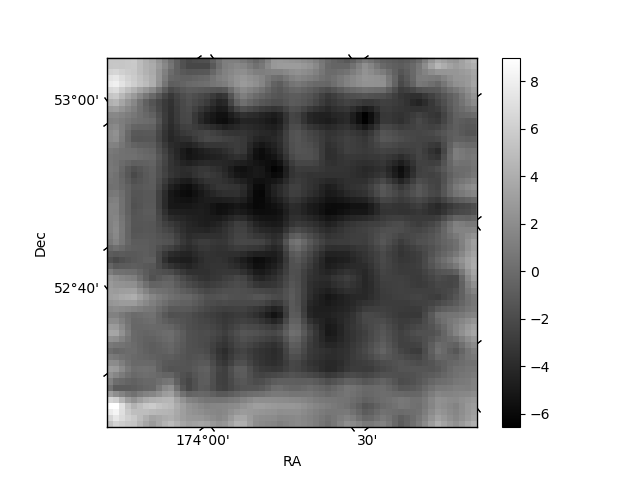
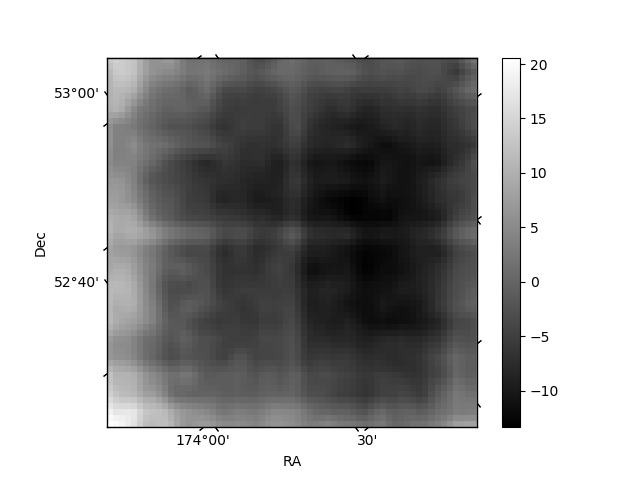
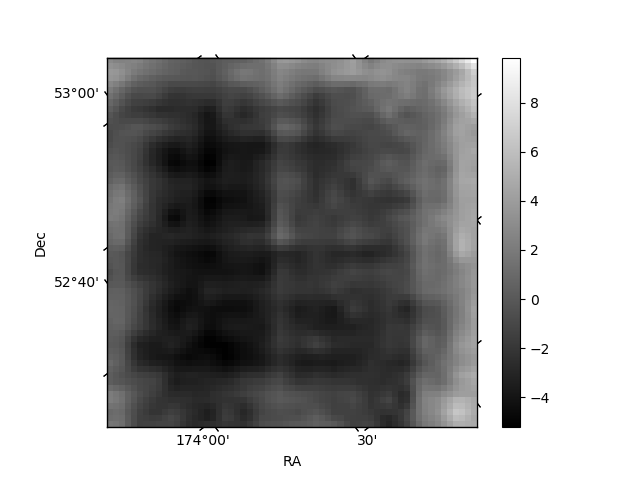
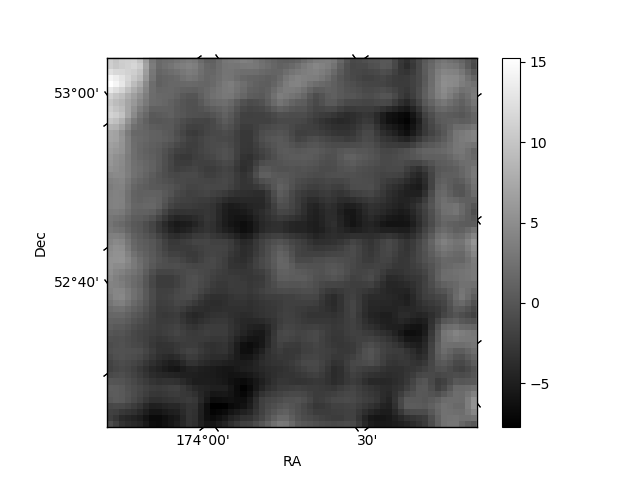
Histogram calculated using DETX and DETY for each event in the final _common_clean file
| Quadrant A | 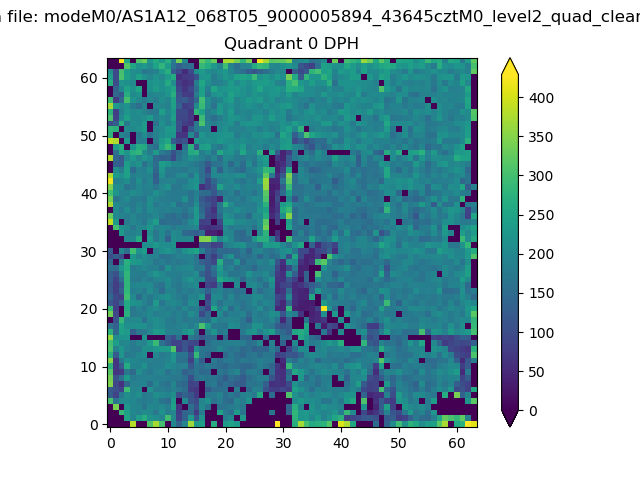 |
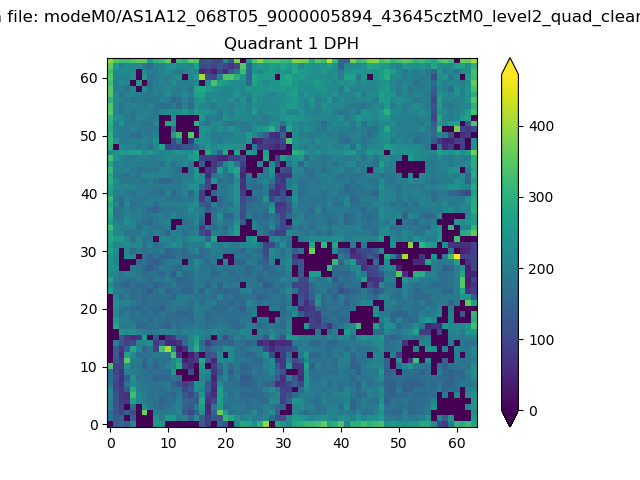 |
Quadrant B |
|---|---|---|---|
| Quadrant D | 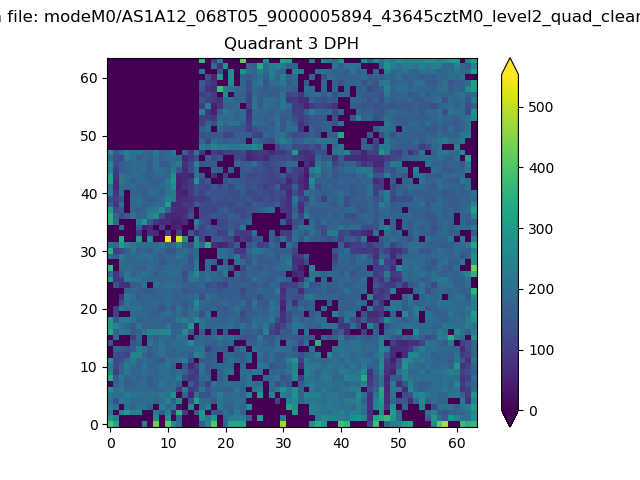 |
 |
Quadrant C |
| Plot type | Count rate plots | Images |
|---|---|---|
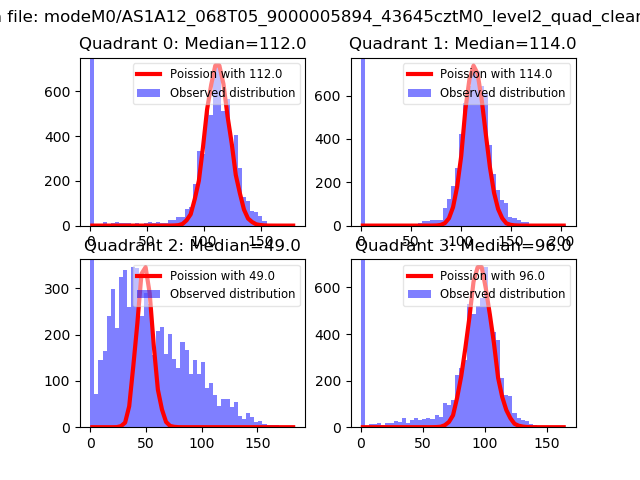
| Comparison with Poisson distribution Blue bars denote a histogram of data divided into 1 sec bins. Red curve is a Poisson curve with rate = median count rate of data. |
 |
 |
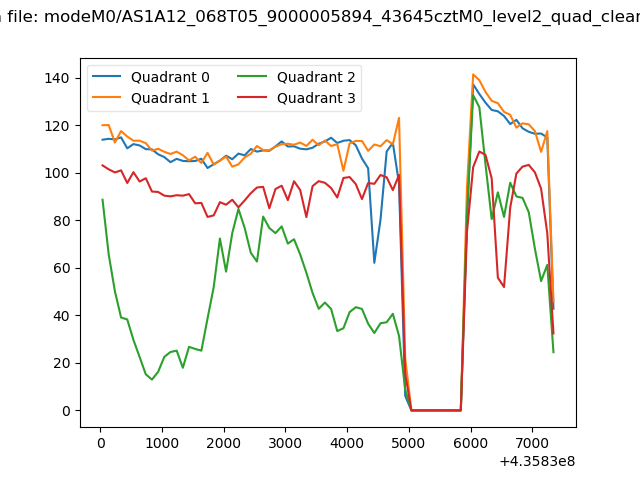
| Quadrant-wise count rates Data is divided into 100 sec bins |
 |
|
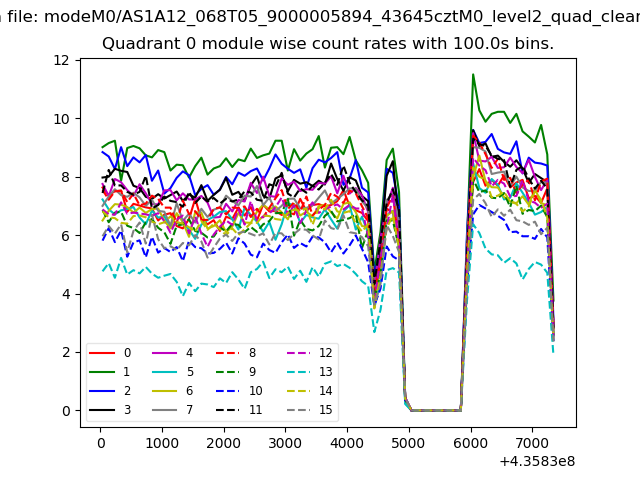
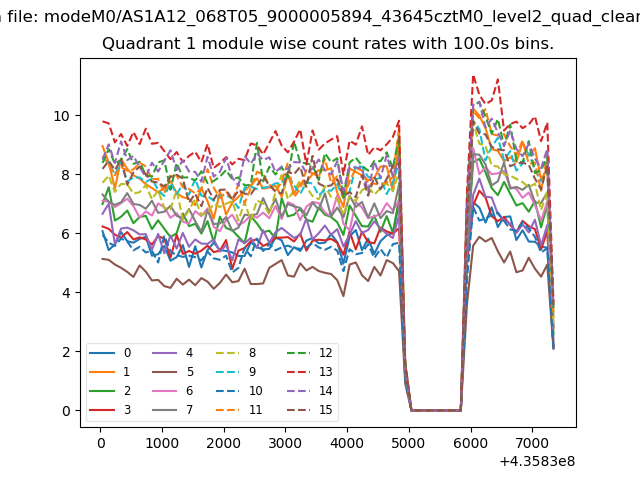
| Module-wise count rates for Quadrant A Data is divided into 100 sec bins |
 |
 |
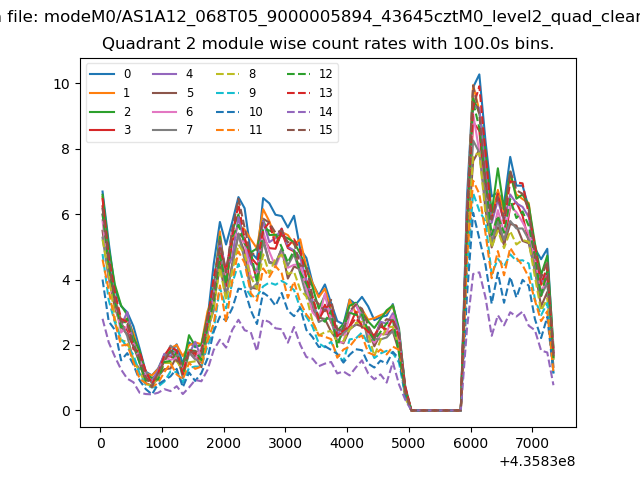
| Module-wise count rates for Quadrant B Data is divided into 100 sec bins |
 |
 |
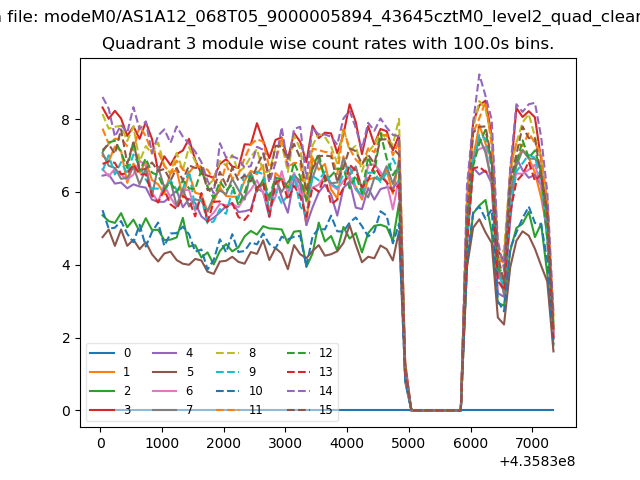
| Module-wise count rates for Quadrant C Data is divided into 100 sec bins |
 |
 |
| Module-wise count rates for Quadrant D Data is divided into 100 sec bins |
 |
 |
| Parameter | Plot |
|---|---|
| CZT HV Monitor | 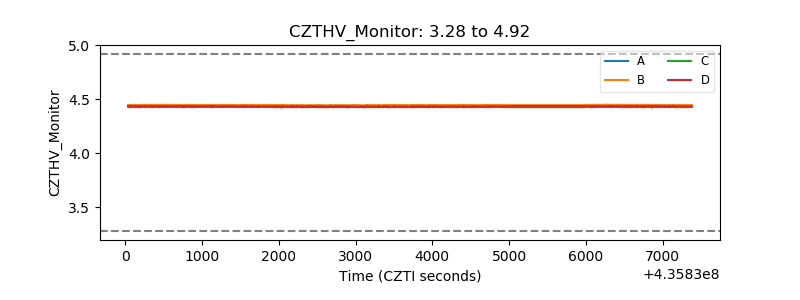 |
| D_VDD | 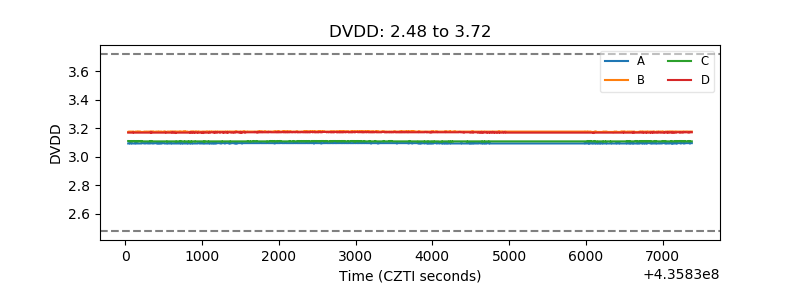 |
| Temperature 1 | 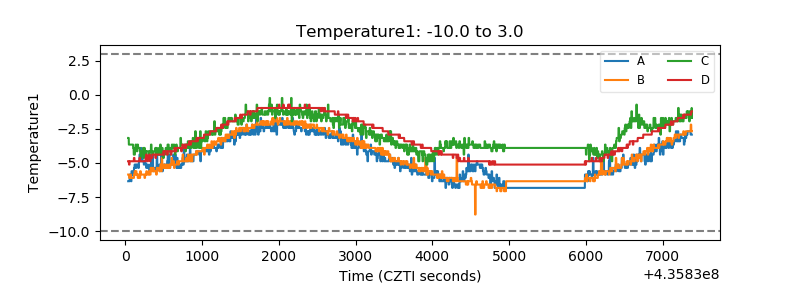 |
| Veto HV Monitor | 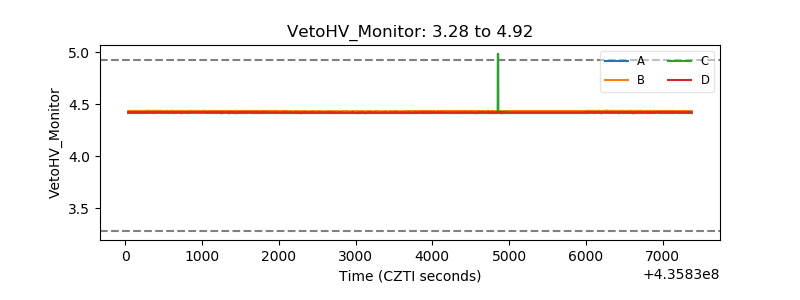 |
| Veto LLD | 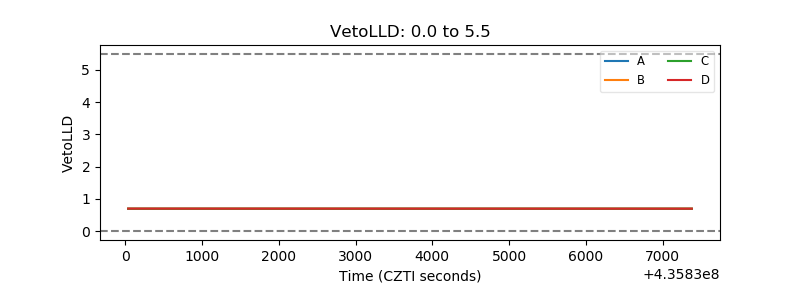 |
| Alpha Counter | 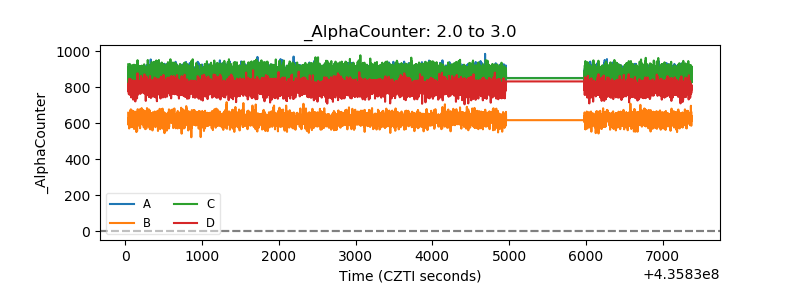 |
| _CPM_Rate | 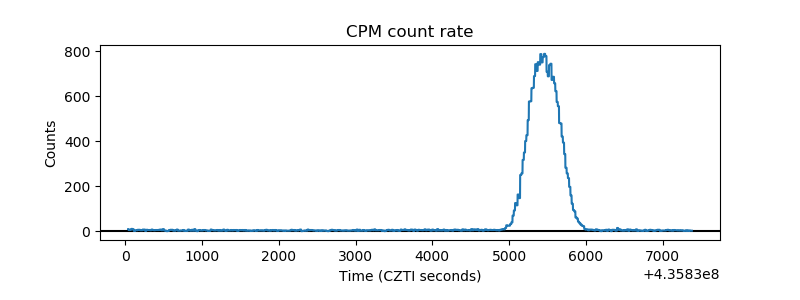 |
| CZT Counter | 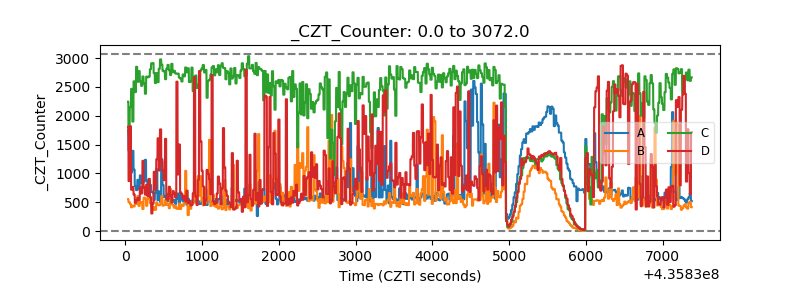 |
| +2.5 Volts monitor | 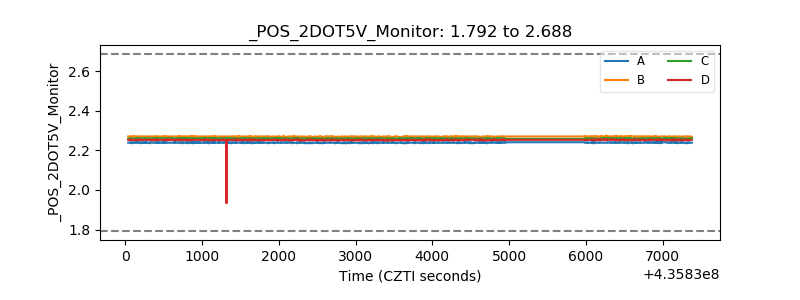 |
| +5 Volts monitor | 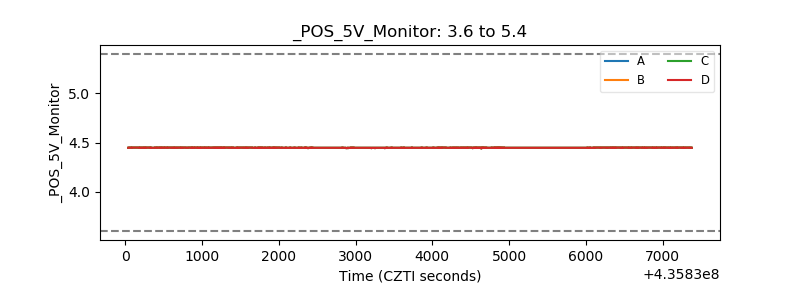 |
| _ROLL_ROT | 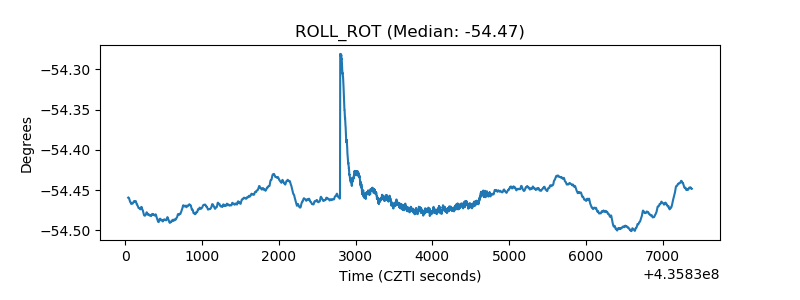 |
| _Roll_DEC | 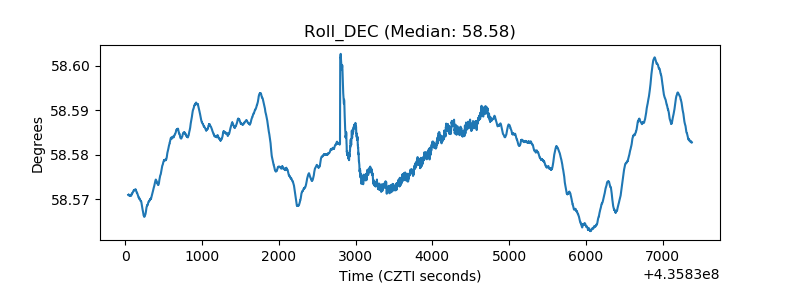 |
| _Roll_RA | 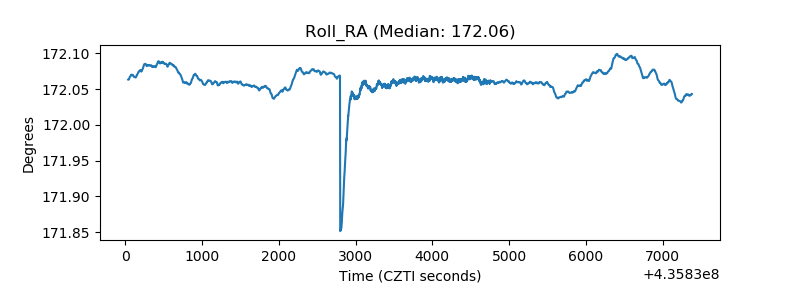 |
| Veto Counter | 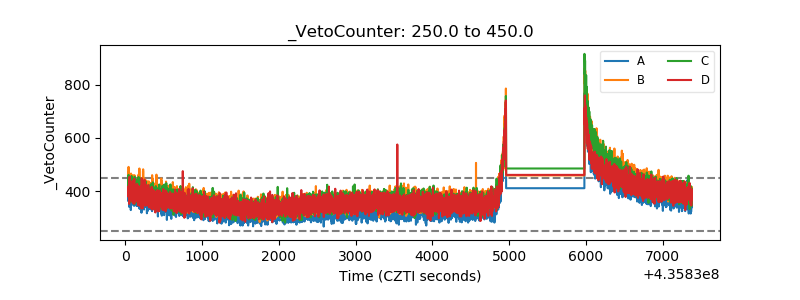 |