| Param | Original file | Final file |
|---|---|---|
| Filename | modeM0/AS1A12_068T05_9000005894_43647cztM0_level2.fits | modeM0/AS1A12_068T05_9000005894_43647cztM0_level2_quad_clean.evt |
| Size (bytes) | 801,771,840 | 94,193,280 |
| Size | 764.6 MB | 89.8 MB |
| Events in quadrant A | 4,055,923 | 734,015 |
| Events in quadrant B | 4,354,558 | 727,696 |
| Events in quadrant C | 14,698,642 | 346,605 |
| Events in quadrant D | 6,106,264 | 622,556 |
| Mode SS | |||
|---|---|---|---|
| Quadrant | BADHDUFLAG | Total packets | Discarded packets |
| A | 0 | 122 | 0 |
| B | 0 | 122 | 0 |
| C | 0 | 122 | 0 |
| D | 0 | 122 | 0 |
| Mode M9 | |||
|---|---|---|---|
| Quadrant | BADHDUFLAG | Total packets | Discarded packets |
| A | 0 | 12 | 0 |
| B | 0 | 12 | 0 |
| C | 0 | 12 | 0 |
| D | 0 | 12 | 0 |
| Mode M0 | |||
|---|---|---|---|
| Quadrant | BADHDUFLAG | Total packets | Discarded packets |
| A | 0 | 16501 | 1 |
| B | 0 | 16752 | 1 |
| C | 0 | 47812 | 6 |
| D | 0 | 22386 | 1 |
| Quadrant | Total seconds | Saturated seconds | Saturation percentage |
|---|---|---|---|
| A | 5988 | 106 | 1.770207% |
| B | 5988 | 384 | 6.412826% |
| C | 5988 | 5200 | 86.840347% |
| D | 5988 | 611 | 10.203741% |
Noise dominated data is calculated using 1-second bins in cleaned event files. If a bin has >2000 counts, and if more than 50% of those come from <1% of pixels, then it is considered to be noise-dominated and hence unusable.
| Quadrant | # 1 sec bins | Bins with >0 counts | Bins with >2000 counts | High rate bins dominated by noise | Noise dominated (total time) | Noise dominated (detector-on time) | Marked lightcurve |
|---|---|---|---|---|---|---|---|
| A | 7217 | 5988 | 30 | 30 | 0.42% | 0.50% | 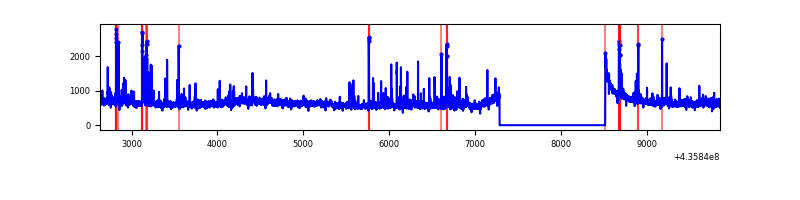 |
| B | 7218 | 5988 | 330 | 330 | 4.57% | 5.51% | 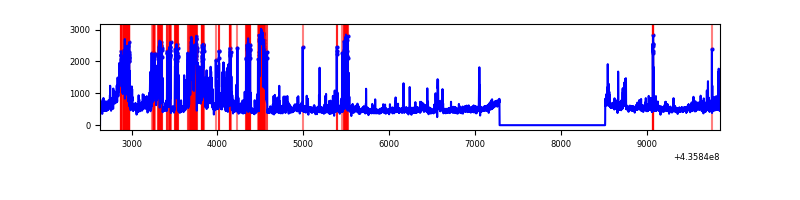 |
| C | 7218 | 5989 | 5196 | 5196 | 71.99% | 86.76% |  |
| D | 7218 | 5988 | 480 | 480 | 6.65% | 8.02% | 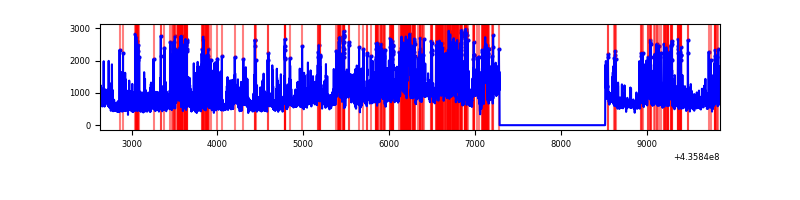 |
Top three noisy pixels from each quadrant. If the there are fewer than three noisy pixels in the level2.evt file, extra rows are filled as -1
| Pixel properties | Quadrant properties | ||||||
|---|---|---|---|---|---|---|---|
| Quadrant | DetID | PixID | Counts | Sigma | Mean | Median | Sigma |
| A | 10 | 83 | 787276 | 5475.43 | 705 | 691 | 143.7 |
| A | 13 | 248 | 134360 | 930.47 | 705 | 691 | 143.7 |
| A | 15 | 223 | 111592 | 771.98 | 705 | 691 | 143.7 |
| B | 5 | 235 | 1163554 | 8915.78 | 682 | 664 | 130.4 |
| B | 10 | 245 | 183684 | 1403.2 | 682 | 664 | 130.4 |
| B | 4 | 206 | 111960 | 853.3 | 682 | 664 | 130.4 |
| C | 15 | 142 | 7363123 | 92612.52 | 339 | 341 | 79.5 |
| C | 15 | 126 | 2507126 | 31531.51 | 339 | 341 | 79.5 |
| C | 15 | 158 | 1545820 | 19439.76 | 339 | 341 | 79.5 |
| D | 13 | 187 | 720701 | 3944.43 | 666 | 648 | 182.5 |
| D | 12 | 6 | 626648 | 3429.21 | 666 | 648 | 182.5 |
| D | 14 | 210 | 309327 | 1690.93 | 666 | 648 | 182.5 |
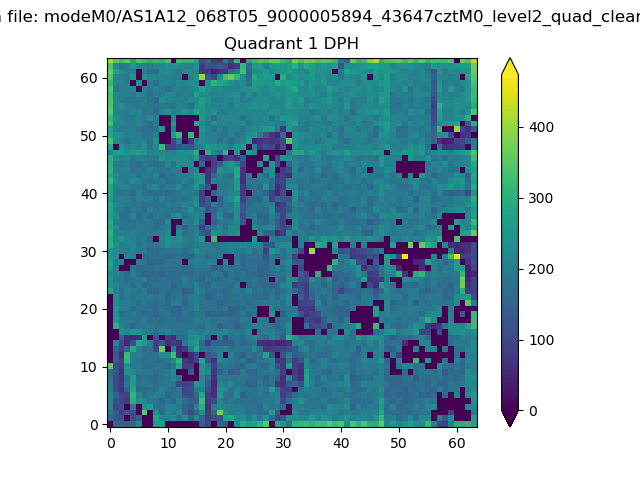
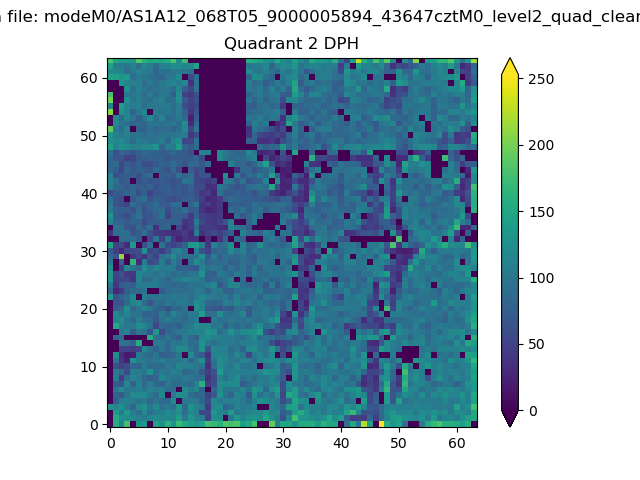
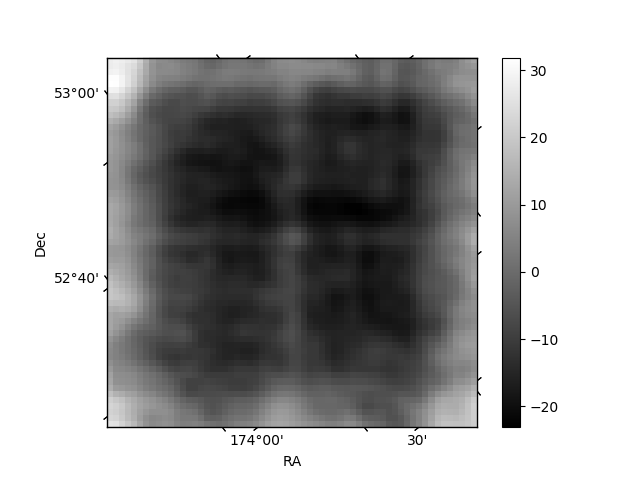
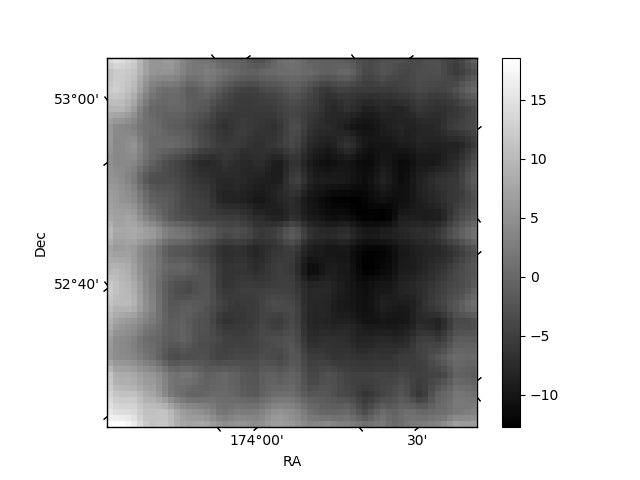
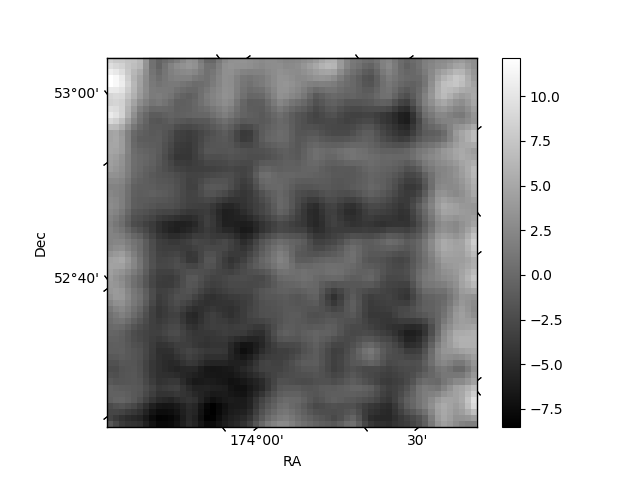
Histogram calculated using DETX and DETY for each event in the final _common_clean file
| Quadrant A | 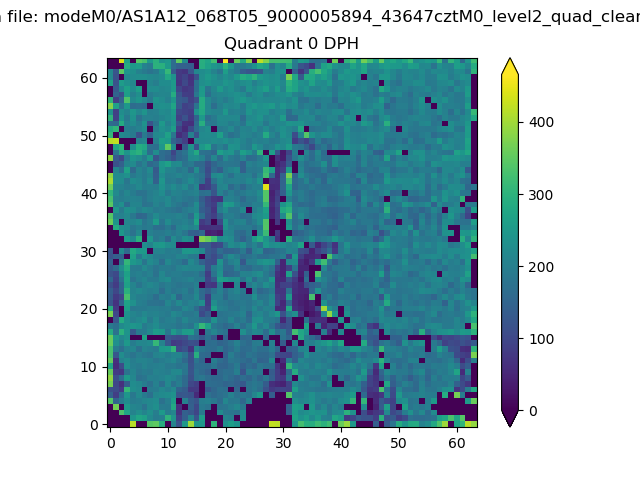 |
 |
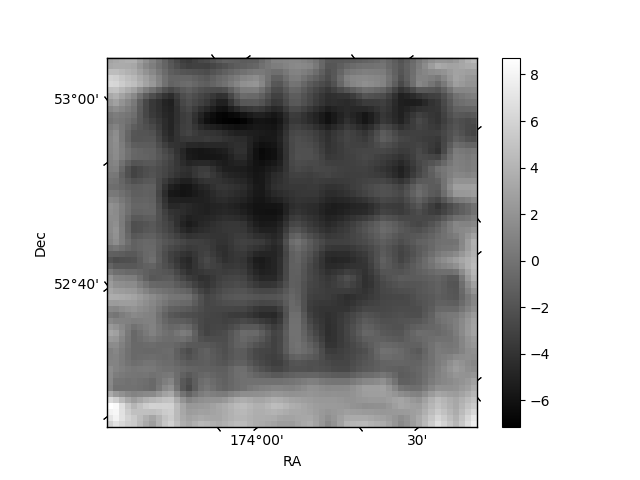
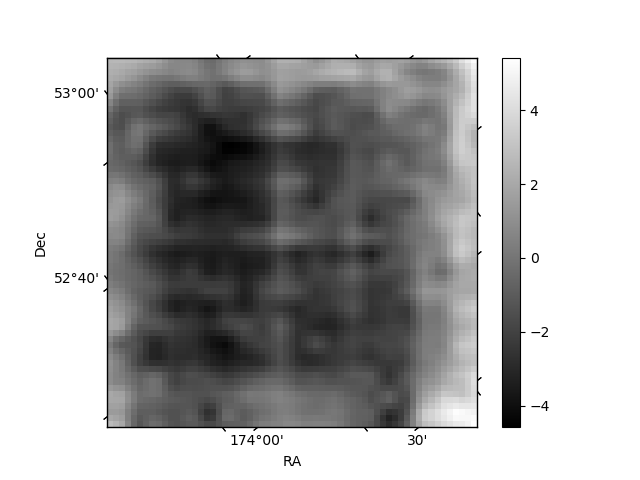
Quadrant B |
|---|---|---|---|
| Quadrant D | 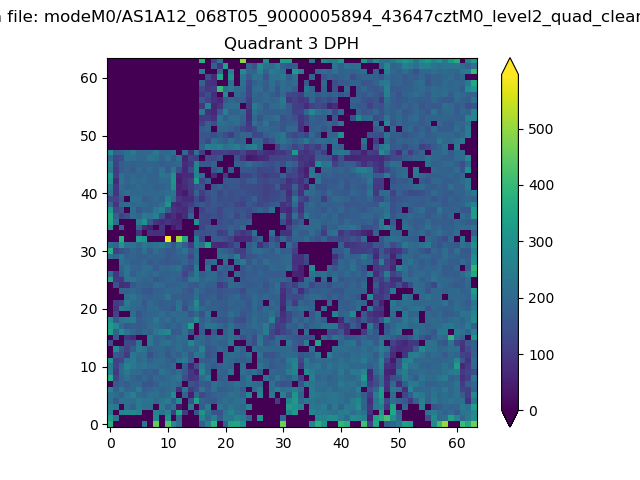 |
 |
Quadrant C |
| Plot type | Count rate plots | Images |
|---|---|---|
| Comparison with Poisson distribution Blue bars denote a histogram of data divided into 1 sec bins. Red curve is a Poisson curve with rate = median count rate of data. |
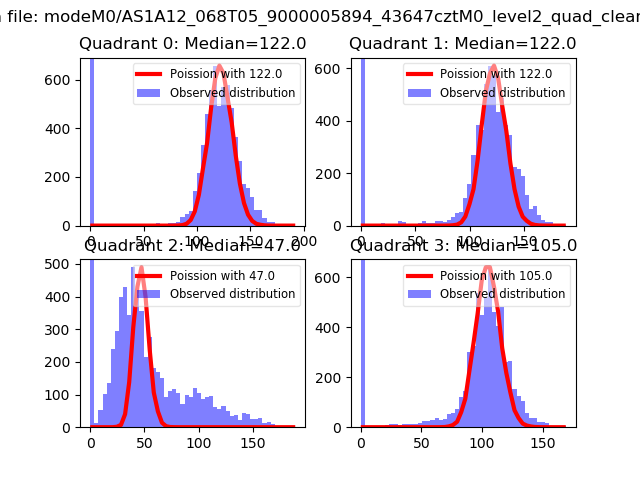 |
 |
| Quadrant-wise count rates Data is divided into 100 sec bins |
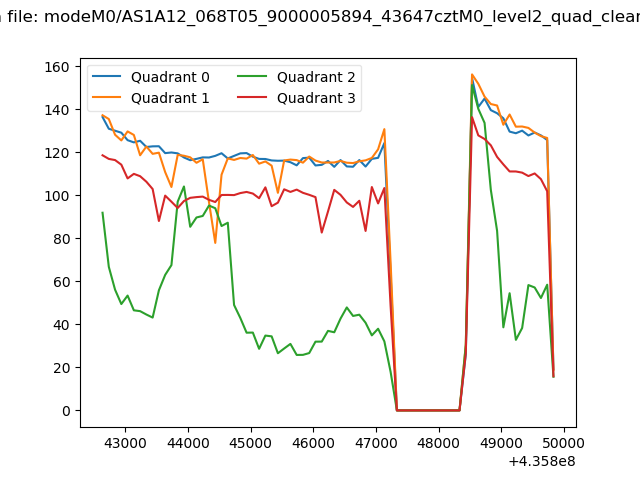 |
|
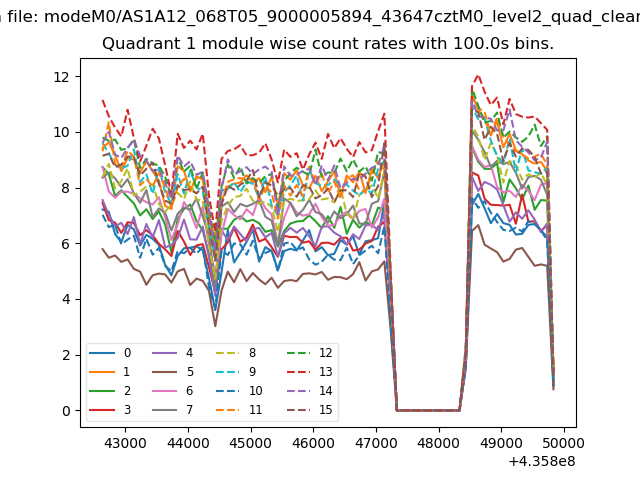
| Module-wise count rates for Quadrant A Data is divided into 100 sec bins |
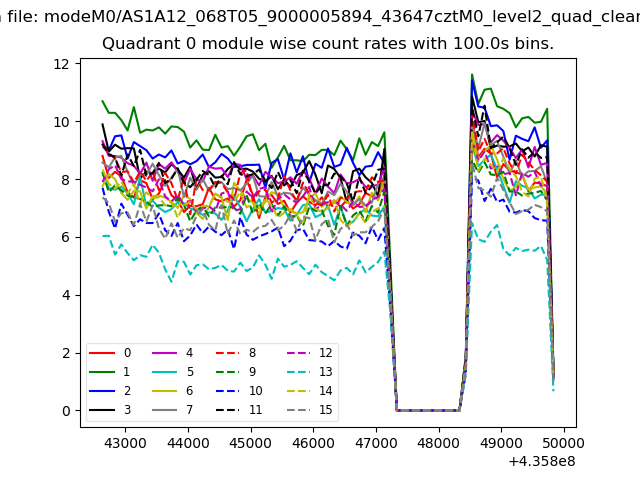 |
 |
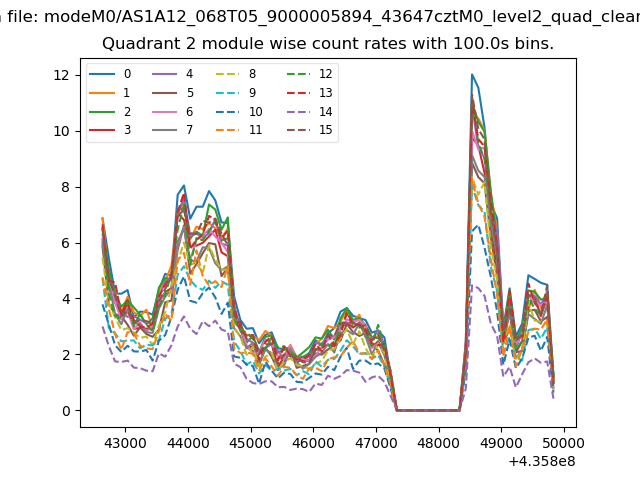
| Module-wise count rates for Quadrant B Data is divided into 100 sec bins |
 |
 |
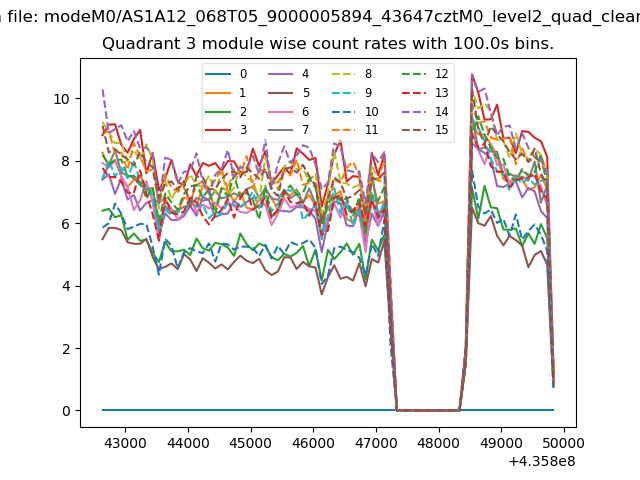
| Module-wise count rates for Quadrant C Data is divided into 100 sec bins |
 |
 |
| Module-wise count rates for Quadrant D Data is divided into 100 sec bins |
 |
 |
| Parameter | Plot |
|---|---|
| CZT HV Monitor | 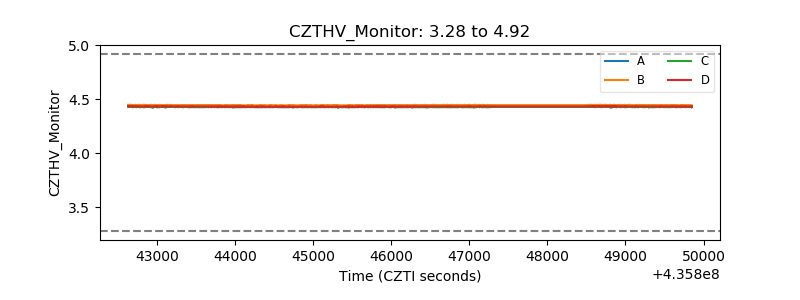 |
| D_VDD | 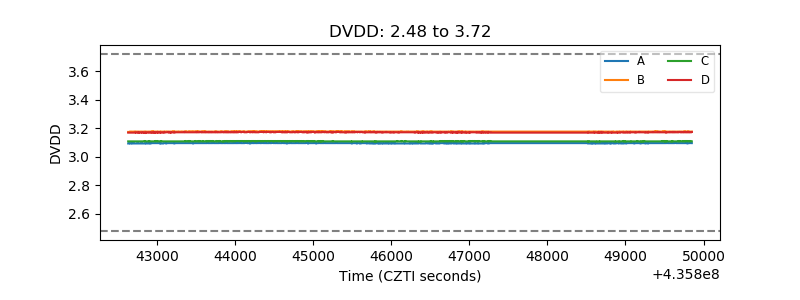 |
| Temperature 1 | 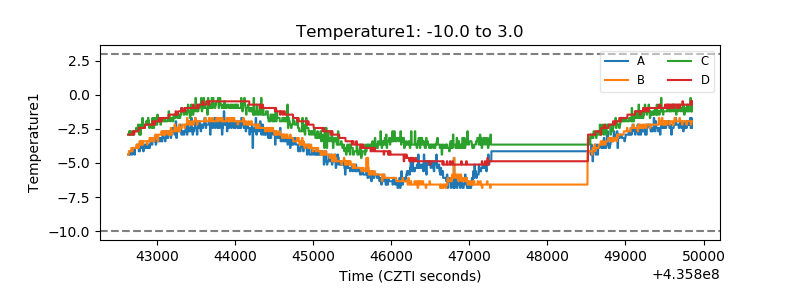 |
| Veto HV Monitor | 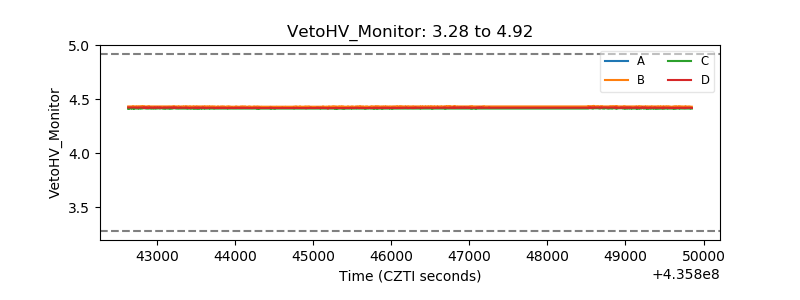 |
| Veto LLD | 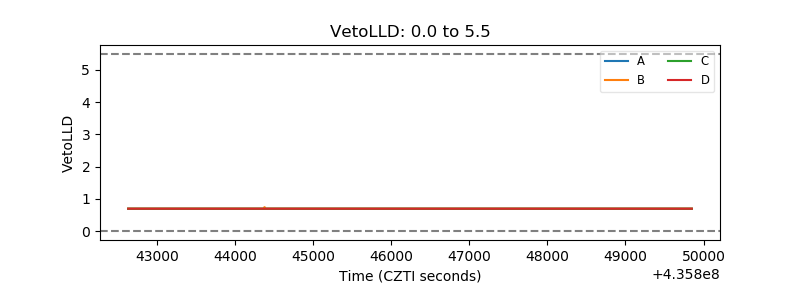 |
| Alpha Counter | 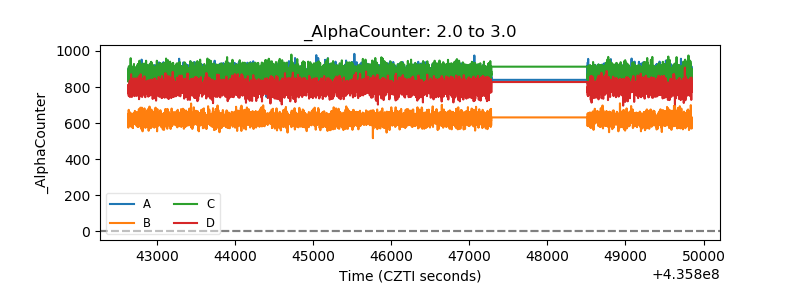 |
| _CPM_Rate | 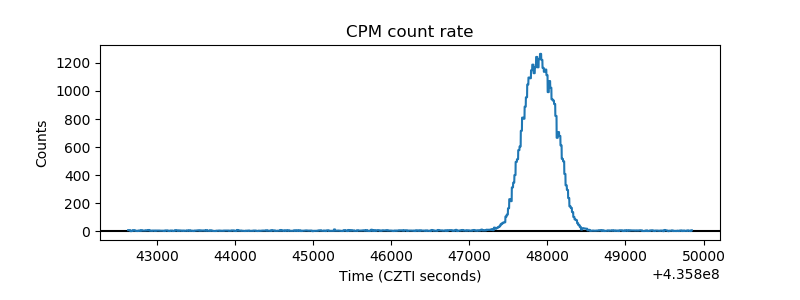 |
| CZT Counter | 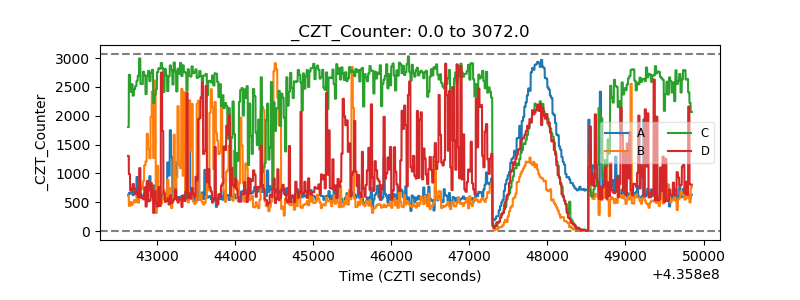 |
| +2.5 Volts monitor | 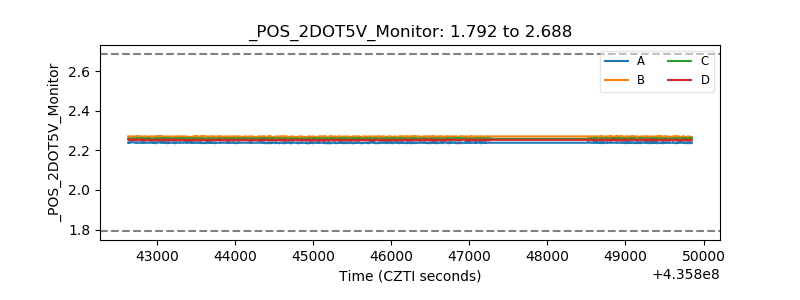 |
| +5 Volts monitor | 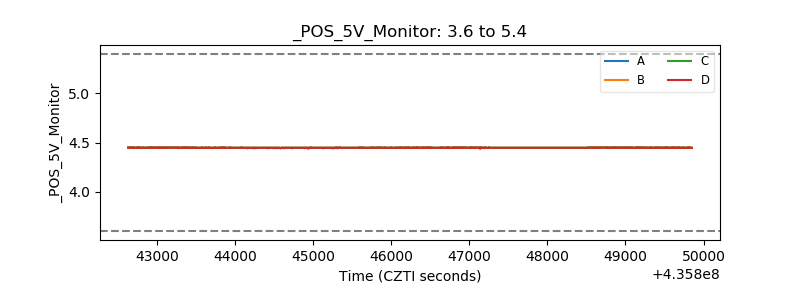 |
| _ROLL_ROT | 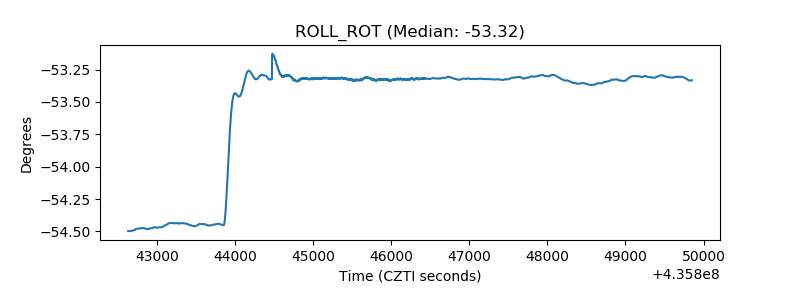 |
| _Roll_DEC | 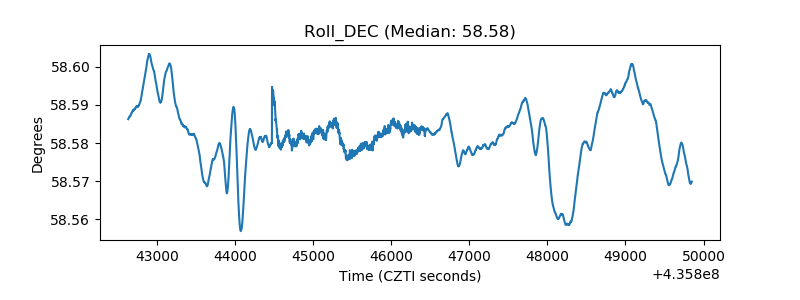 |
| _Roll_RA | 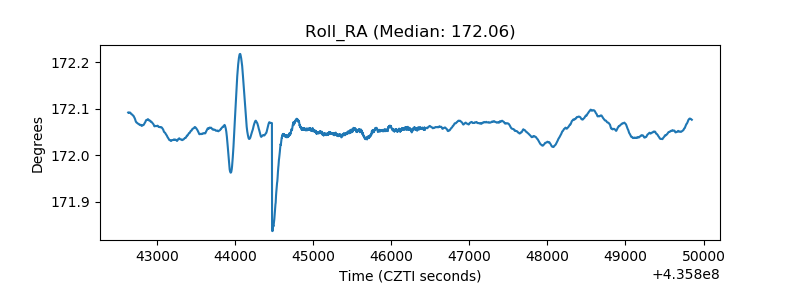 |
| Veto Counter | 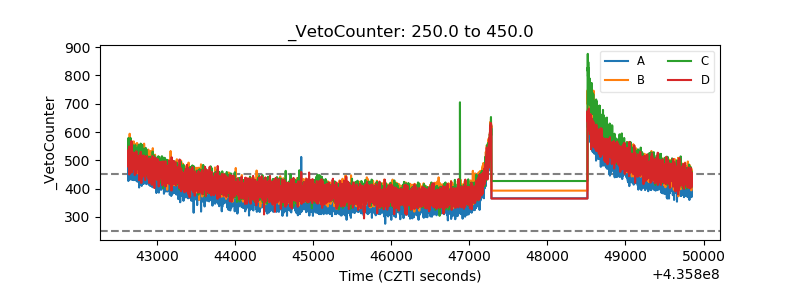 |