| Param | Original file | Final file |
|---|---|---|
| Filename | modeM0/AS1A12_068T05_9000005894_43648cztM0_level2.fits | modeM0/AS1A12_068T05_9000005894_43648cztM0_level2_quad_clean.evt |
| Size (bytes) | 837,578,880 | 97,971,840 |
| Size | 798.8 MB | 93.4 MB |
| Events in quadrant A | 4,084,378 | 760,923 |
| Events in quadrant B | 3,871,816 | 760,491 |
| Events in quadrant C | 14,920,545 | 383,001 |
| Events in quadrant D | 7,647,465 | 626,423 |
| Mode SS | |||
|---|---|---|---|
| Quadrant | BADHDUFLAG | Total packets | Discarded packets |
| A | 0 | 126 | 0 |
| B | 0 | 126 | 0 |
| C | 0 | 126 | 0 |
| D | 0 | 126 | 0 |
| Mode M9 | |||
|---|---|---|---|
| Quadrant | BADHDUFLAG | Total packets | Discarded packets |
| A | 0 | 12 | 0 |
| B | 0 | 12 | 0 |
| C | 0 | 12 | 0 |
| D | 0 | 12 | 0 |
| Mode M0 | |||
|---|---|---|---|
| Quadrant | BADHDUFLAG | Total packets | Discarded packets |
| A | 0 | 16784 | 1 |
| B | 0 | 15465 | 1 |
| C | 0 | 48566 | 5 |
| D | 0 | 27109 | 1 |
| Quadrant | Total seconds | Saturated seconds | Saturation percentage |
|---|---|---|---|
| A | 6199 | 122 | 1.968059% |
| B | 6199 | 199 | 3.210195% |
| C | 6198 | 5381 | 86.818328% |
| D | 6198 | 1224 | 19.748306% |
Noise dominated data is calculated using 1-second bins in cleaned event files. If a bin has >2000 counts, and if more than 50% of those come from <1% of pixels, then it is considered to be noise-dominated and hence unusable.
| Quadrant | # 1 sec bins | Bins with >0 counts | Bins with >2000 counts | High rate bins dominated by noise | Noise dominated (total time) | Noise dominated (detector-on time) | Marked lightcurve |
|---|---|---|---|---|---|---|---|
| A | 7379 | 6200 | 9 | 9 | 0.12% | 0.15% | 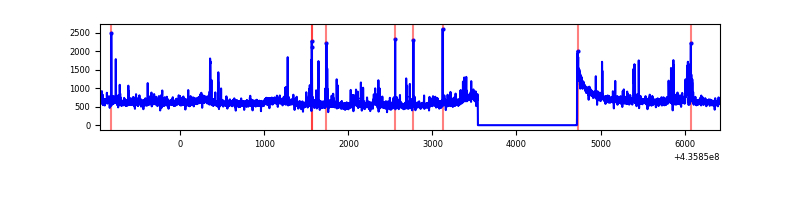 |
| B | 7379 | 6199 | 105 | 105 | 1.42% | 1.69% | 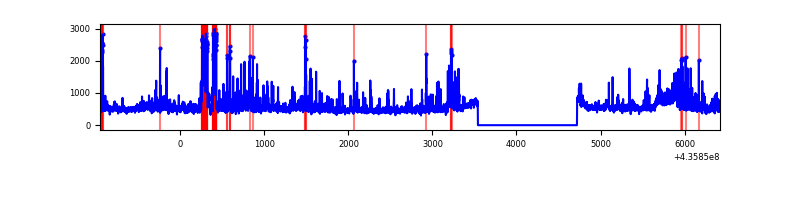 |
| C | 7378 | 6198 | 5300 | 5300 | 71.84% | 85.51% | 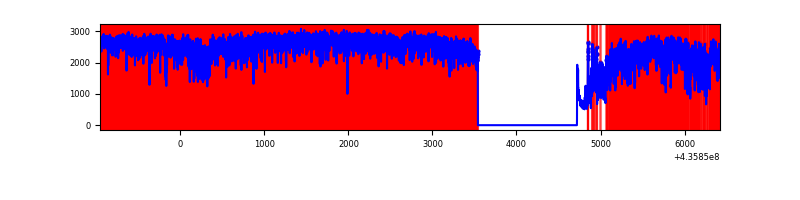 |
| D | 7378 | 6198 | 1022 | 1022 | 13.85% | 16.49% | 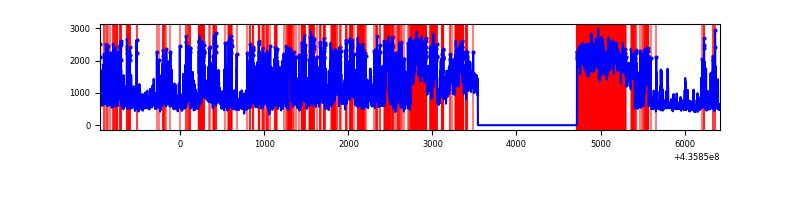 |
Top three noisy pixels from each quadrant. If the there are fewer than three noisy pixels in the level2.evt file, extra rows are filled as -1
| Pixel properties | Quadrant properties | ||||||
|---|---|---|---|---|---|---|---|
| Quadrant | DetID | PixID | Counts | Sigma | Mean | Median | Sigma |
| A | 10 | 83 | 813053 | 5431.62 | 733 | 719 | 149.6 |
| A | 2 | 79 | 85049 | 563.87 | 733 | 719 | 149.6 |
| A | 15 | 222 | 70600 | 467.25 | 733 | 719 | 149.6 |
| B | 5 | 235 | 409103 | 2983.62 | 717 | 695 | 136.9 |
| B | 4 | 206 | 222288 | 1618.84 | 717 | 695 | 136.9 |
| B | 10 | 128 | 103629 | 751.98 | 717 | 695 | 136.9 |
| C | 15 | 142 | 7471668 | 83532.46 | 383 | 385 | 89.4 |
| C | 15 | 158 | 1587980 | 17750.06 | 383 | 385 | 89.4 |
| C | 3 | 233 | 1544721 | 17266.4 | 383 | 385 | 89.4 |
| D | 8 | 192 | 1241157 | 7142.21 | 680 | 659 | 173.7 |
| D | 4 | 221 | 474698 | 2729.3 | 680 | 659 | 173.7 |
| D | 12 | 6 | 430286 | 2473.59 | 680 | 659 | 173.7 |
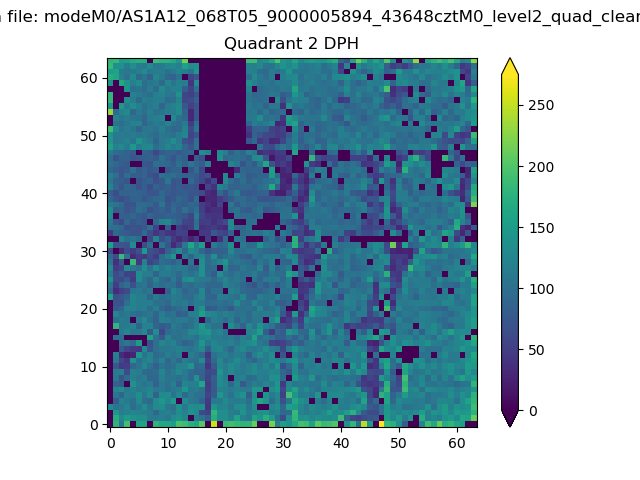
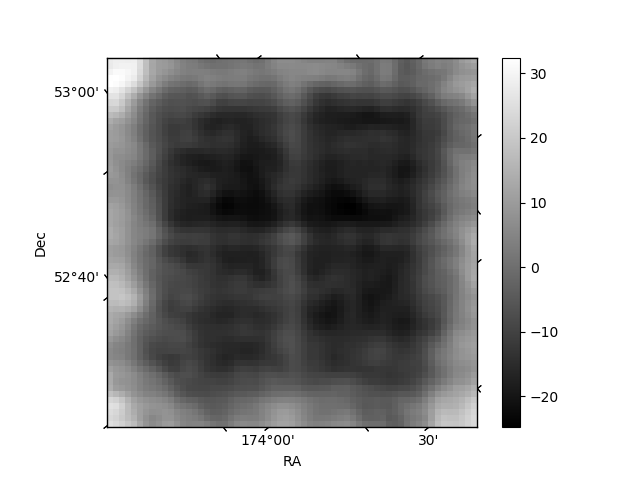
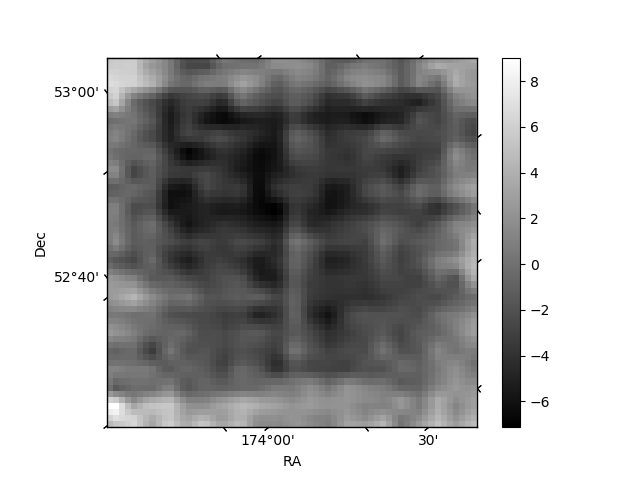
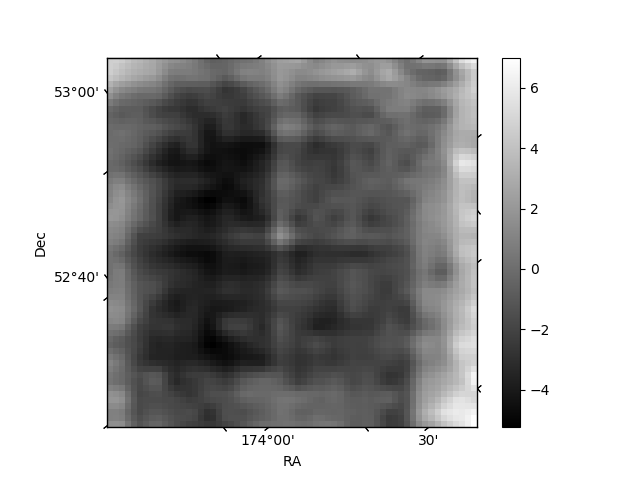
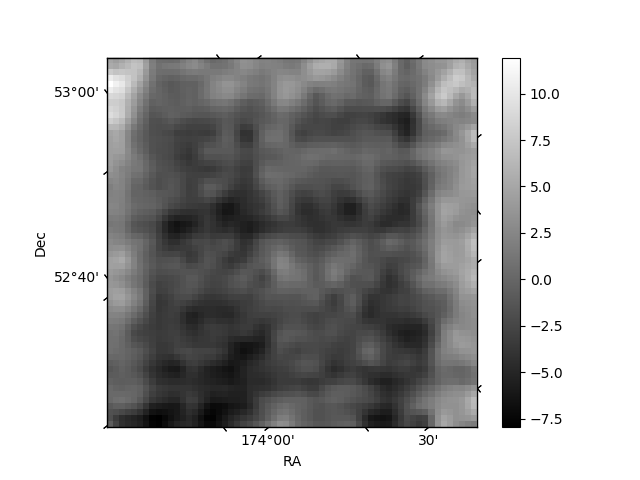
Histogram calculated using DETX and DETY for each event in the final _common_clean file
| Quadrant A | 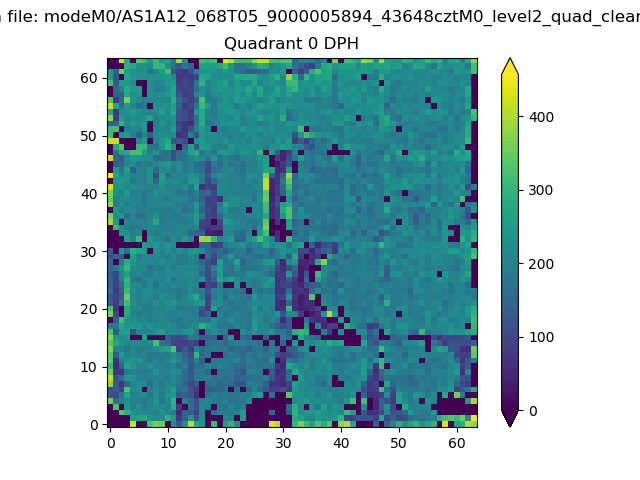 |
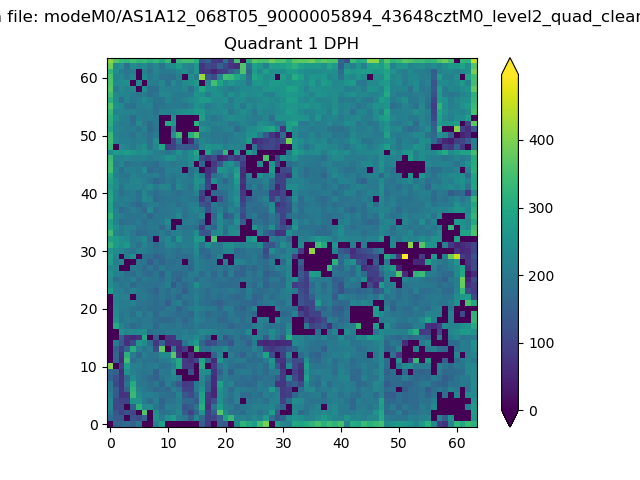 |
Quadrant B |
|---|---|---|---|
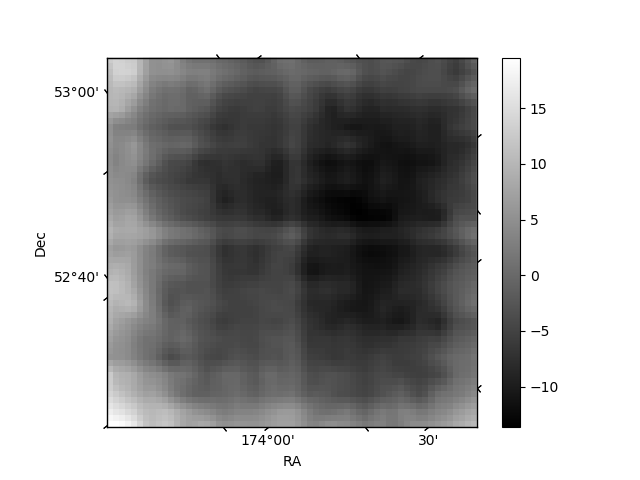
| Quadrant D | 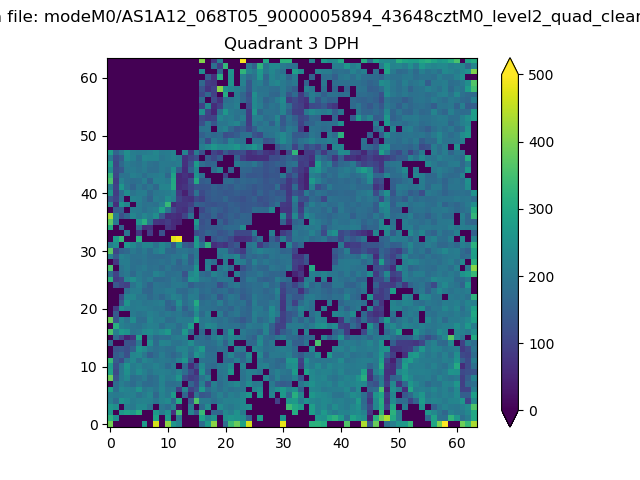 |
 |
Quadrant C |
| Plot type | Count rate plots | Images |
|---|---|---|
| Comparison with Poisson distribution Blue bars denote a histogram of data divided into 1 sec bins. Red curve is a Poisson curve with rate = median count rate of data. |
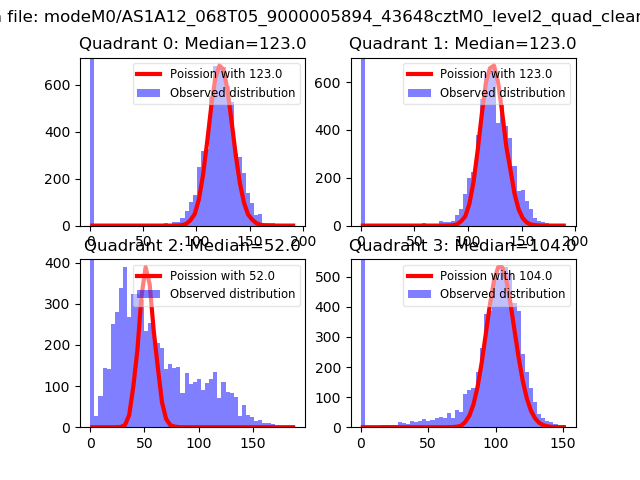 |
 |
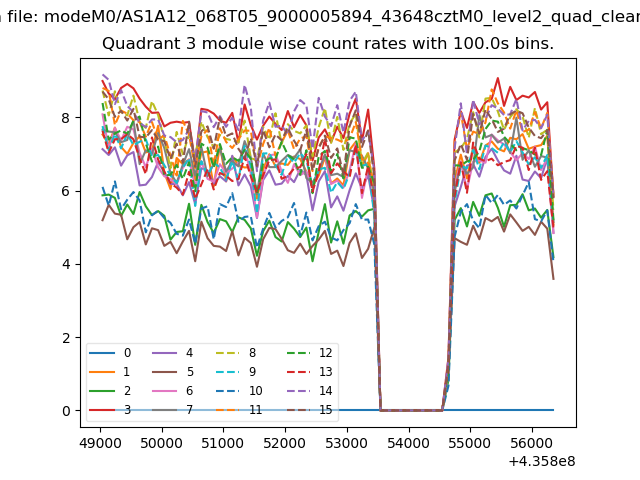
| Quadrant-wise count rates Data is divided into 100 sec bins |
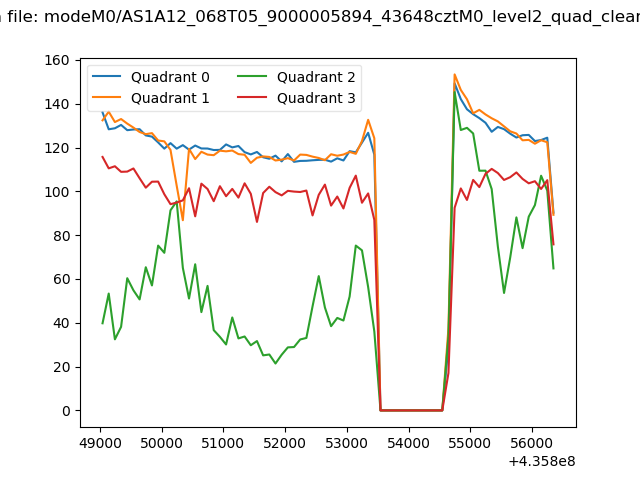 |
|
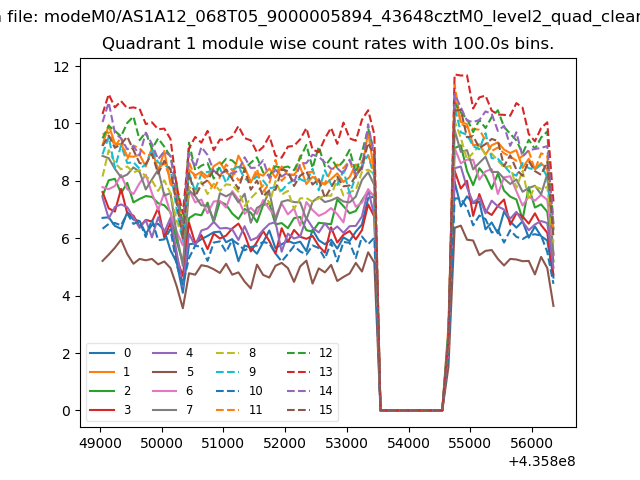
| Module-wise count rates for Quadrant A Data is divided into 100 sec bins |
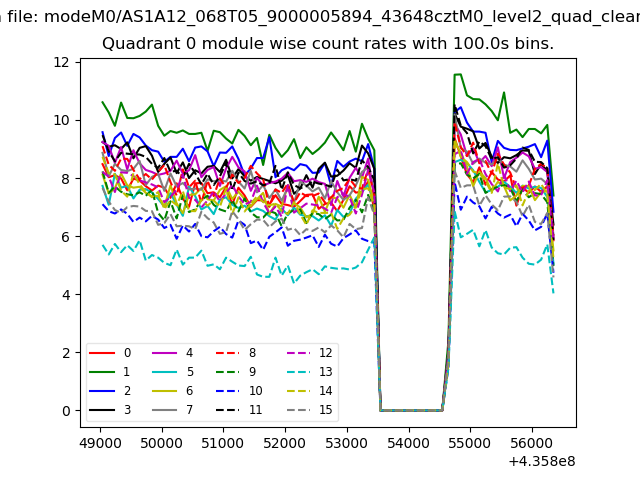 |
 |
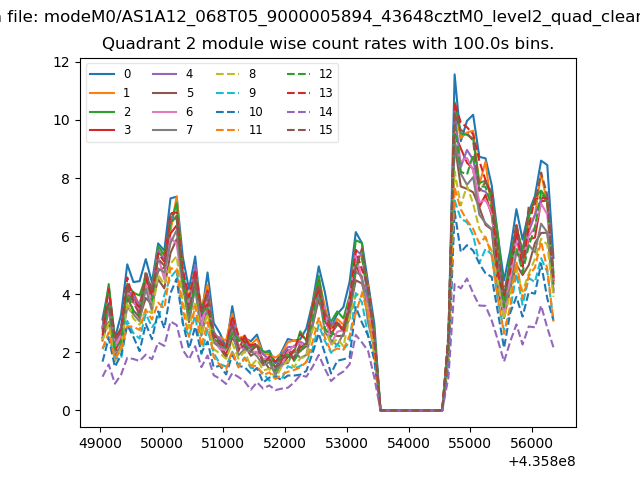
| Module-wise count rates for Quadrant B Data is divided into 100 sec bins |
 |
 |
| Module-wise count rates for Quadrant C Data is divided into 100 sec bins |
 |
 |
| Module-wise count rates for Quadrant D Data is divided into 100 sec bins |
 |
 |
| Parameter | Plot |
|---|---|
| CZT HV Monitor | 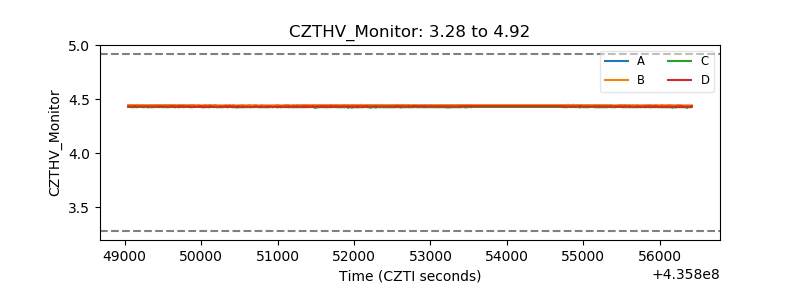 |
| D_VDD | 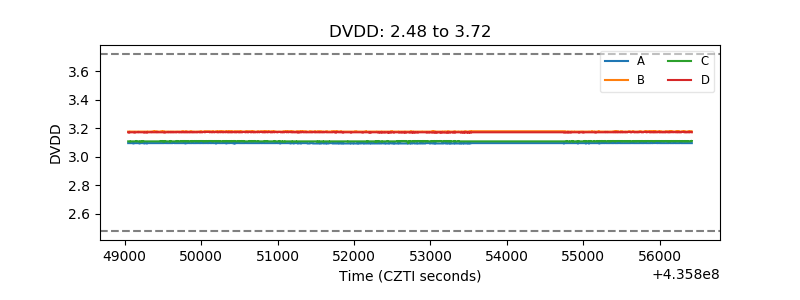 |
| Temperature 1 | 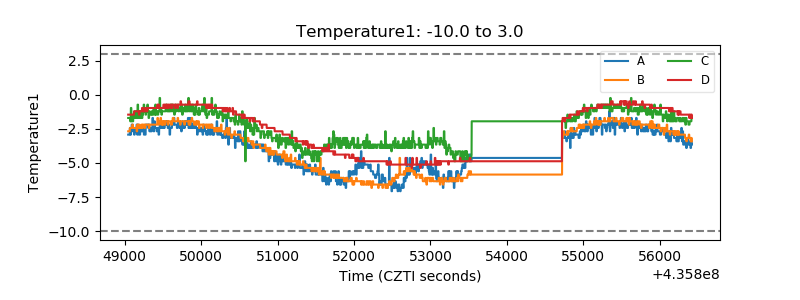 |
| Veto HV Monitor | 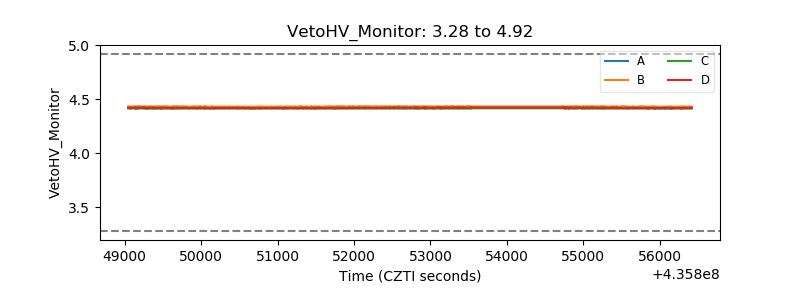 |
| Veto LLD | 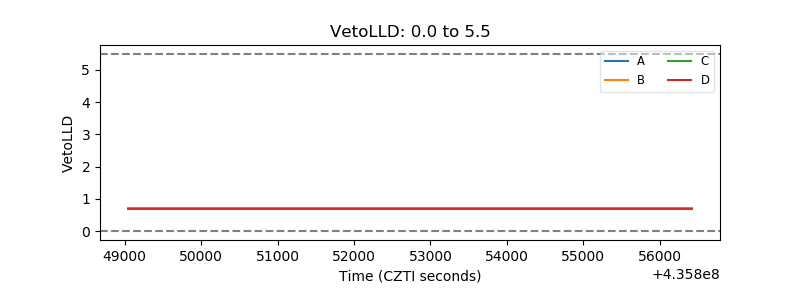 |
| Alpha Counter | 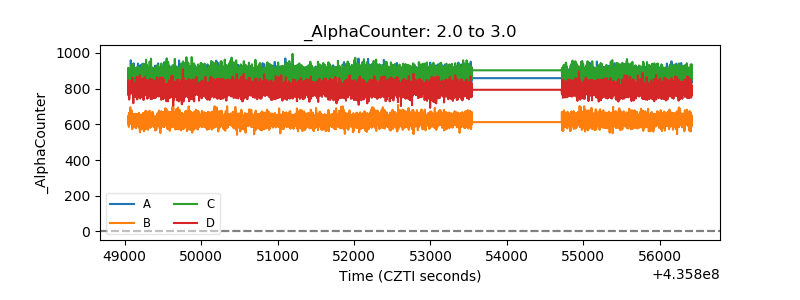 |
| _CPM_Rate | 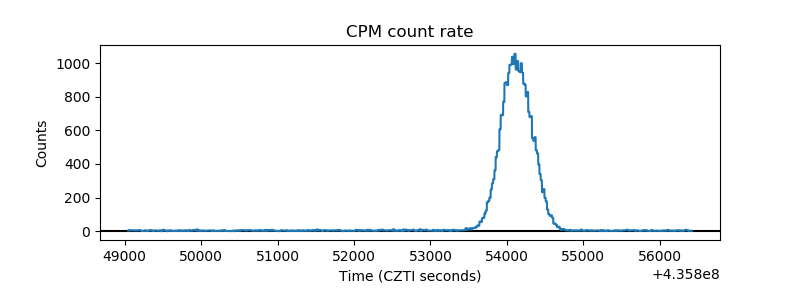 |
| CZT Counter | 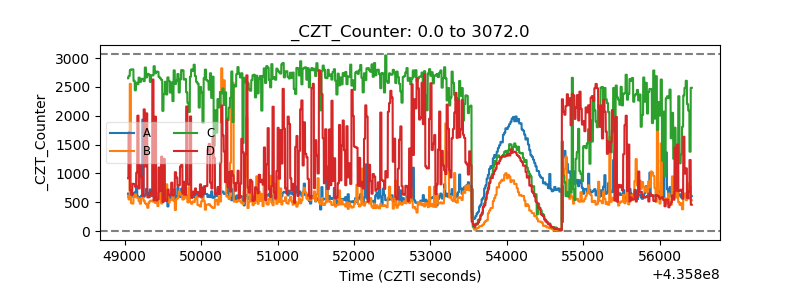 |
| +2.5 Volts monitor | 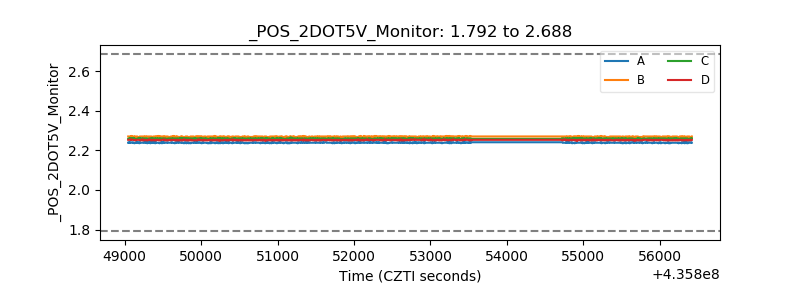 |
| +5 Volts monitor | 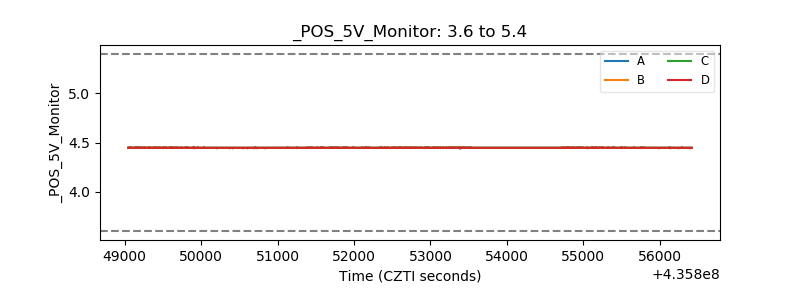 |
| _ROLL_ROT | 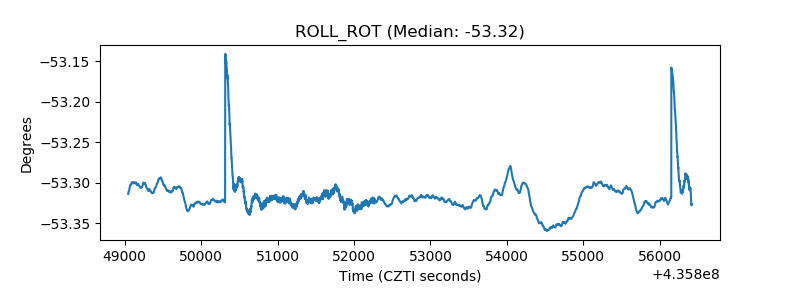 |
| _Roll_DEC | 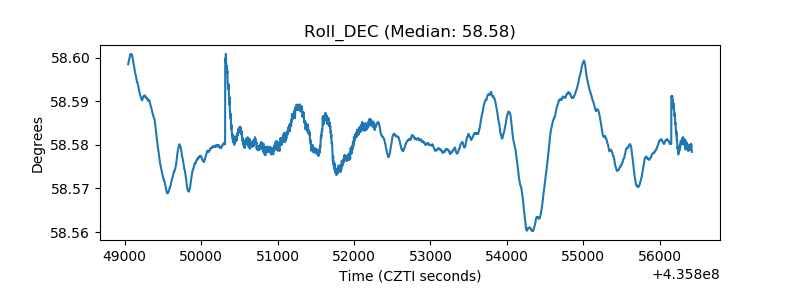 |
| _Roll_RA | 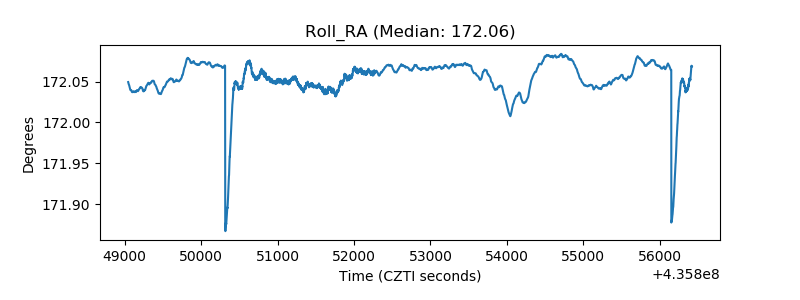 |
| Veto Counter | 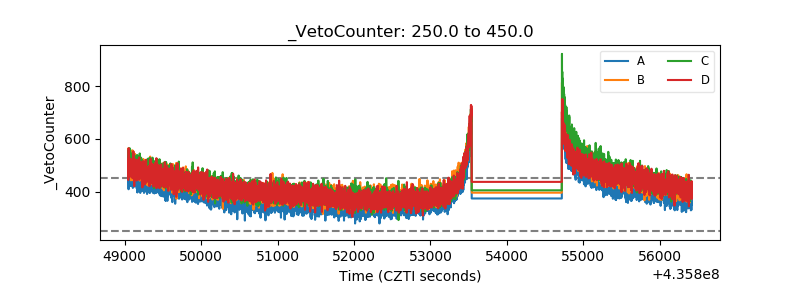 |