| Param | Original file | Final file |
|---|---|---|
| Filename | modeM0/AS1A12_068T05_9000005894_43650cztM0_level2.fits | modeM0/AS1A12_068T05_9000005894_43650cztM0_level2_quad_clean.evt |
| Size (bytes) | 1,000,131,840 | 77,702,400 |
| Size | 953.8 MB | 74.1 MB |
| Events in quadrant A | 4,251,725 | 678,142 |
| Events in quadrant B | 4,301,220 | 671,630 |
| Events in quadrant C | 14,366,588 | 311,659 |
| Events in quadrant D | 13,641,132 | 269,669 |
| Mode SS | |||
|---|---|---|---|
| Quadrant | BADHDUFLAG | Total packets | Discarded packets |
| A | 0 | 120 | 0 |
| B | 0 | 120 | 0 |
| C | 0 | 120 | 0 |
| D | 0 | 120 | 0 |
| Mode M9 | |||
|---|---|---|---|
| Quadrant | BADHDUFLAG | Total packets | Discarded packets |
| A | 0 | 10 | 0 |
| B | 0 | 10 | 0 |
| C | 0 | 10 | 0 |
| D | 0 | 10 | 0 |
| Mode M0 | |||
|---|---|---|---|
| Quadrant | BADHDUFLAG | Total packets | Discarded packets |
| A | 0 | 16572 | 1 |
| B | 0 | 17005 | 1 |
| C | 0 | 46772 | 1 |
| D | 0 | 44483 | 9 |
| Quadrant | Total seconds | Saturated seconds | Saturation percentage |
|---|---|---|---|
| A | 5970 | 275 | 4.606365% |
| B | 5970 | 507 | 8.492462% |
| C | 5970 | 5238 | 87.738693% |
| D | 5969 | 4435 | 74.300553% |
Noise dominated data is calculated using 1-second bins in cleaned event files. If a bin has >2000 counts, and if more than 50% of those come from <1% of pixels, then it is considered to be noise-dominated and hence unusable.
| Quadrant | # 1 sec bins | Bins with >0 counts | Bins with >2000 counts | High rate bins dominated by noise | Noise dominated (total time) | Noise dominated (detector-on time) | Marked lightcurve |
|---|---|---|---|---|---|---|---|
| A | 6920 | 5971 | 168 | 168 | 2.43% | 2.81% | 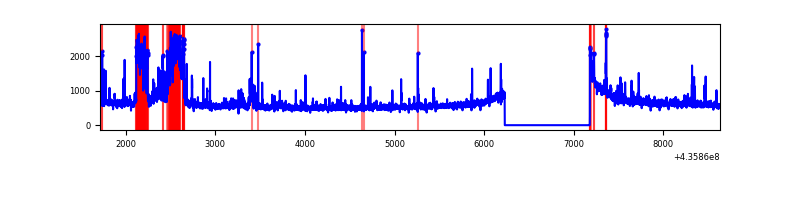 |
| B | 6920 | 5970 | 281 | 281 | 4.06% | 4.71% | 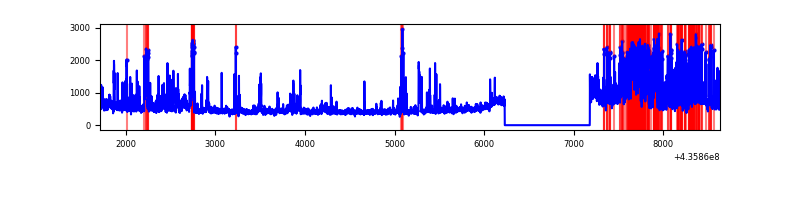 |
| C | 6920 | 5970 | 5087 | 5087 | 73.51% | 85.21% | 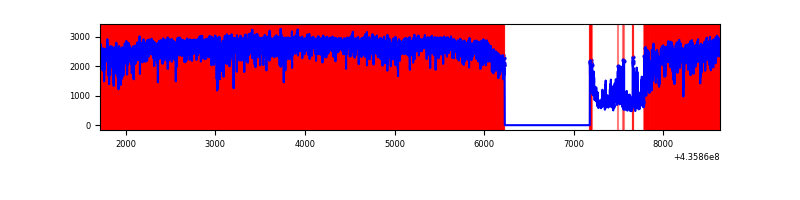 |
| D | 6919 | 5969 | 4436 | 4436 | 64.11% | 74.32% | 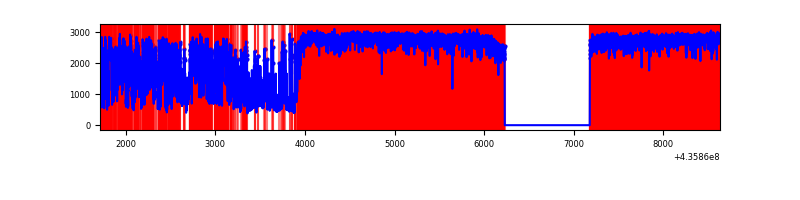 |
Top three noisy pixels from each quadrant. If the there are fewer than three noisy pixels in the level2.evt file, extra rows are filled as -1
| Pixel properties | Quadrant properties | ||||||
|---|---|---|---|---|---|---|---|
| Quadrant | DetID | PixID | Counts | Sigma | Mean | Median | Sigma |
| A | 10 | 83 | 780081 | 5588.81 | 672 | 656 | 139.5 |
| A | 15 | 223 | 565418 | 4049.58 | 672 | 656 | 139.5 |
| A | 15 | 222 | 102004 | 726.71 | 672 | 656 | 139.5 |
| B | 12 | 32 | 944200 | 7364.19 | 657 | 635 | 128.1 |
| B | 4 | 206 | 227102 | 1767.49 | 657 | 635 | 128.1 |
| B | 5 | 235 | 185989 | 1446.62 | 657 | 635 | 128.1 |
| C | 15 | 142 | 10273720 | 133047.1 | 328 | 328 | 77.2 |
| C | 3 | 233 | 1021255 | 13221.67 | 328 | 328 | 77.2 |
| C | 15 | 157 | 753550 | 9754.71 | 328 | 328 | 77.2 |
| D | 8 | 192 | 9407237 | 113603.51 | 305 | 294 | 82.8 |
| D | 12 | 6 | 1473834 | 17795.29 | 305 | 294 | 82.8 |
| D | 14 | 210 | 221877 | 2675.96 | 305 | 294 | 82.8 |
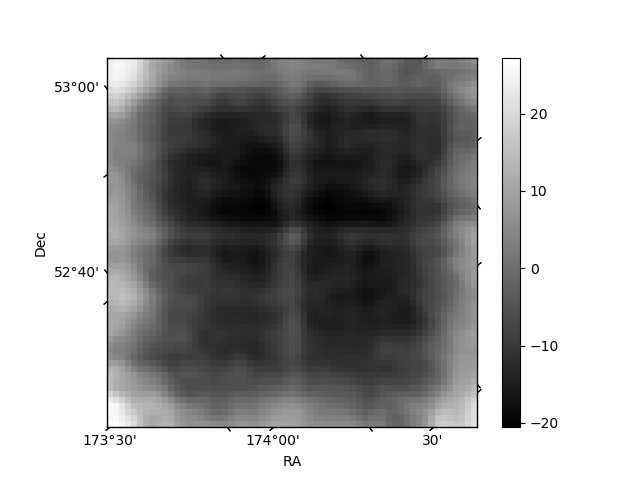
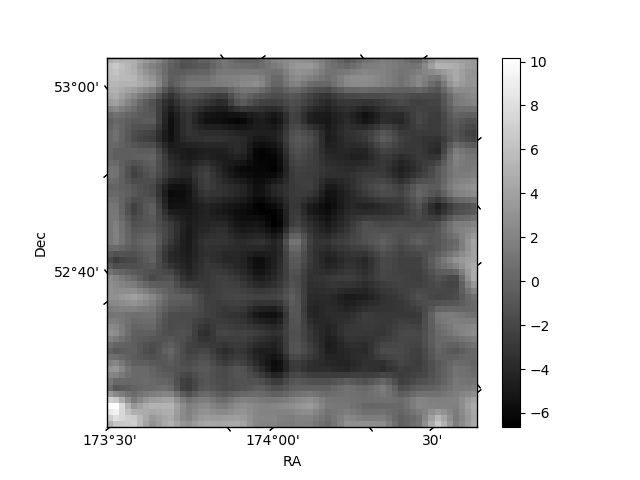
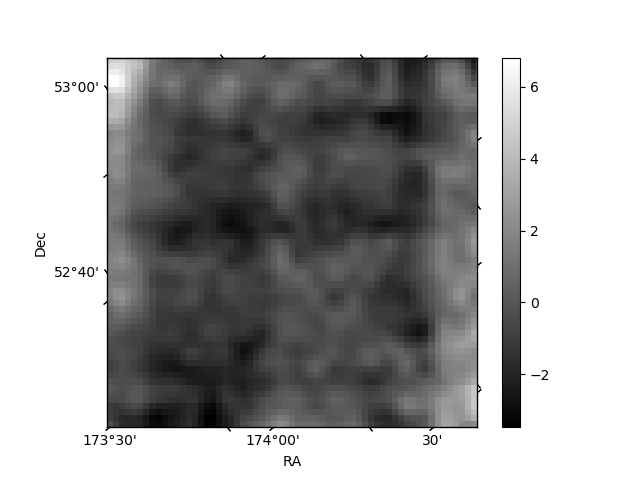
Histogram calculated using DETX and DETY for each event in the final _common_clean file
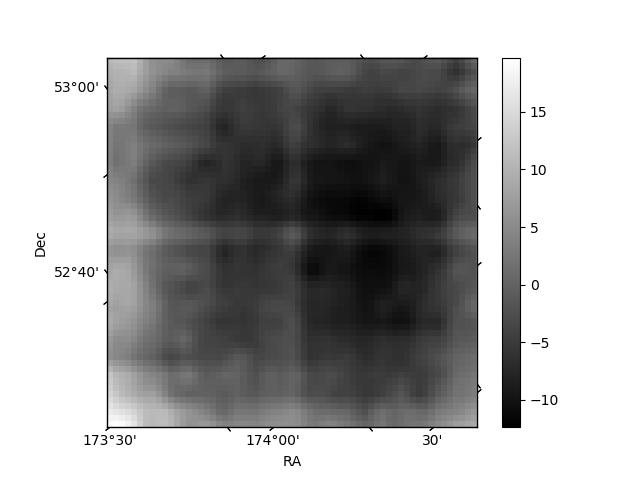
| Quadrant A | 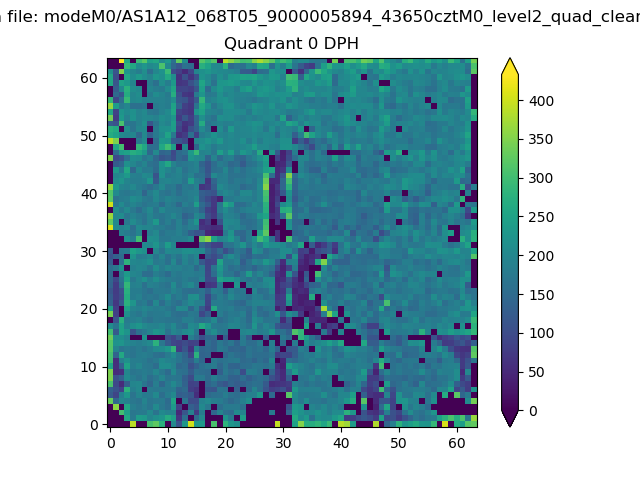 |
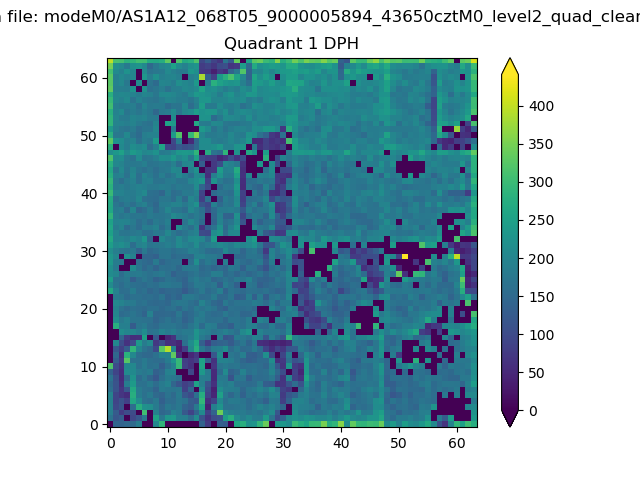 |
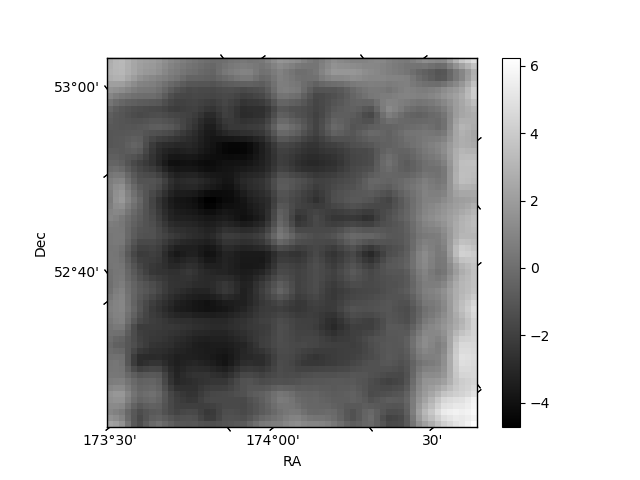
Quadrant B |
|---|---|---|---|
| Quadrant D | 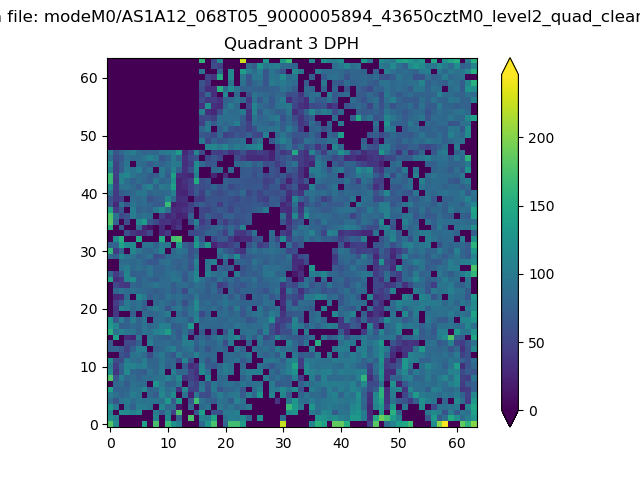 |
 |
Quadrant C |
| Plot type | Count rate plots | Images |
|---|---|---|
| Comparison with Poisson distribution Blue bars denote a histogram of data divided into 1 sec bins. Red curve is a Poisson curve with rate = median count rate of data. |
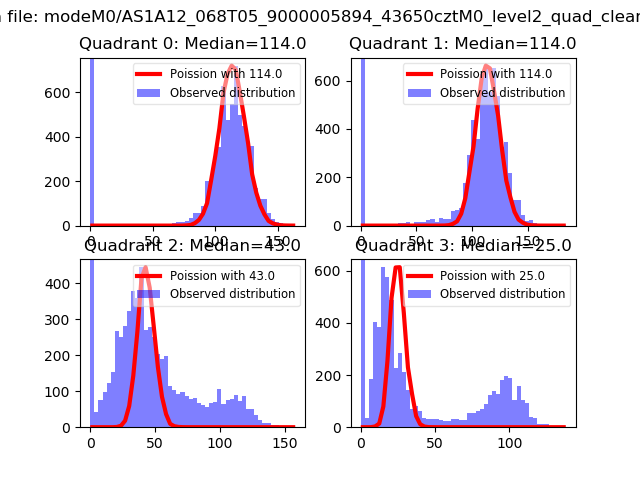 |
 |
| Quadrant-wise count rates Data is divided into 100 sec bins |
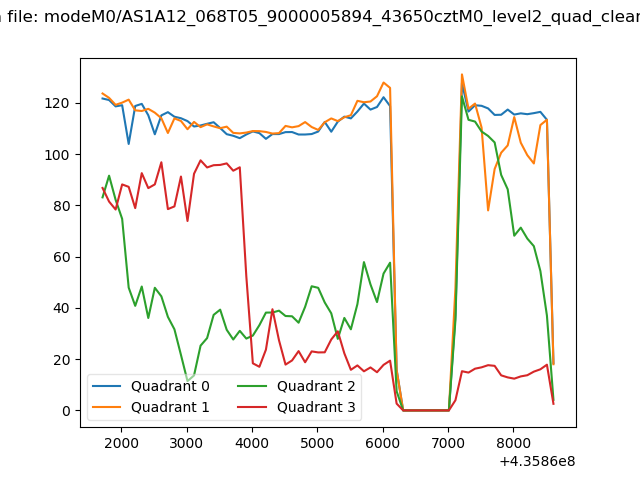 |
|
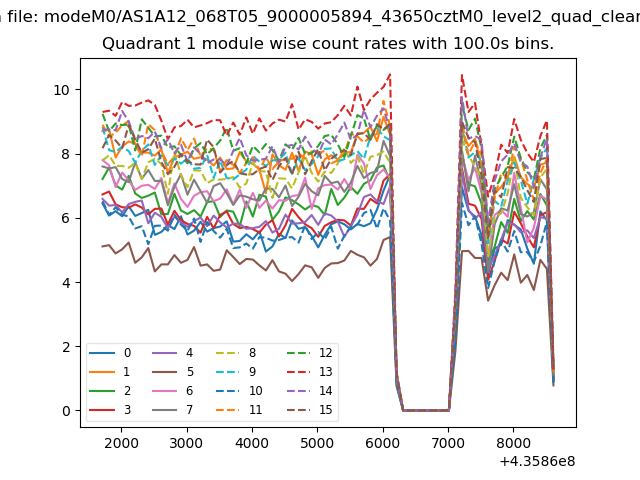
| Module-wise count rates for Quadrant A Data is divided into 100 sec bins |
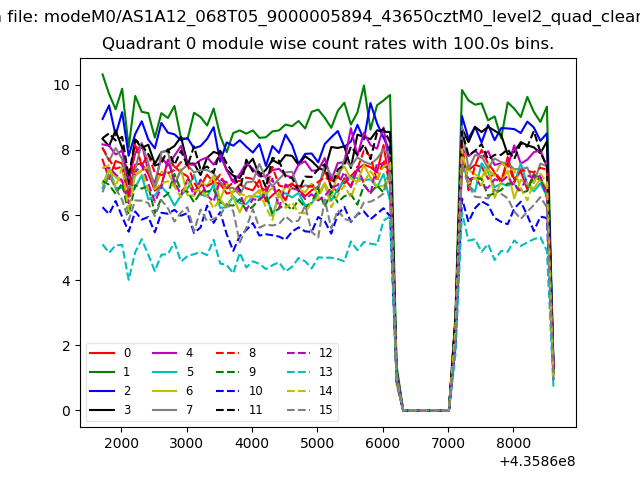 |
 |
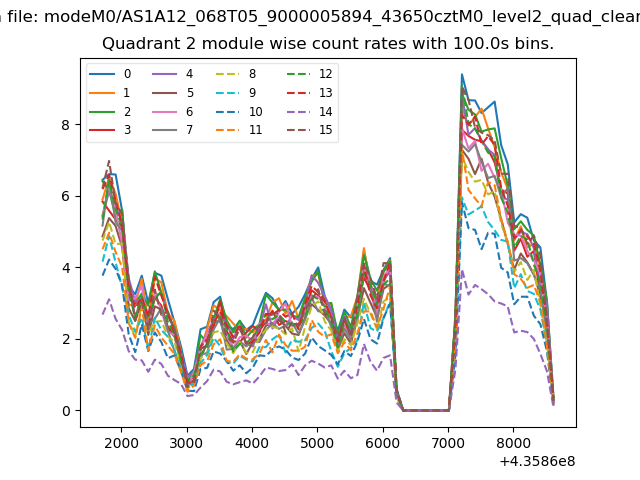
| Module-wise count rates for Quadrant B Data is divided into 100 sec bins |
 |
 |
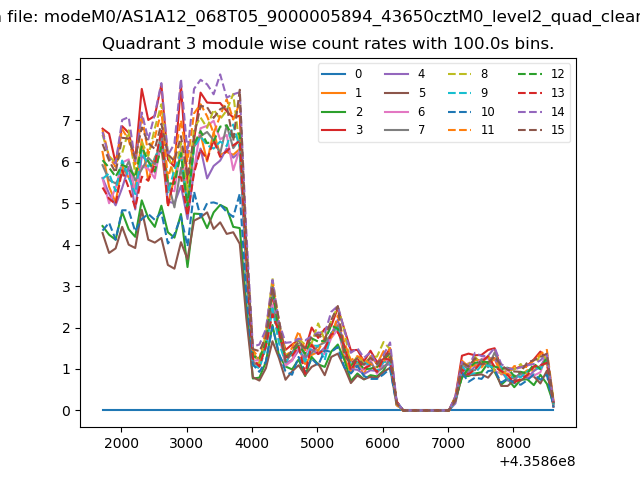
| Module-wise count rates for Quadrant C Data is divided into 100 sec bins |
 |
 |
| Module-wise count rates for Quadrant D Data is divided into 100 sec bins |
 |
 |
| Parameter | Plot |
|---|---|
| CZT HV Monitor | 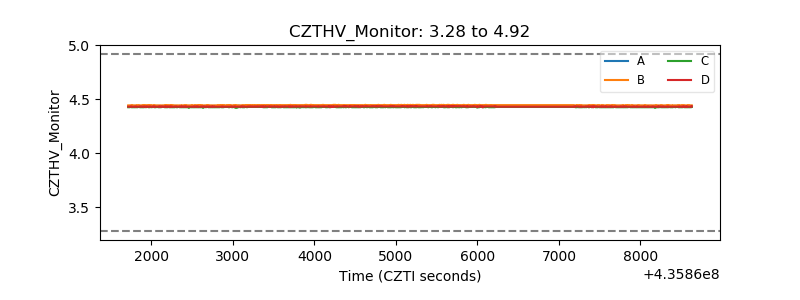 |
| D_VDD | 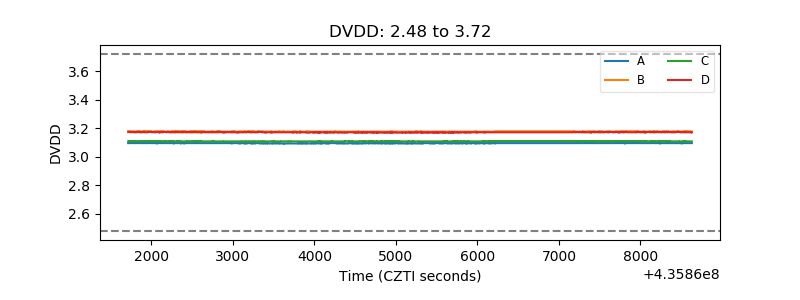 |
| Temperature 1 | 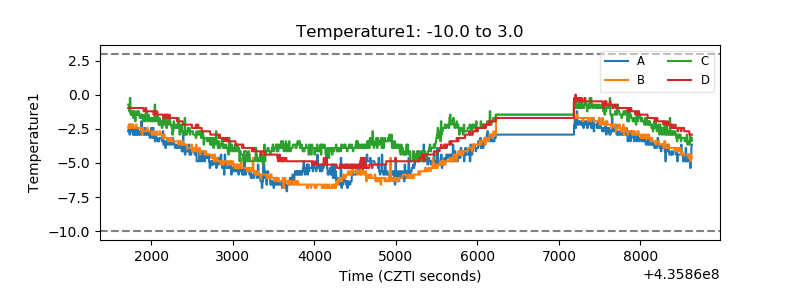 |
| Veto HV Monitor |  |
| Veto LLD | 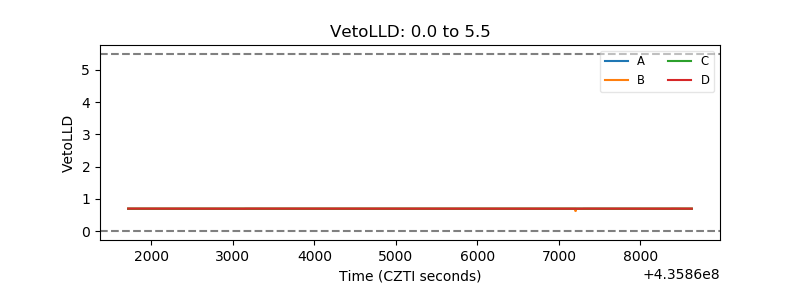 |
| Alpha Counter | 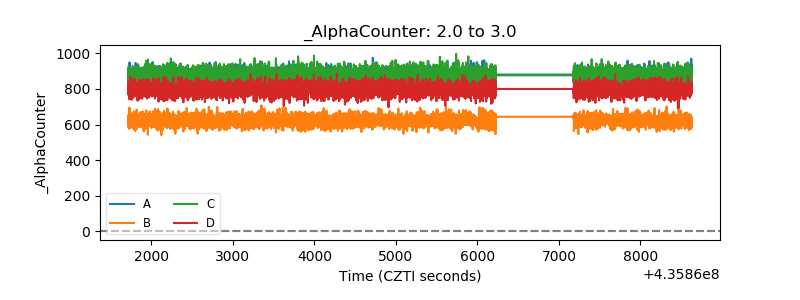 |
| _CPM_Rate | 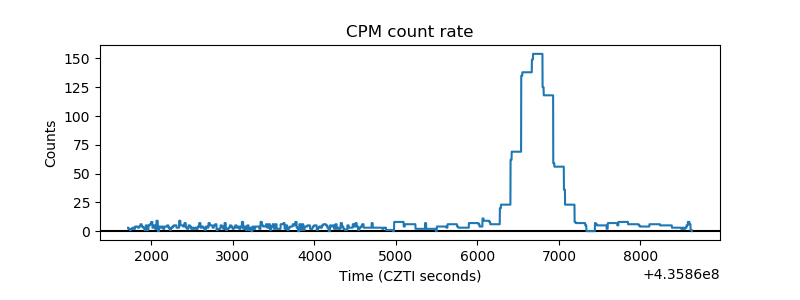 |
| CZT Counter | 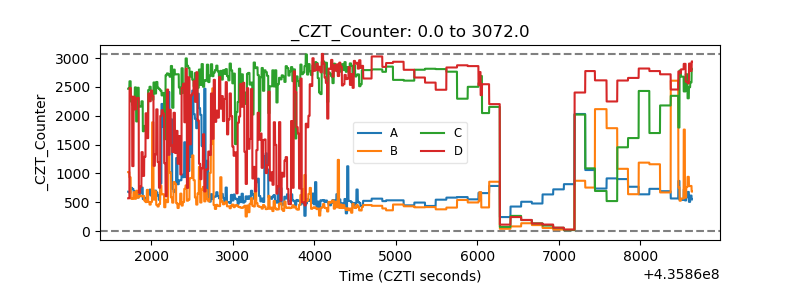 |
| +2.5 Volts monitor | 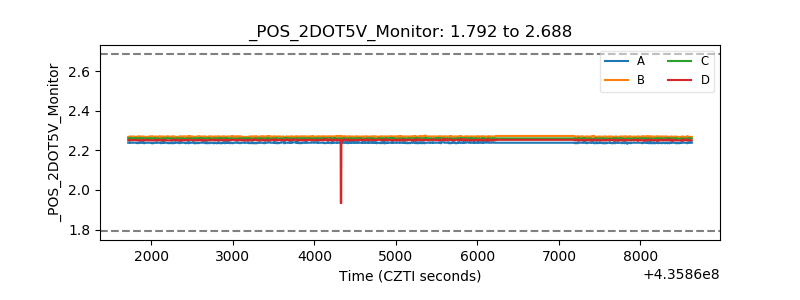 |
| +5 Volts monitor | 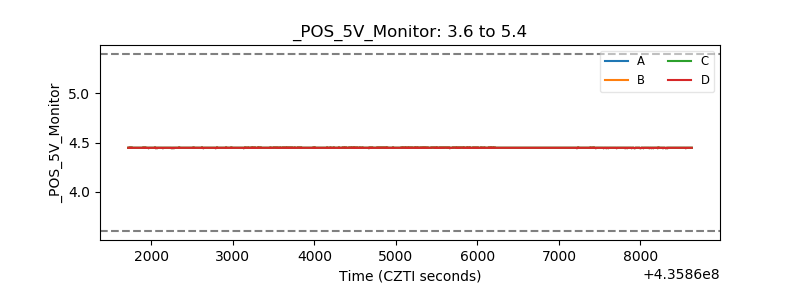 |
| _ROLL_ROT | 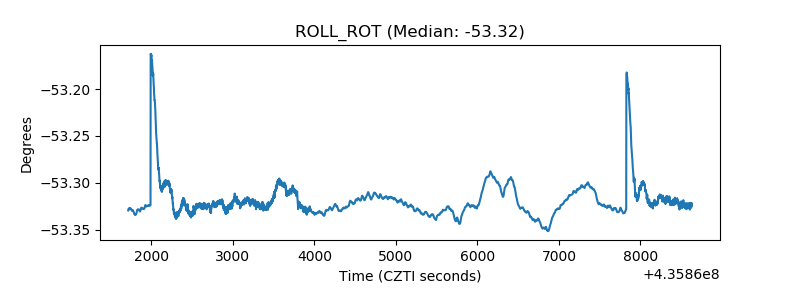 |
| _Roll_DEC | 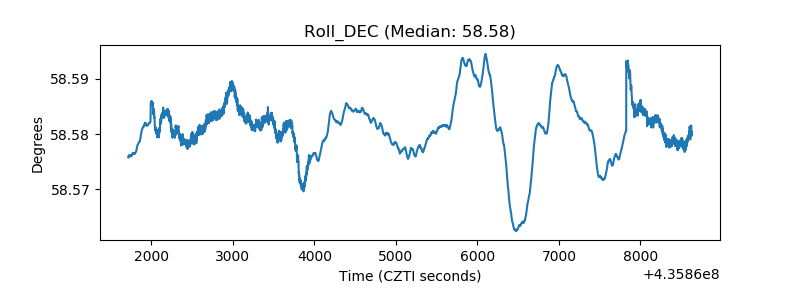 |
| _Roll_RA | 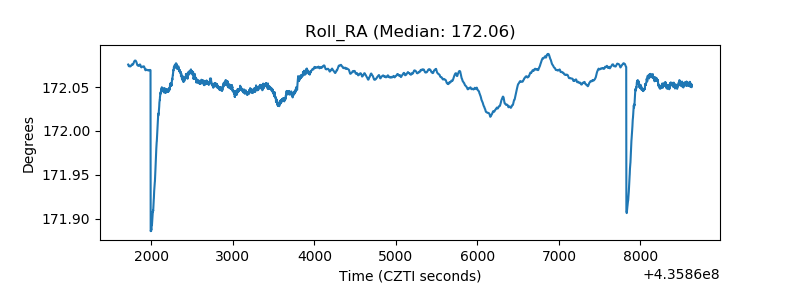 |
| Veto Counter | 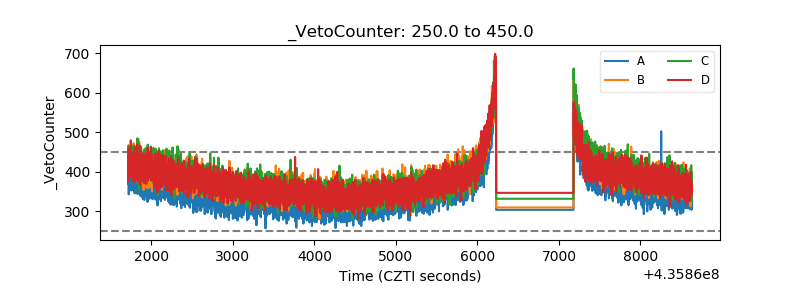 |