| Param | Original file | Final file |
|---|---|---|
| Filename | modeM0/AS1A12_068T05_9000005894_43651cztM0_level2.fits | modeM0/AS1A12_068T05_9000005894_43651cztM0_level2_quad_clean.evt |
| Size (bytes) | 1,209,127,680 | 80,153,280 |
| Size | 1.1 GB | 76.4 MB |
| Events in quadrant A | 4,931,749 | 738,574 |
| Events in quadrant B | 4,933,562 | 733,371 |
| Events in quadrant C | 16,174,330 | 343,390 |
| Events in quadrant D | 18,202,650 | 138,984 |
| Mode SS | |||
|---|---|---|---|
| Quadrant | BADHDUFLAG | Total packets | Discarded packets |
| A | 0 | 134 | 0 |
| B | 0 | 134 | 0 |
| C | 0 | 134 | 0 |
| D | 0 | 134 | 0 |
| Mode M9 | |||
|---|---|---|---|
| Quadrant | BADHDUFLAG | Total packets | Discarded packets |
| A | 0 | 5 | 0 |
| B | 0 | 5 | 0 |
| C | 0 | 5 | 0 |
| D | 0 | 5 | 0 |
| Mode M0 | |||
|---|---|---|---|
| Quadrant | BADHDUFLAG | Total packets | Discarded packets |
| A | 0 | 19193 | 1 |
| B | 0 | 19285 | 1 |
| C | 0 | 52606 | 7 |
| D | 0 | 58568 | 1 |
| Quadrant | Total seconds | Saturated seconds | Saturation percentage |
|---|---|---|---|
| A | 6692 | 296 | 4.423192% |
| B | 6693 | 612 | 9.143882% |
| C | 6692 | 5897 | 88.120143% |
| D | 6692 | 6692 | 100.000000% |
Noise dominated data is calculated using 1-second bins in cleaned event files. If a bin has >2000 counts, and if more than 50% of those come from <1% of pixels, then it is considered to be noise-dominated and hence unusable.
| Quadrant | # 1 sec bins | Bins with >0 counts | Bins with >2000 counts | High rate bins dominated by noise | Noise dominated (total time) | Noise dominated (detector-on time) | Marked lightcurve |
|---|---|---|---|---|---|---|---|
| A | 7182 | 6693 | 107 | 107 | 1.49% | 1.60% | 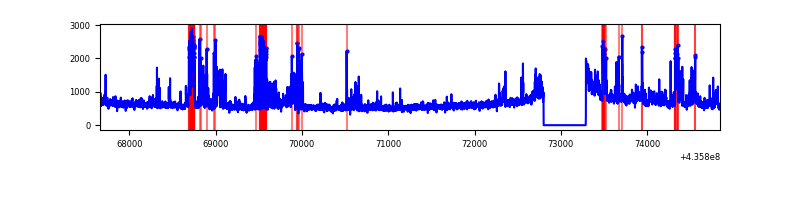 |
| B | 7183 | 6694 | 295 | 295 | 4.11% | 4.41% | 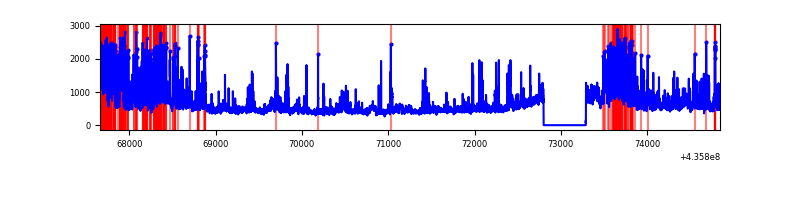 |
| C | 7182 | 6693 | 5647 | 5647 | 78.63% | 84.37% | 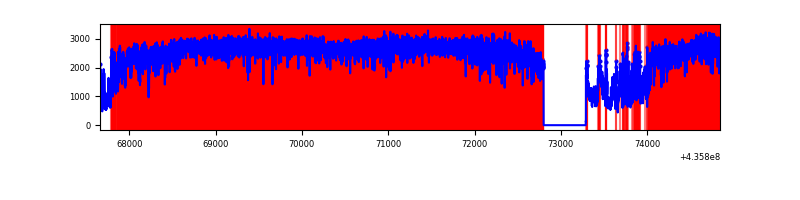 |
| D | 7182 | 6693 | 6663 | 6663 | 92.77% | 99.55% | 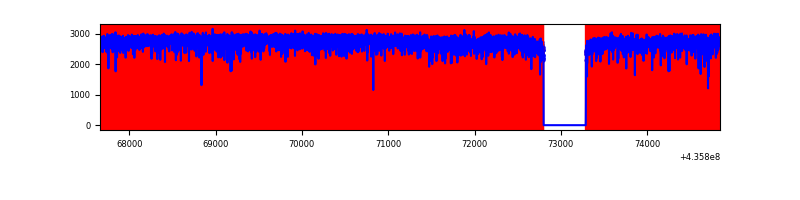 |
Top three noisy pixels from each quadrant. If the there are fewer than three noisy pixels in the level2.evt file, extra rows are filled as -1
| Pixel properties | Quadrant properties | ||||||
|---|---|---|---|---|---|---|---|
| Quadrant | DetID | PixID | Counts | Sigma | Mean | Median | Sigma |
| A | 10 | 83 | 834098 | 5328.67 | 750 | 734 | 156.4 |
| A | 15 | 223 | 706231 | 4511.07 | 750 | 734 | 156.4 |
| A | 8 | 4 | 139200 | 885.37 | 750 | 734 | 156.4 |
| B | 12 | 32 | 789338 | 5556.63 | 733 | 711 | 141.9 |
| B | 10 | 128 | 348142 | 2447.98 | 733 | 711 | 141.9 |
| B | 4 | 206 | 309702 | 2177.14 | 733 | 711 | 141.9 |
| C | 15 | 142 | 11298211 | 129846.92 | 370 | 370 | 87.0 |
| C | 15 | 158 | 938797 | 10785.41 | 370 | 370 | 87.0 |
| C | 3 | 233 | 930412 | 10689.04 | 370 | 370 | 87.0 |
| D | 8 | 192 | 16517758 | 363115.79 | 164 | 158 | 45.5 |
| D | 12 | 6 | 214074 | 4702.64 | 164 | 158 | 45.5 |
| D | 4 | 221 | 151532 | 3327.74 | 164 | 158 | 45.5 |
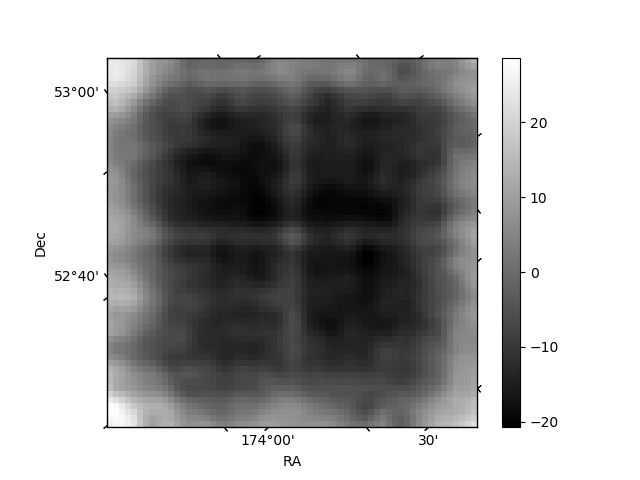
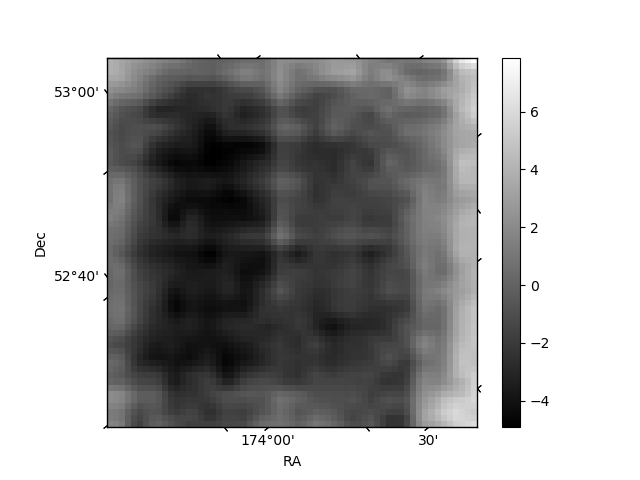
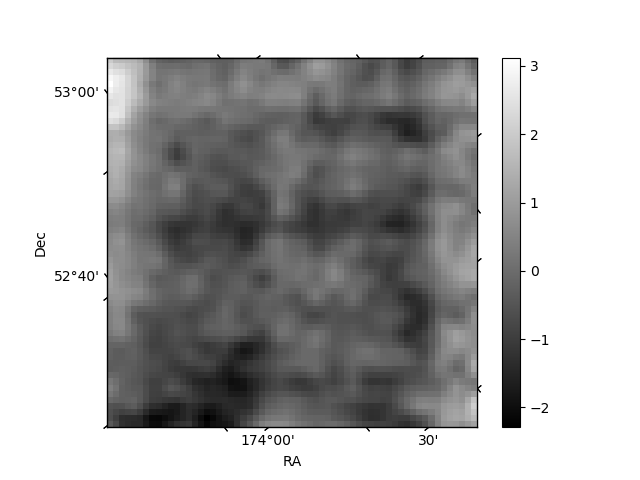
Histogram calculated using DETX and DETY for each event in the final _common_clean file
| Quadrant A | 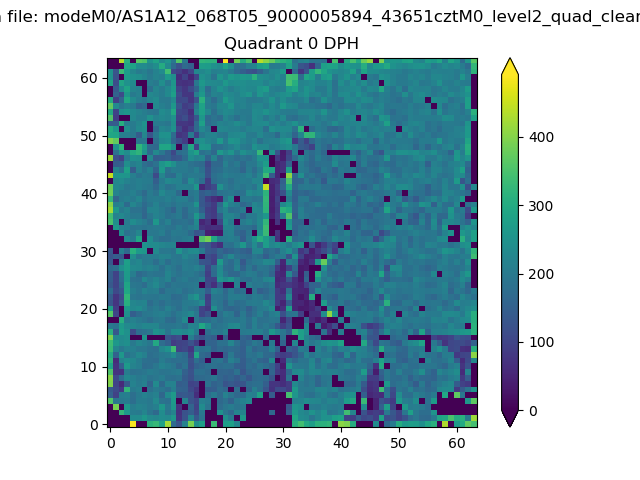 |
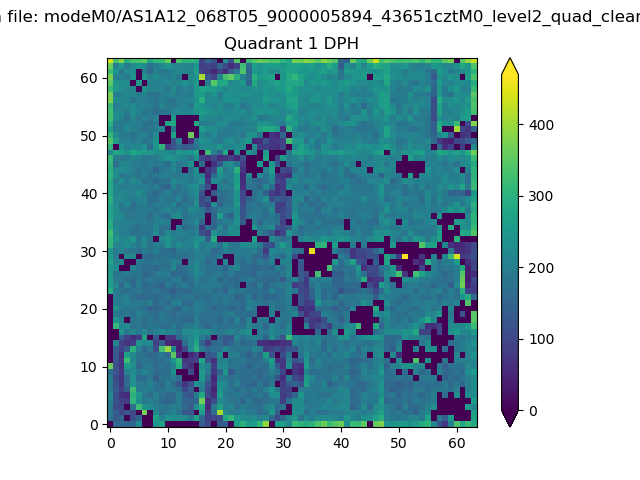 |
Quadrant B |
|---|---|---|---|
| Quadrant D | 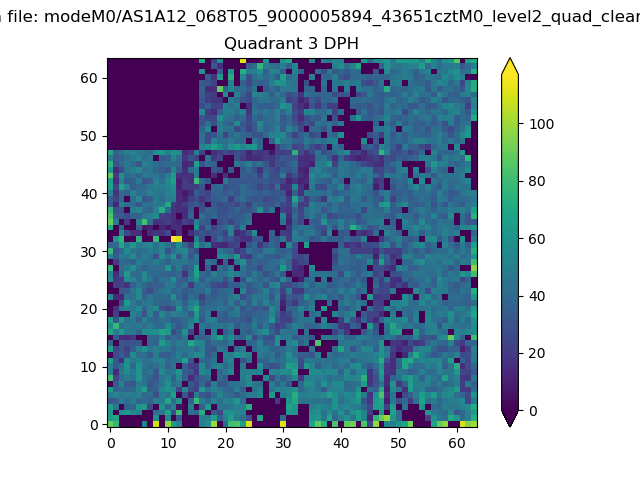 |
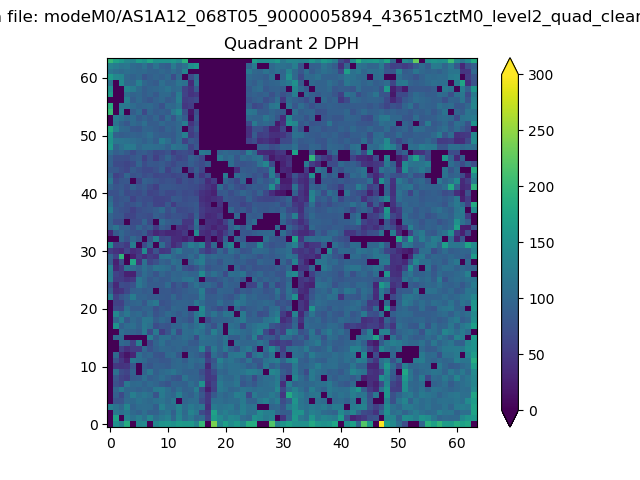 |
Quadrant C |
| Plot type | Count rate plots | Images |
|---|---|---|
| Comparison with Poisson distribution Blue bars denote a histogram of data divided into 1 sec bins. Red curve is a Poisson curve with rate = median count rate of data. |
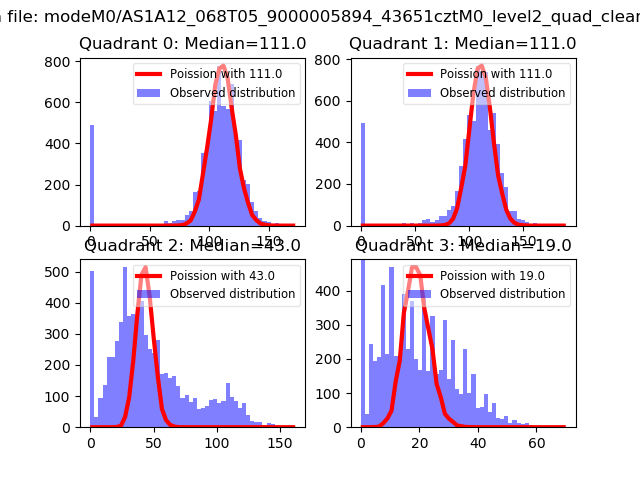 |
 |
| Quadrant-wise count rates Data is divided into 100 sec bins |
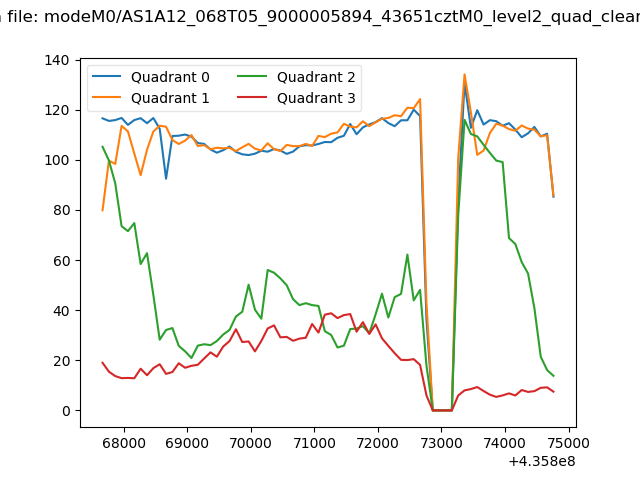 |
|
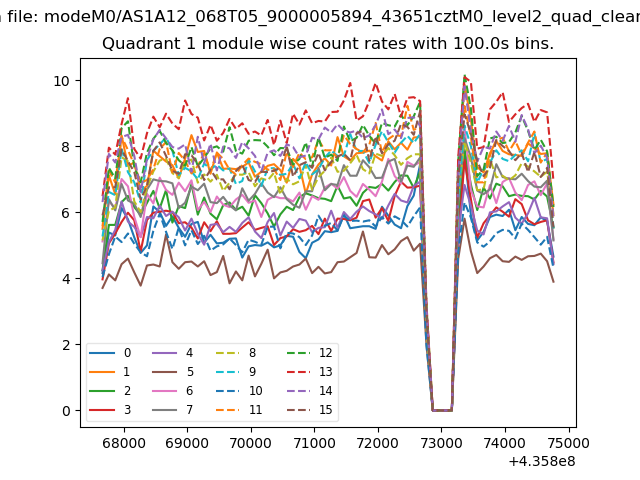
| Module-wise count rates for Quadrant A Data is divided into 100 sec bins |
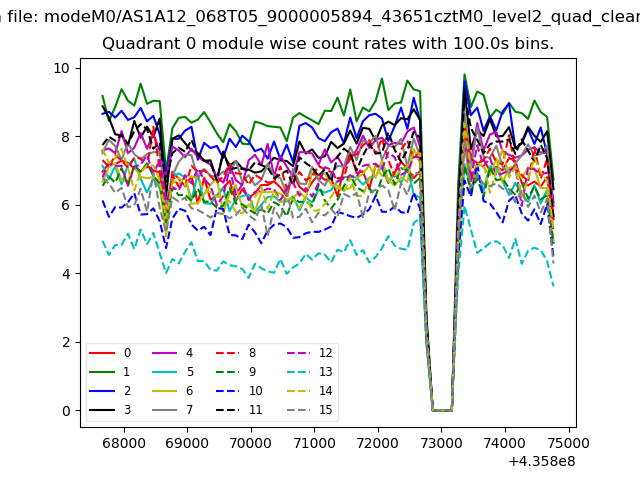 |
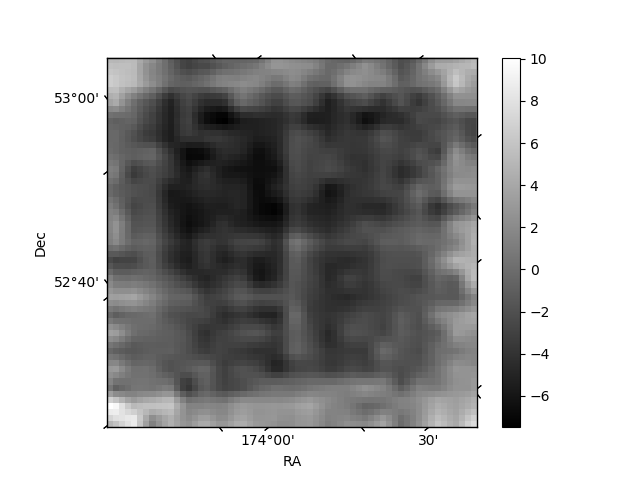 |
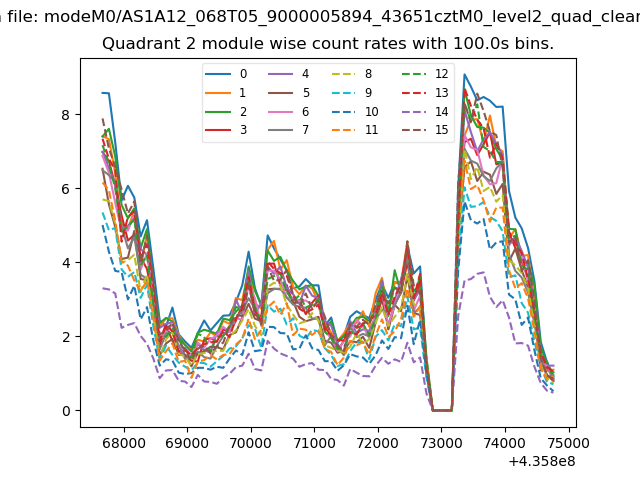
| Module-wise count rates for Quadrant B Data is divided into 100 sec bins |
 |
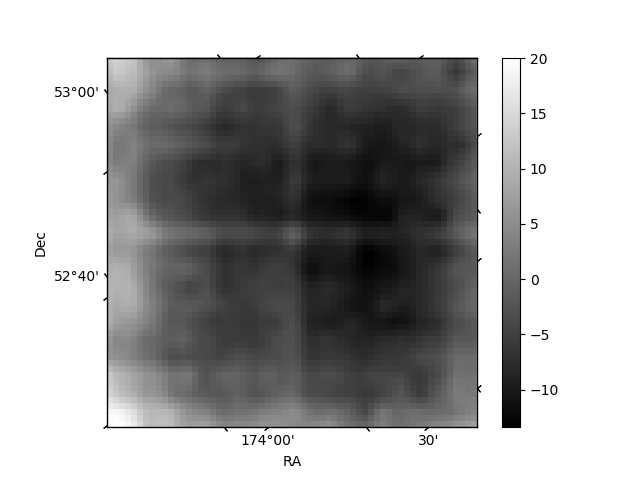 |
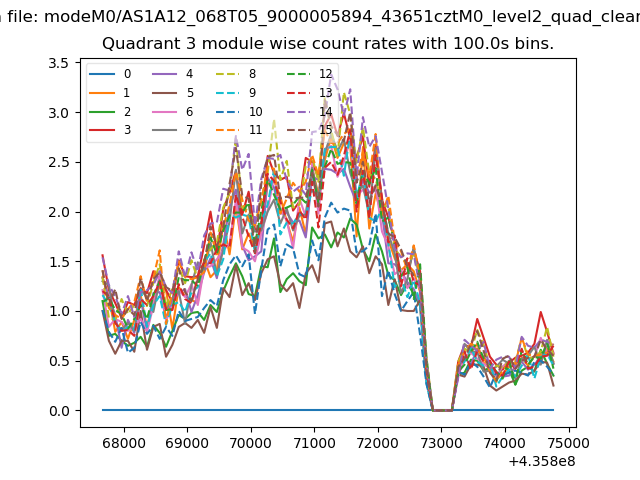
| Module-wise count rates for Quadrant C Data is divided into 100 sec bins |
 |
 |
| Module-wise count rates for Quadrant D Data is divided into 100 sec bins |
 |
 |
| Parameter | Plot |
|---|---|
| CZT HV Monitor |  |
| D_VDD | 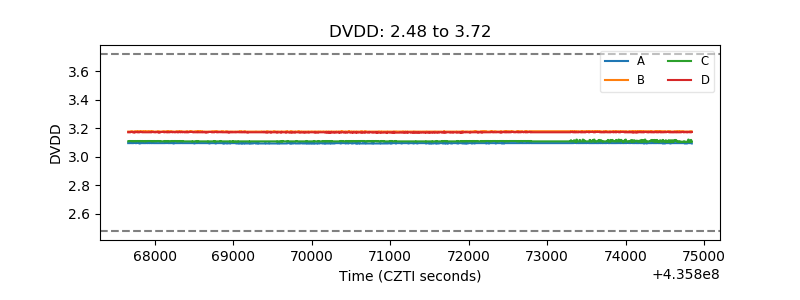 |
| Temperature 1 | 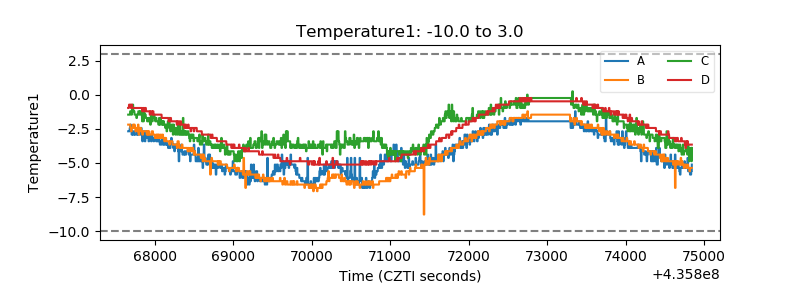 |
| Veto HV Monitor | 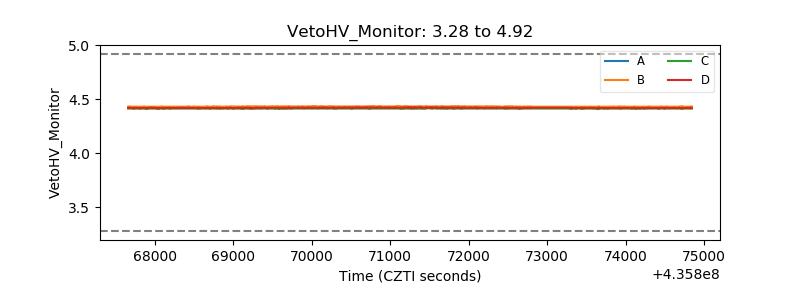 |
| Veto LLD | 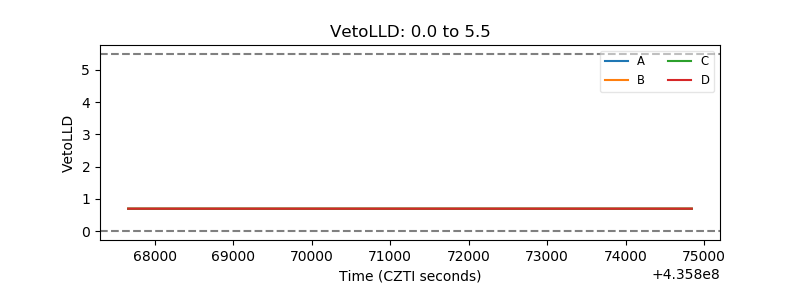 |
| Alpha Counter | 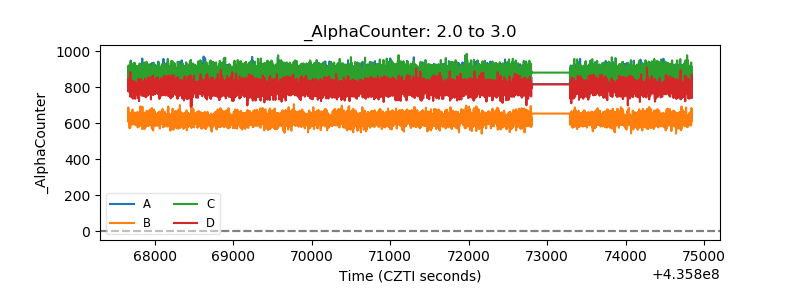 |
| _CPM_Rate | 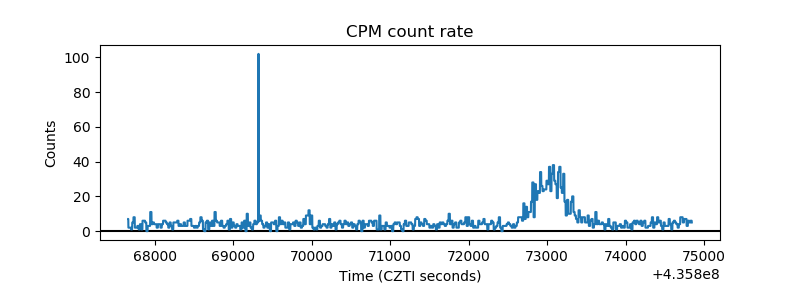 |
| CZT Counter | 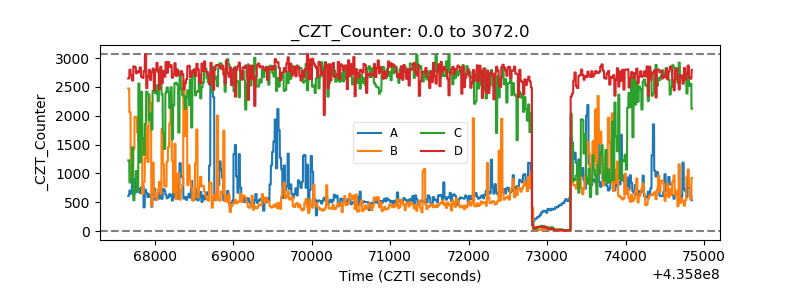 |
| +2.5 Volts monitor | 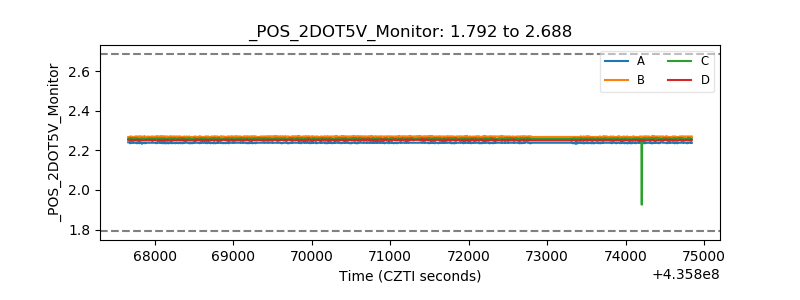 |
| +5 Volts monitor | 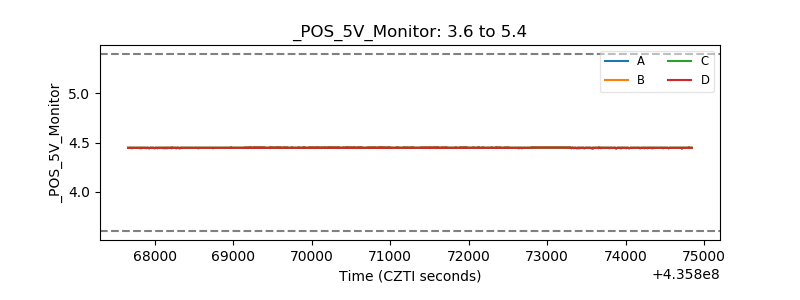 |
| _ROLL_ROT | 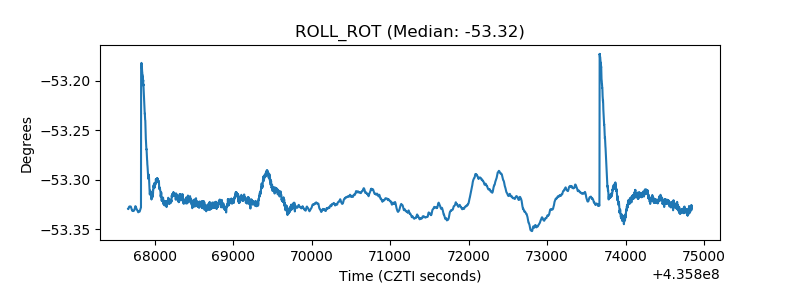 |
| _Roll_DEC | 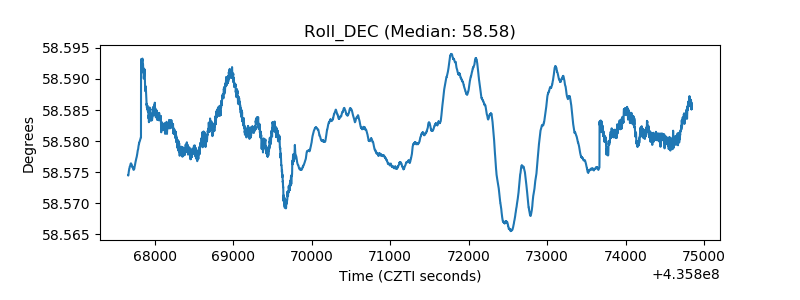 |
| _Roll_RA | 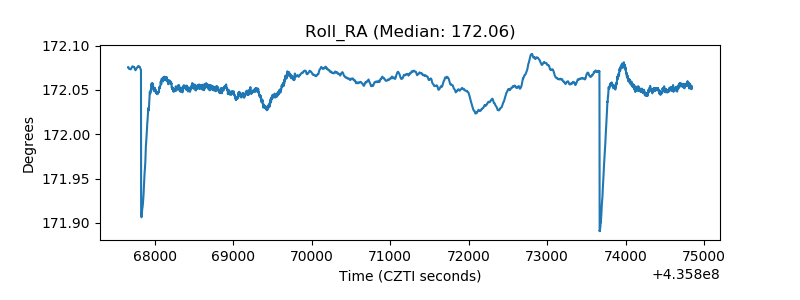 |
| Veto Counter | 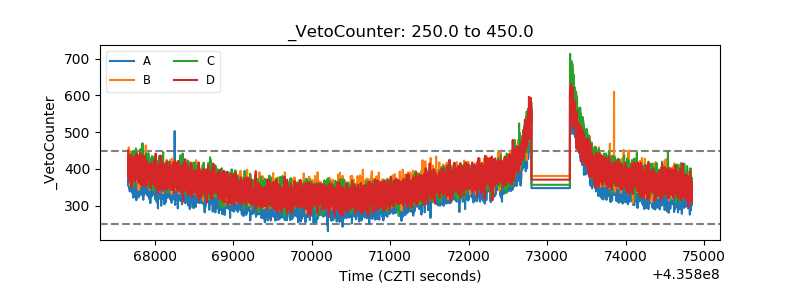 |