| Param | Original file | Final file |
|---|---|---|
| Filename | modeM0/AS1A12_068T05_9000005894_43652cztM0_level2.fits | modeM0/AS1A12_068T05_9000005894_43652cztM0_level2_quad_clean.evt |
| Size (bytes) | 1,344,726,720 | 84,263,040 |
| Size | 1.3 GB | 80.4 MB |
| Events in quadrant A | 4,937,404 | 827,759 |
| Events in quadrant B | 4,926,473 | 832,412 |
| Events in quadrant C | 19,139,572 | 289,475 |
| Events in quadrant D | 20,194,002 | 70,718 |
| Mode SS | |||
|---|---|---|---|
| Quadrant | BADHDUFLAG | Total packets | Discarded packets |
| A | 0 | 150 | 0 |
| B | 0 | 150 | 0 |
| C | 0 | 150 | 0 |
| D | 0 | 150 | 0 |
| Mode M0 | |||
|---|---|---|---|
| Quadrant | BADHDUFLAG | Total packets | Discarded packets |
| A | 0 | 19673 | 1 |
| B | 0 | 19850 | 2 |
| C | 0 | 61994 | 1 |
| D | 0 | 64983 | 1 |
| Quadrant | Total seconds | Saturated seconds | Saturation percentage |
|---|---|---|---|
| A | 7528 | 129 | 1.713603% |
| B | 7528 | 330 | 4.383634% |
| C | 7528 | 7296 | 96.918172% |
| D | 7528 | 7528 | 100.000000% |
Noise dominated data is calculated using 1-second bins in cleaned event files. If a bin has >2000 counts, and if more than 50% of those come from <1% of pixels, then it is considered to be noise-dominated and hence unusable.
| Quadrant | # 1 sec bins | Bins with >0 counts | Bins with >2000 counts | High rate bins dominated by noise | Noise dominated (total time) | Noise dominated (detector-on time) | Marked lightcurve |
|---|---|---|---|---|---|---|---|
| A | 7553 | 7529 | 51 | 51 | 0.68% | 0.68% | 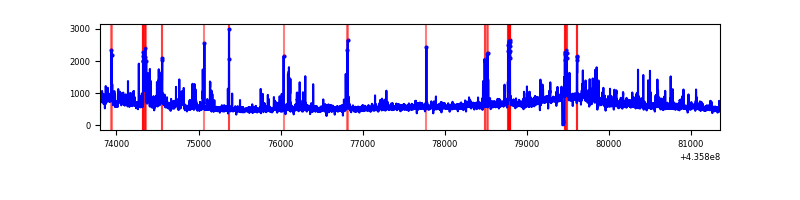 |
| B | 7553 | 7529 | 85 | 85 | 1.13% | 1.13% |  |
| C | 7553 | 7529 | 6918 | 6918 | 91.59% | 91.88% | 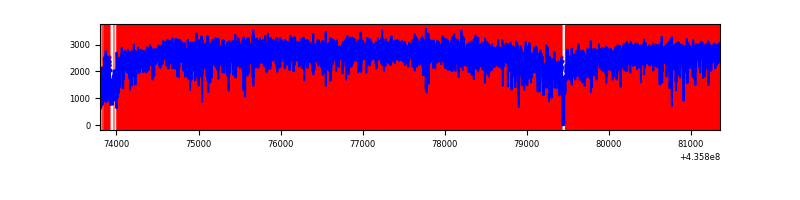 |
| D | 7553 | 7529 | 7436 | 7436 | 98.45% | 98.76% | 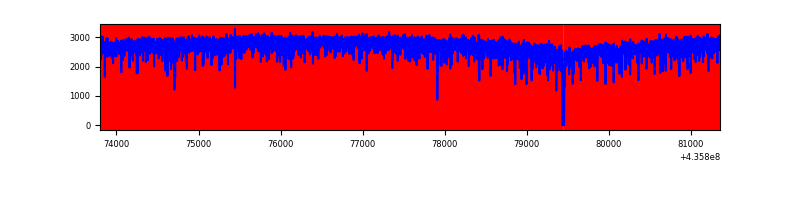 |
Top three noisy pixels from each quadrant. If the there are fewer than three noisy pixels in the level2.evt file, extra rows are filled as -1
| Pixel properties | Quadrant properties | ||||||
|---|---|---|---|---|---|---|---|
| Quadrant | DetID | PixID | Counts | Sigma | Mean | Median | Sigma |
| A | 10 | 83 | 882740 | 5095.44 | 844 | 828 | 173.1 |
| A | 15 | 223 | 290875 | 1675.81 | 844 | 828 | 173.1 |
| A | 13 | 248 | 94212 | 539.55 | 844 | 828 | 173.1 |
| B | 4 | 206 | 441591 | 2739.25 | 834 | 809 | 160.9 |
| B | 0 | 219 | 195912 | 1212.47 | 834 | 809 | 160.9 |
| B | 5 | 235 | 194319 | 1202.57 | 834 | 809 | 160.9 |
| C | 15 | 142 | 13743310 | 182763.16 | 317 | 316 | 75.2 |
| C | 15 | 158 | 1519724 | 20206.06 | 317 | 316 | 75.2 |
| C | 15 | 157 | 1254893 | 16684.17 | 317 | 316 | 75.2 |
| D | 8 | 192 | 18979461 | 647815.74 | 97 | 92 | 29.3 |
| D | 4 | 221 | 250133 | 8534.56 | 97 | 92 | 29.3 |
| D | 14 | 210 | 87811 | 2994.08 | 97 | 92 | 29.3 |
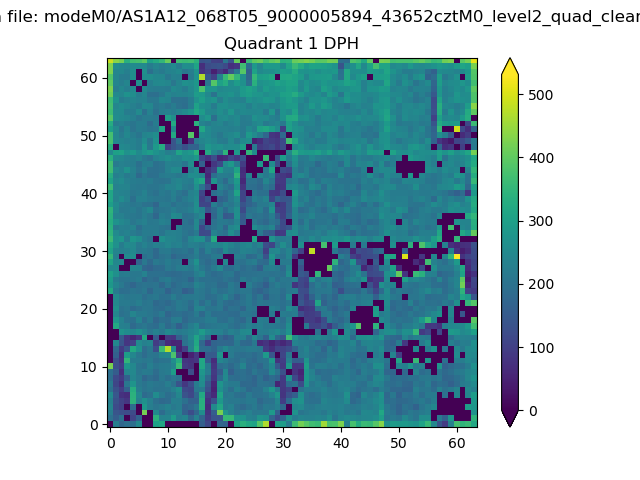
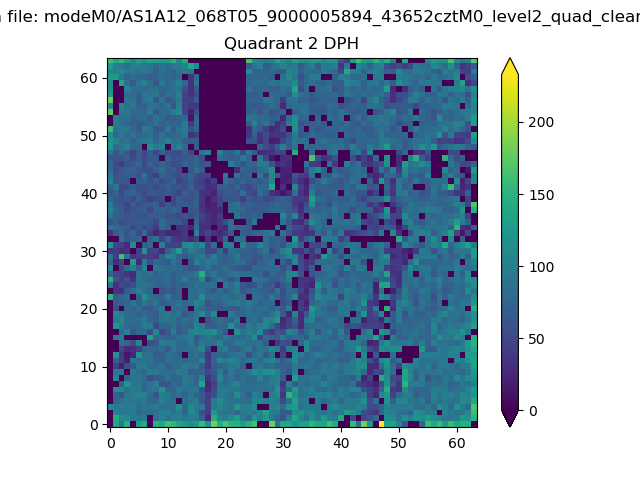
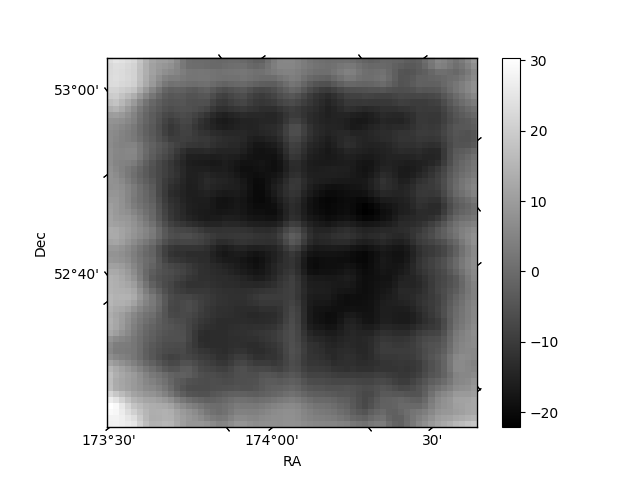
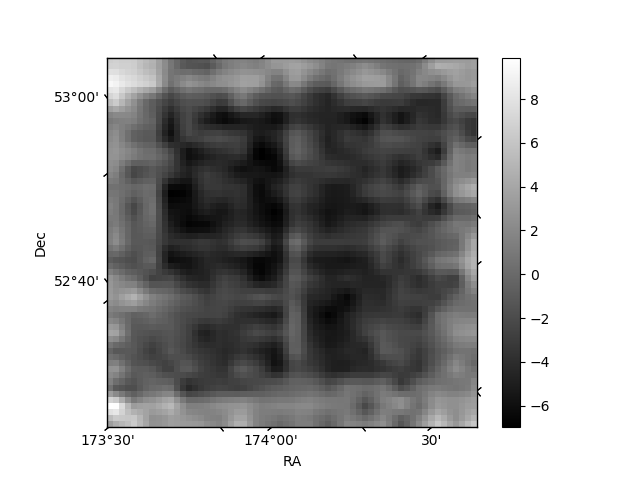
Histogram calculated using DETX and DETY for each event in the final _common_clean file
| Quadrant A | 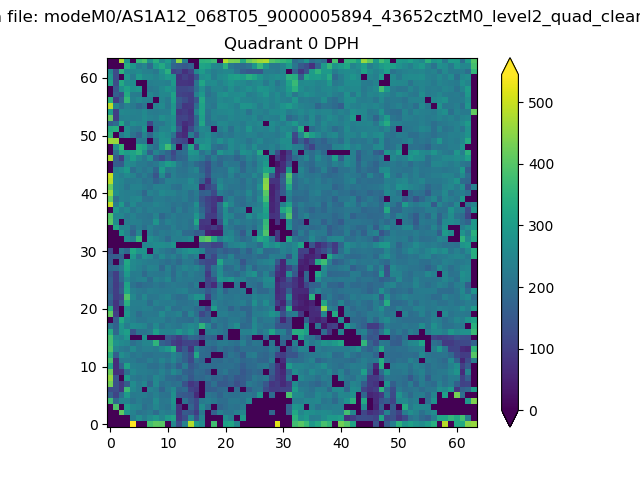 |
 |
Quadrant B |
|---|---|---|---|
| Quadrant D | 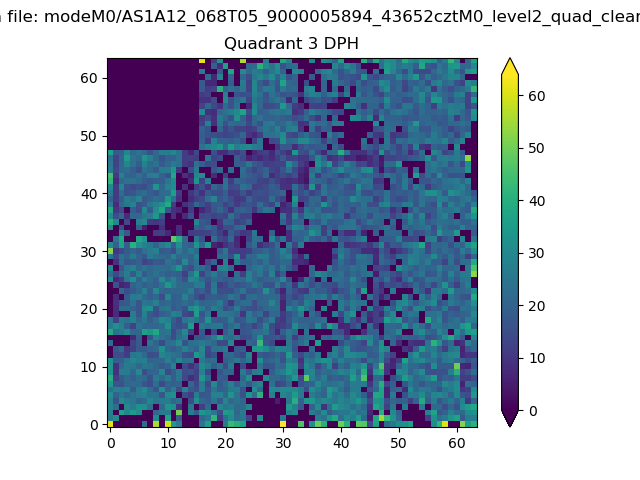 |
 |
Quadrant C |
| Plot type | Count rate plots | Images |
|---|---|---|
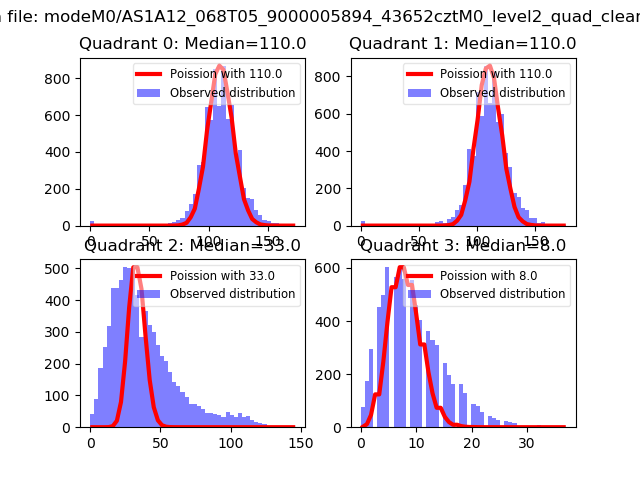
| Comparison with Poisson distribution Blue bars denote a histogram of data divided into 1 sec bins. Red curve is a Poisson curve with rate = median count rate of data. |
 |
 |
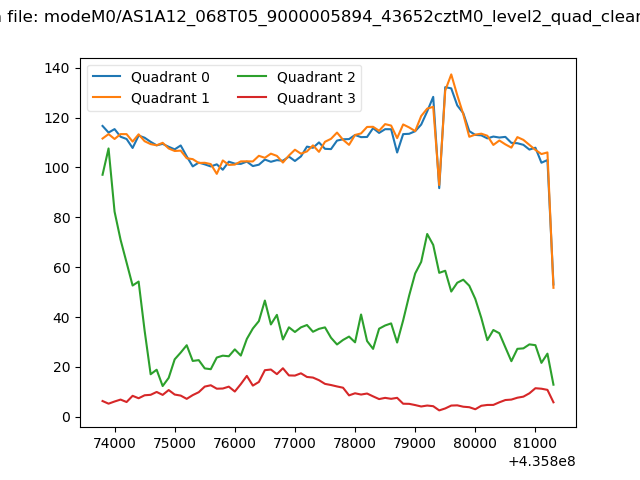
| Quadrant-wise count rates Data is divided into 100 sec bins |
 |
|
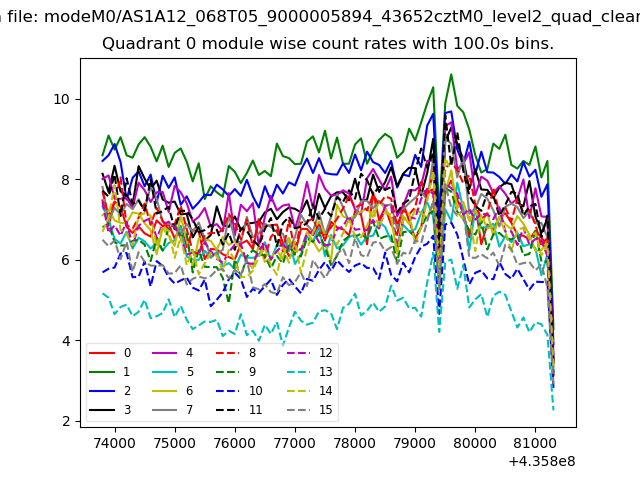
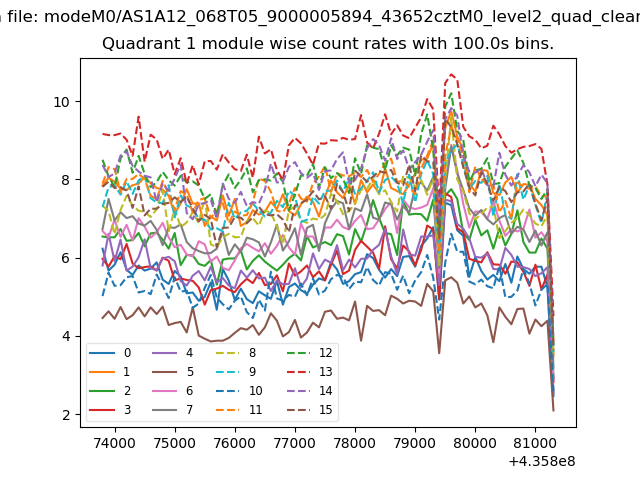
| Module-wise count rates for Quadrant A Data is divided into 100 sec bins |
 |
 |
| Module-wise count rates for Quadrant B Data is divided into 100 sec bins |
 |
 |
| Module-wise count rates for Quadrant C Data is divided into 100 sec bins |
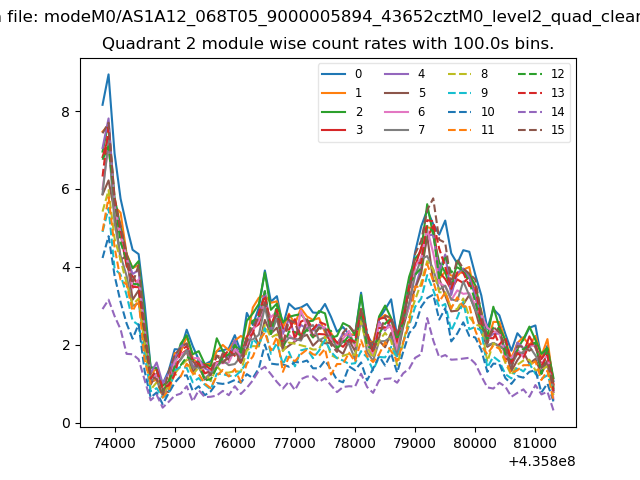 |
 |
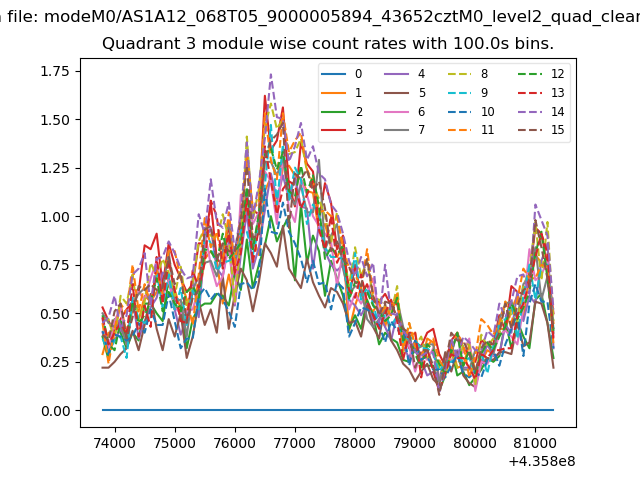
| Module-wise count rates for Quadrant D Data is divided into 100 sec bins |
 |
 |
| Parameter | Plot |
|---|---|
| CZT HV Monitor | 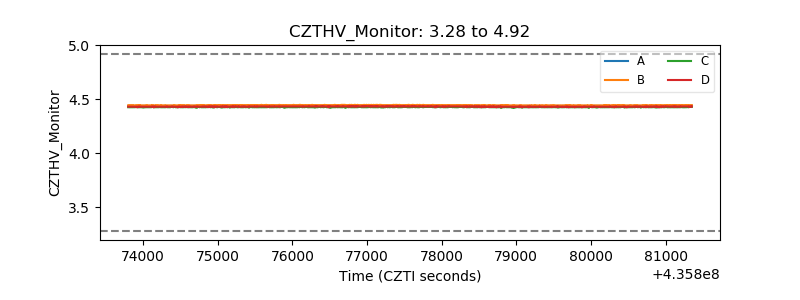 |
| D_VDD | 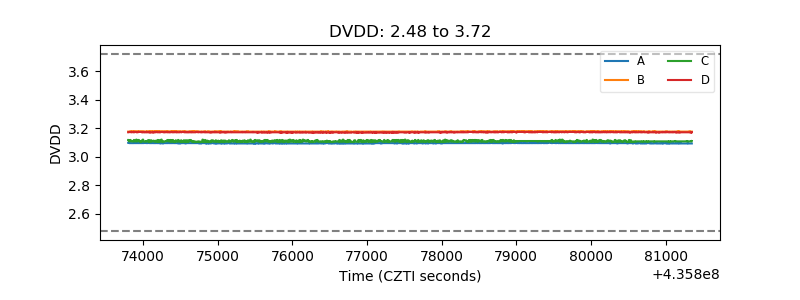 |
| Temperature 1 | 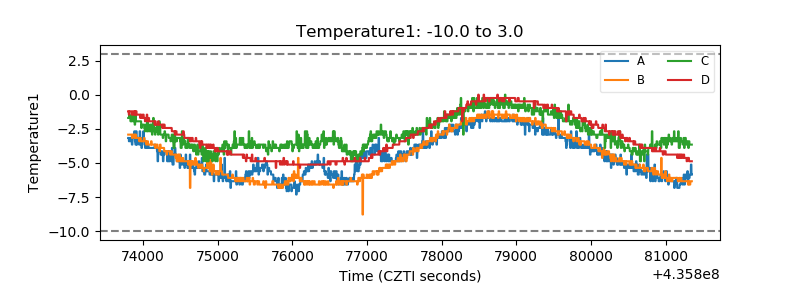 |
| Veto HV Monitor | 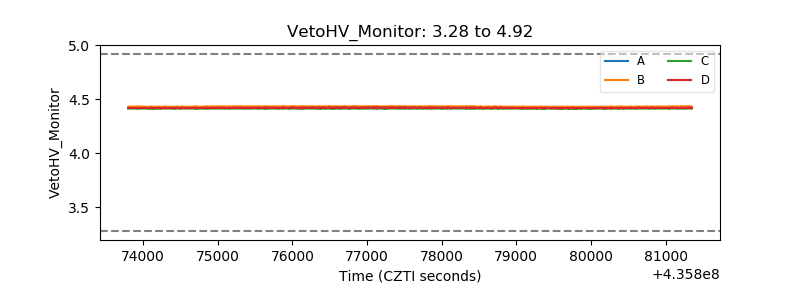 |
| Veto LLD | 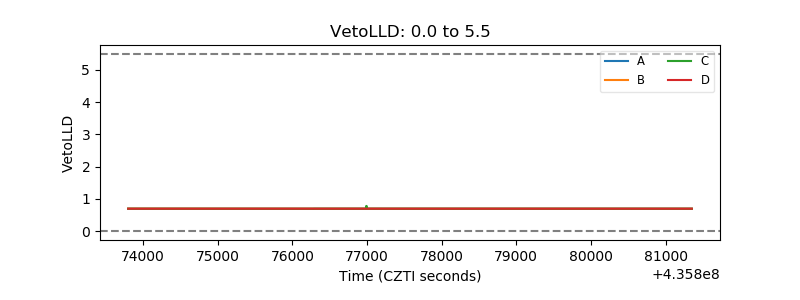 |
| Alpha Counter | 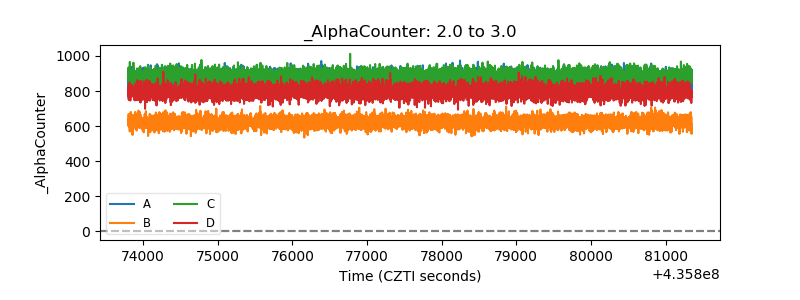 |
| _CPM_Rate | 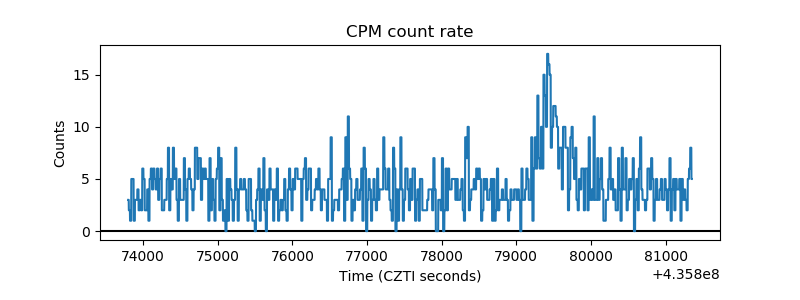 |
| CZT Counter | 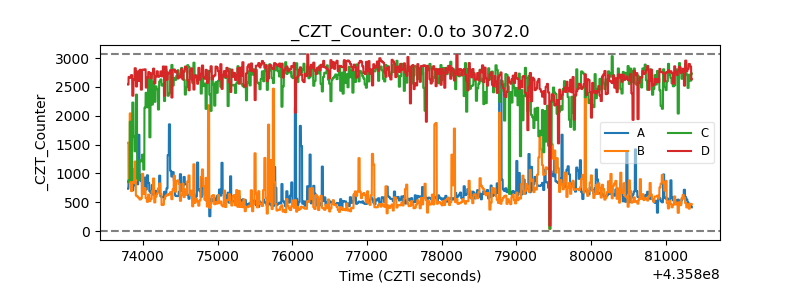 |
| +2.5 Volts monitor | 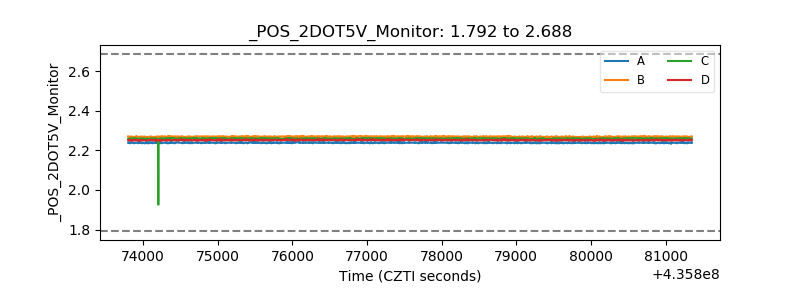 |
| +5 Volts monitor |  |
| _ROLL_ROT | 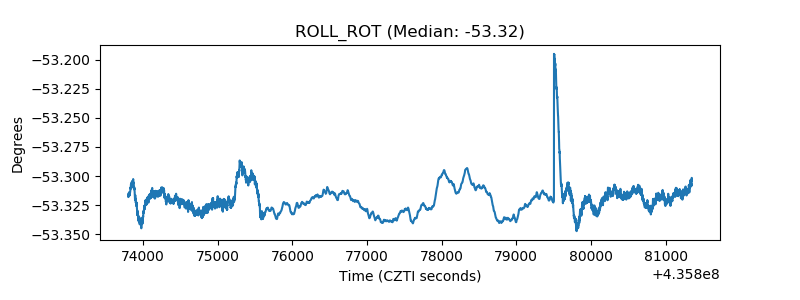 |
| _Roll_DEC |  |
| _Roll_RA | 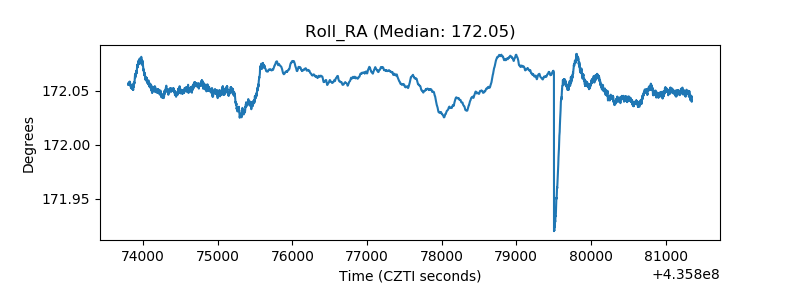 |
| Veto Counter | 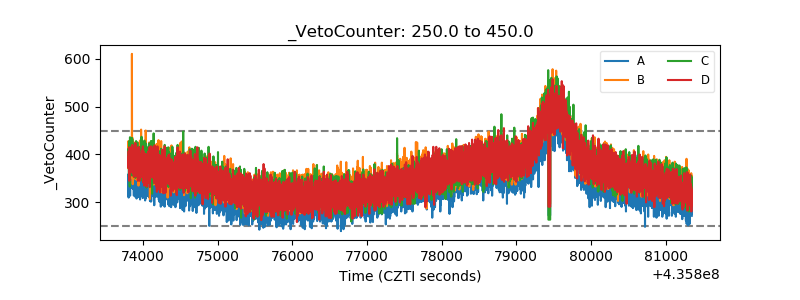 |