| Param | Original file | Final file |
|---|---|---|
| Filename | modeM0/AS1A12_068T05_9000005894_43653cztM0_level2.fits | modeM0/AS1A12_068T05_9000005894_43653cztM0_level2_quad_clean.evt |
| Size (bytes) | 1,313,064,000 | 80,412,480 |
| Size | 1.2 GB | 76.7 MB |
| Events in quadrant A | 4,672,965 | 785,384 |
| Events in quadrant B | 4,582,577 | 796,727 |
| Events in quadrant C | 19,088,093 | 249,037 |
| Events in quadrant D | 19,702,829 | 91,189 |
| Mode SS | |||
|---|---|---|---|
| Quadrant | BADHDUFLAG | Total packets | Discarded packets |
| A | 0 | 146 | 0 |
| B | 0 | 146 | 0 |
| C | 0 | 146 | 0 |
| D | 0 | 146 | 0 |
| Mode M0 | |||
|---|---|---|---|
| Quadrant | BADHDUFLAG | Total packets | Discarded packets |
| A | 0 | 18623 | 0 |
| B | 0 | 18639 | 0 |
| C | 0 | 61588 | 0 |
| D | 0 | 63268 | 0 |
| Quadrant | Total seconds | Saturated seconds | Saturation percentage |
|---|---|---|---|
| A | 7254 | 149 | 2.054039% |
| B | 7254 | 223 | 3.074166% |
| C | 7254 | 7220 | 99.531293% |
| D | 7255 | 7255 | 100.000000% |
Noise dominated data is calculated using 1-second bins in cleaned event files. If a bin has >2000 counts, and if more than 50% of those come from <1% of pixels, then it is considered to be noise-dominated and hence unusable.
| Quadrant | # 1 sec bins | Bins with >0 counts | Bins with >2000 counts | High rate bins dominated by noise | Noise dominated (total time) | Noise dominated (detector-on time) | Marked lightcurve |
|---|---|---|---|---|---|---|---|
| A | 7254 | 7254 | 105 | 105 | 1.45% | 1.45% | 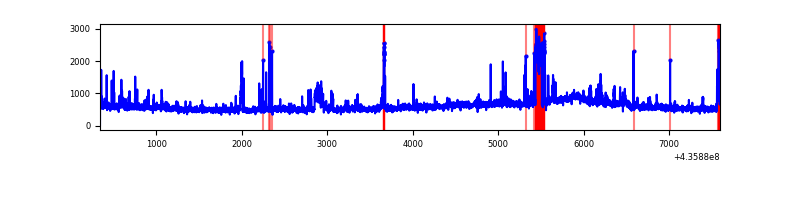 |
| B | 7254 | 7254 | 103 | 103 | 1.42% | 1.42% | 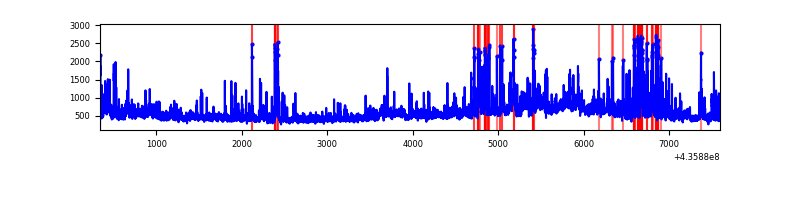 |
| C | 7254 | 7254 | 6985 | 6985 | 96.29% | 96.29% |  |
| D | 7255 | 7255 | 7181 | 7181 | 98.98% | 98.98% | 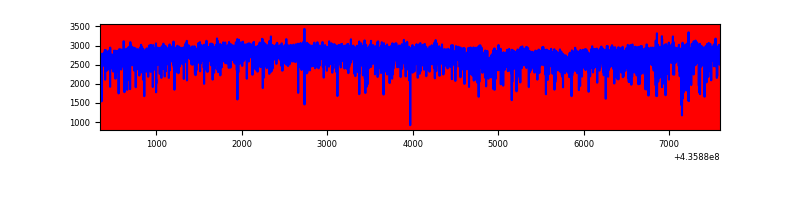 |
Top three noisy pixels from each quadrant. If the there are fewer than three noisy pixels in the level2.evt file, extra rows are filled as -1
| Pixel properties | Quadrant properties | ||||||
|---|---|---|---|---|---|---|---|
| Quadrant | DetID | PixID | Counts | Sigma | Mean | Median | Sigma |
| A | 10 | 83 | 821693 | 4941.11 | 802 | 785 | 166.1 |
| A | 13 | 248 | 299332 | 1796.98 | 802 | 785 | 166.1 |
| A | 15 | 222 | 134248 | 803.32 | 802 | 785 | 166.1 |
| B | 4 | 206 | 470882 | 3029.76 | 799 | 777 | 155.2 |
| B | 12 | 32 | 211563 | 1358.48 | 799 | 777 | 155.2 |
| B | 3 | 42 | 165549 | 1061.93 | 799 | 777 | 155.2 |
| C | 15 | 142 | 14622434 | 228137.0 | 269 | 271 | 64.1 |
| C | 15 | 158 | 1311872 | 20463.78 | 269 | 271 | 64.1 |
| C | 15 | 126 | 1010315 | 15758.85 | 269 | 271 | 64.1 |
| D | 8 | 192 | 17724074 | 521869.29 | 117 | 112 | 34.0 |
| D | 4 | 221 | 513485 | 15115.9 | 117 | 112 | 34.0 |
| D | 4 | 216 | 298022 | 8771.75 | 117 | 112 | 34.0 |
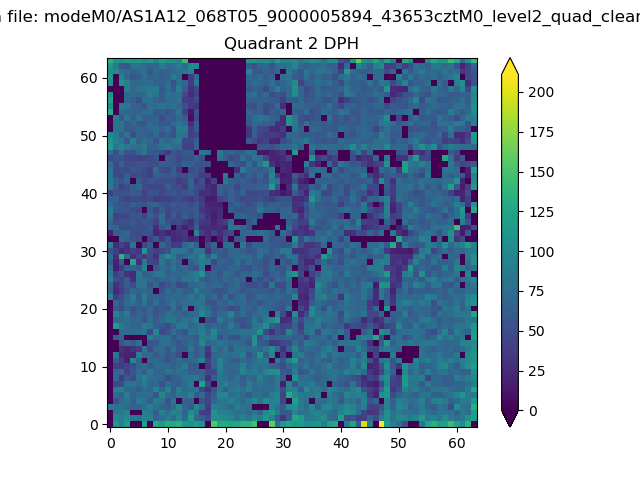
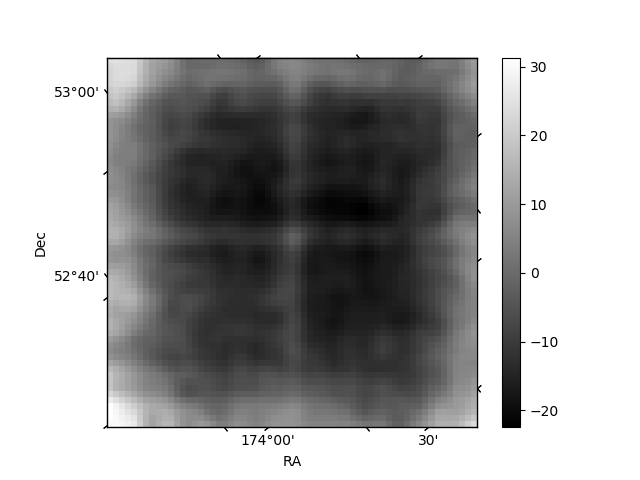
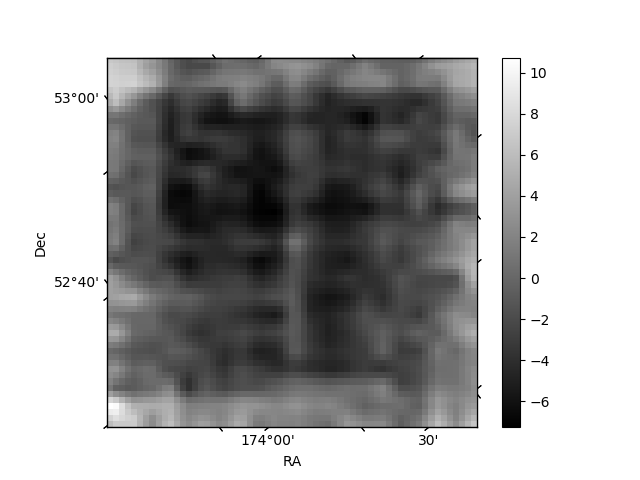
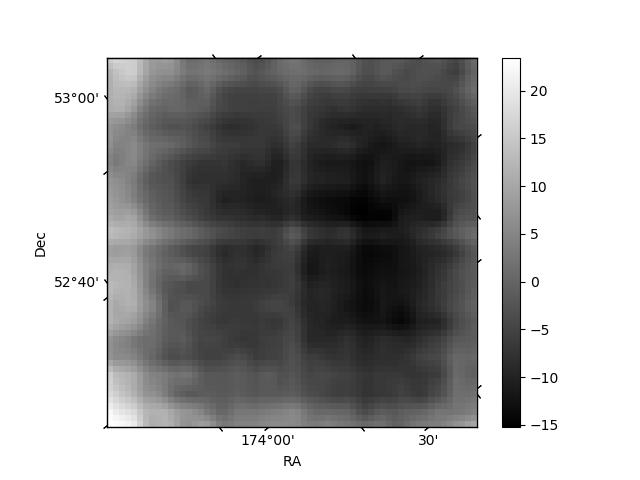
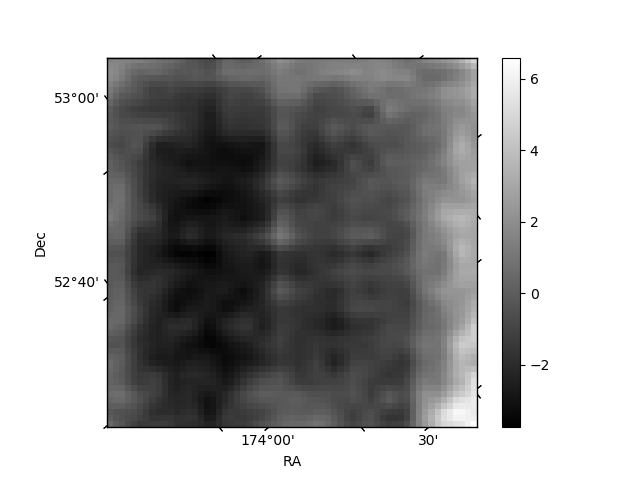
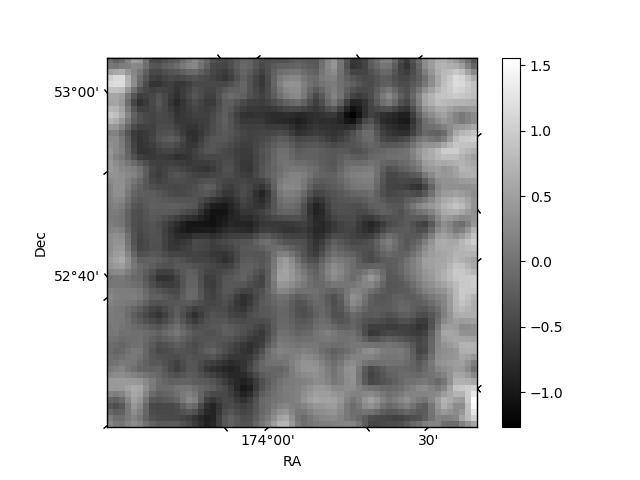
Histogram calculated using DETX and DETY for each event in the final _common_clean file
| Quadrant A | 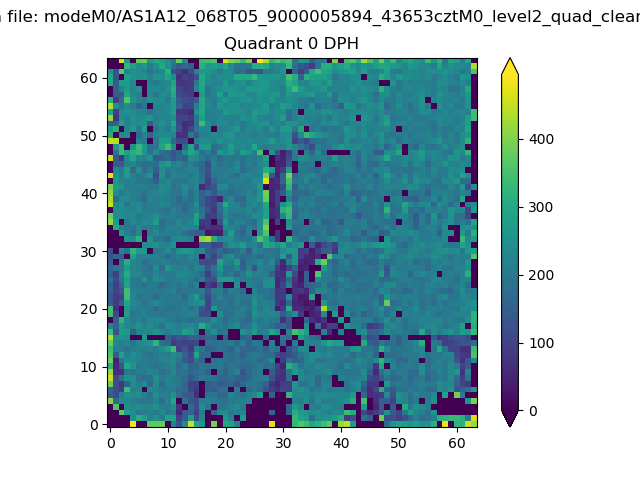 |
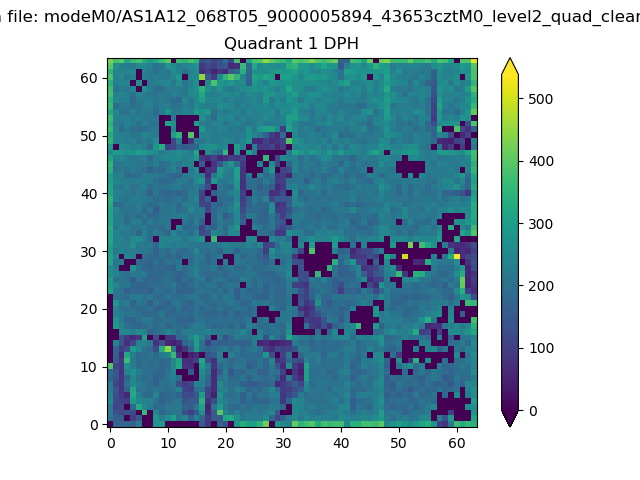 |
Quadrant B |
|---|---|---|---|
| Quadrant D | 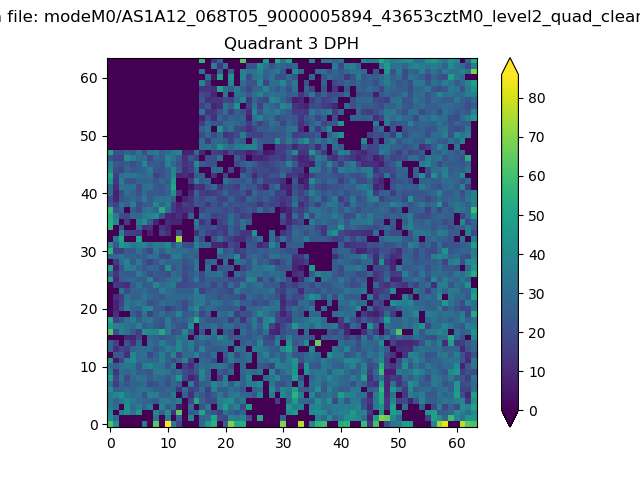 |
 |
Quadrant C |
| Plot type | Count rate plots | Images |
|---|---|---|
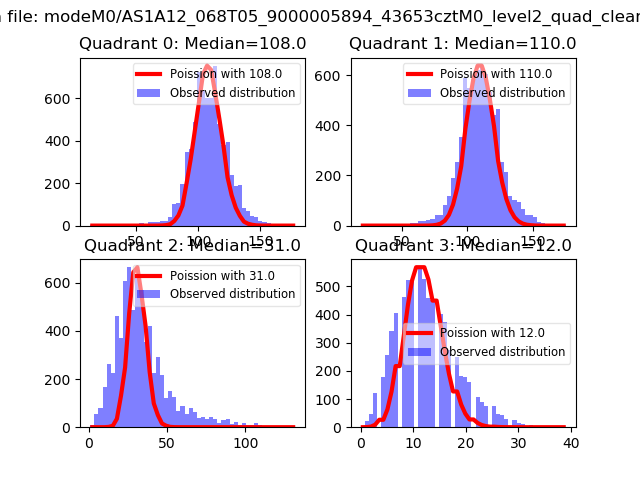
| Comparison with Poisson distribution Blue bars denote a histogram of data divided into 1 sec bins. Red curve is a Poisson curve with rate = median count rate of data. |
 |
 |
| Quadrant-wise count rates Data is divided into 100 sec bins |
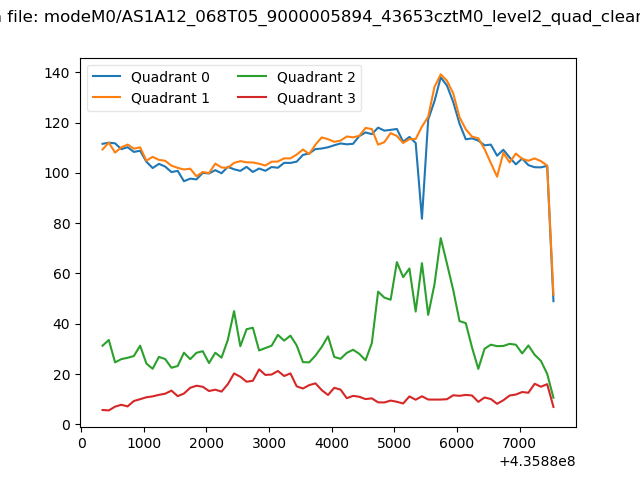 |
|
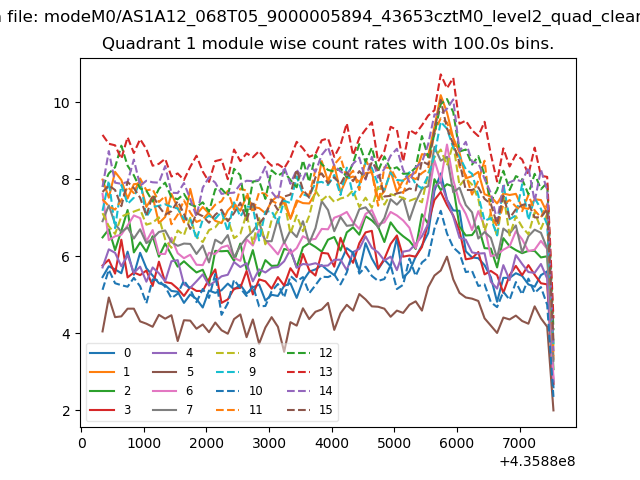
| Module-wise count rates for Quadrant A Data is divided into 100 sec bins |
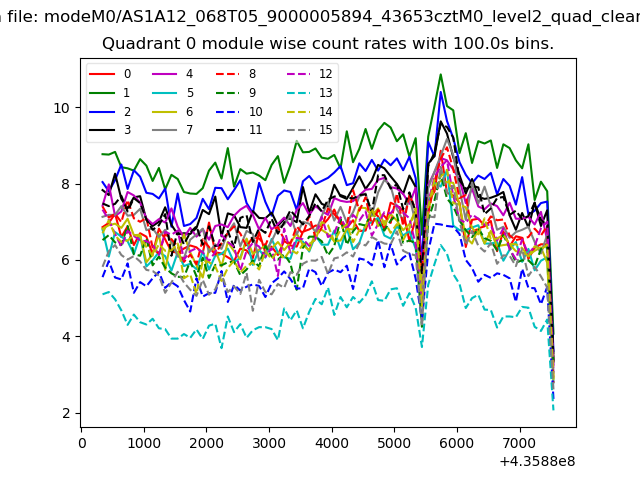 |
 |
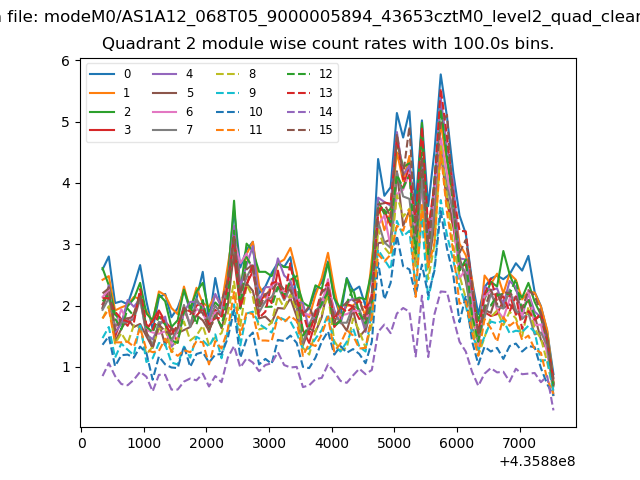
| Module-wise count rates for Quadrant B Data is divided into 100 sec bins |
 |
 |
| Module-wise count rates for Quadrant C Data is divided into 100 sec bins |
 |
 |
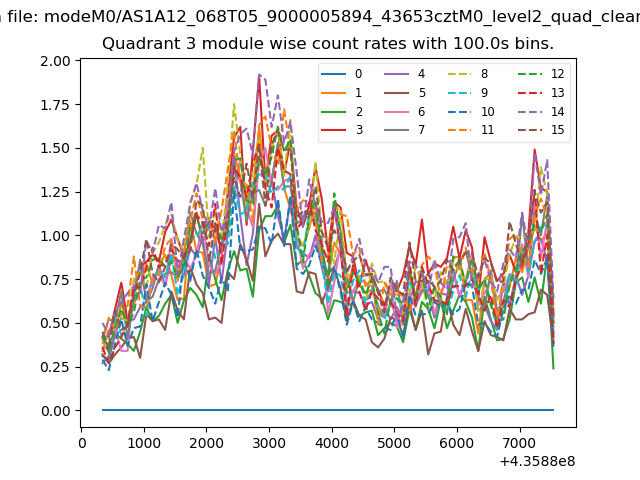
| Module-wise count rates for Quadrant D Data is divided into 100 sec bins |
 |
 |
| Parameter | Plot |
|---|---|
| CZT HV Monitor | 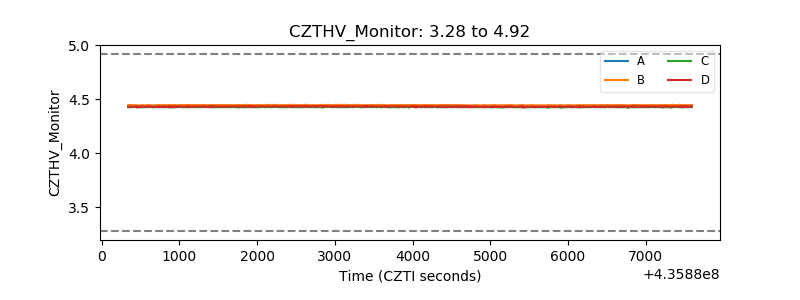 |
| D_VDD | 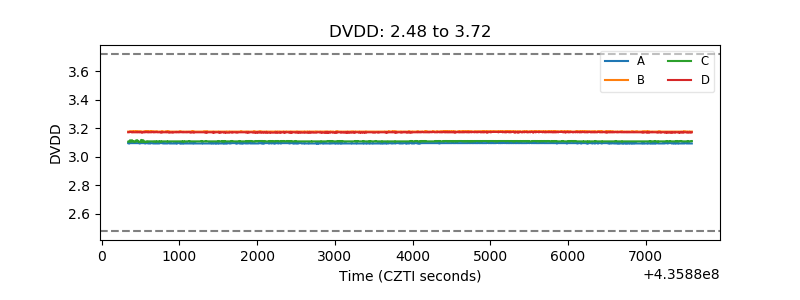 |
| Temperature 1 | 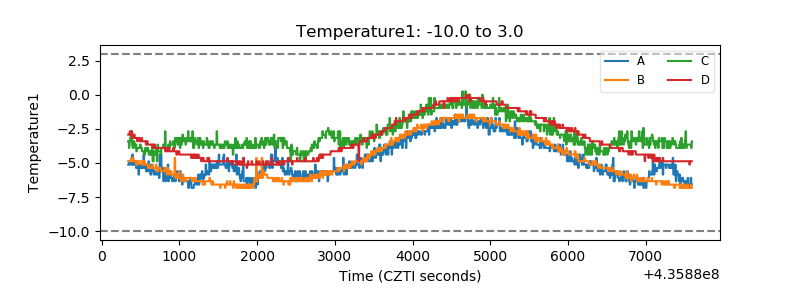 |
| Veto HV Monitor | 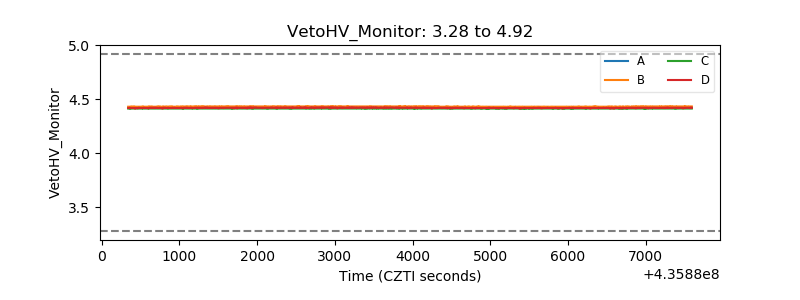 |
| Veto LLD | 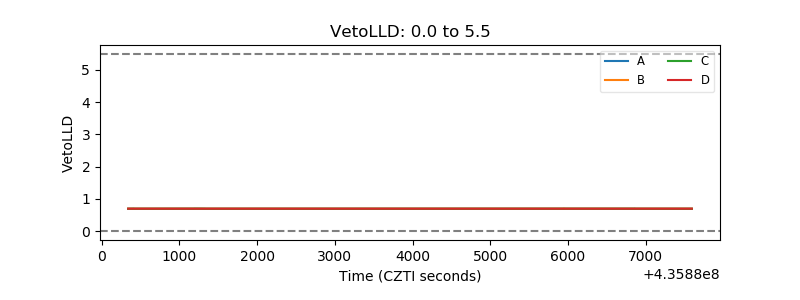 |
| Alpha Counter | 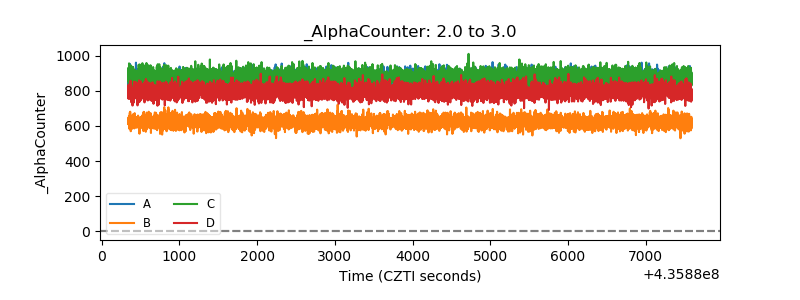 |
| _CPM_Rate | 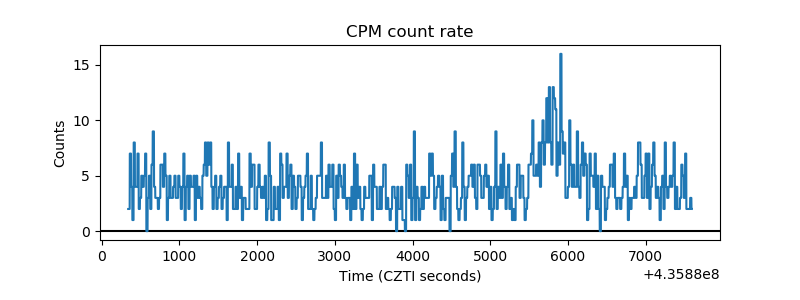 |
| CZT Counter | 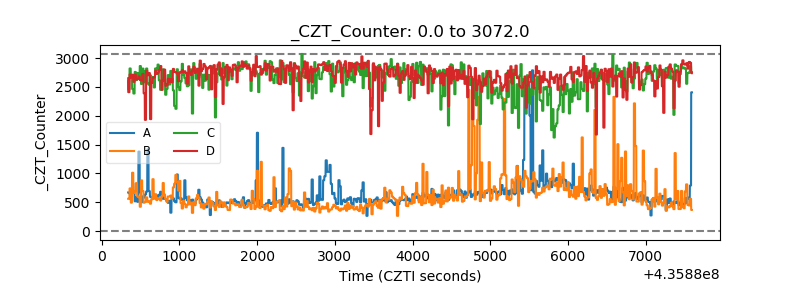 |
| +2.5 Volts monitor | 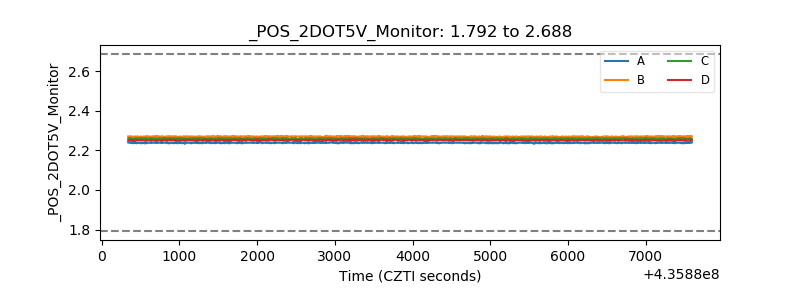 |
| +5 Volts monitor | 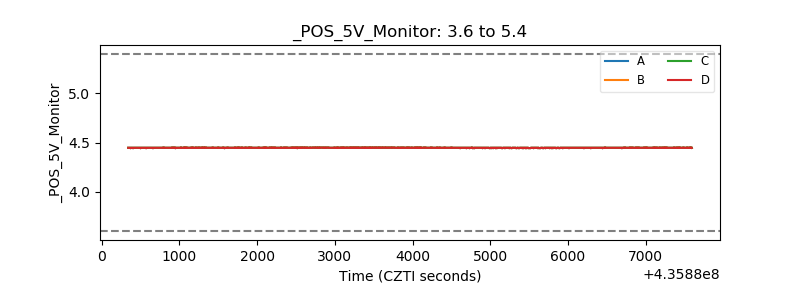 |
| _ROLL_ROT |  |
| _Roll_DEC | 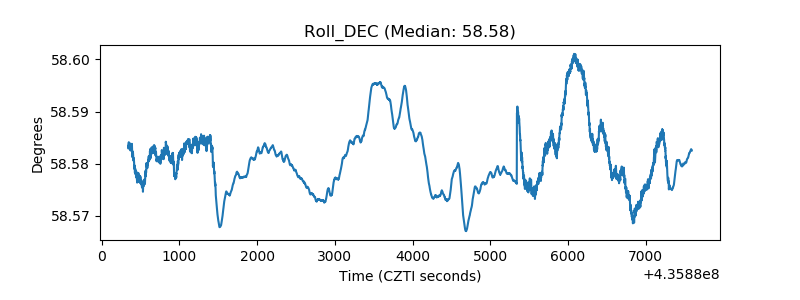 |
| _Roll_RA | 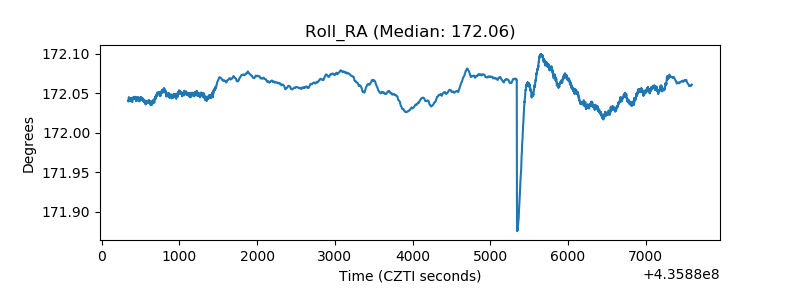 |
| Veto Counter | 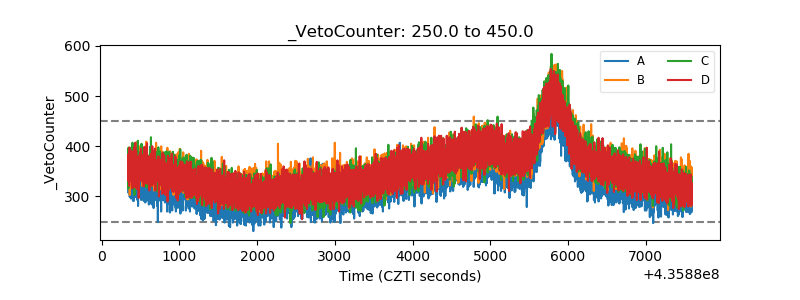 |