| Param | Original file | Final file |
|---|---|---|
| Filename | modeM0/AS1A12_068T05_9000005894_43656cztM0_level2.fits | modeM0/AS1A12_068T05_9000005894_43656cztM0_level2_quad_clean.evt |
| Size (bytes) | 2,570,555,520 | 158,688,000 |
| Size | 2.4 GB | 151.3 MB |
| Events in quadrant A | 9,993,995 | 1,511,336 |
| Events in quadrant B | 8,908,051 | 1,527,440 |
| Events in quadrant C | 36,473,952 | 583,360 |
| Events in quadrant D | 38,690,205 | 190,469 |
| Mode SS | |||
|---|---|---|---|
| Quadrant | BADHDUFLAG | Total packets | Discarded packets |
| A | 0 | 286 | 0 |
| B | 0 | 286 | 0 |
| C | 0 | 286 | 0 |
| D | 0 | 286 | 0 |
| Mode M9 | |||
|---|---|---|---|
| Quadrant | BADHDUFLAG | Total packets | Discarded packets |
| A | 0 | 6 | 0 |
| B | 0 | 6 | 0 |
| C | 0 | 6 | 0 |
| D | 0 | 6 | 0 |
| Mode M0 | |||
|---|---|---|---|
| Quadrant | BADHDUFLAG | Total packets | Discarded packets |
| A | 0 | 39544 | 2 |
| B | 0 | 36763 | 2 |
| C | 0 | 117750 | 2 |
| D | 0 | 124100 | 3 |
| Quadrant | Total seconds | Saturated seconds | Saturation percentage |
|---|---|---|---|
| A | 14170 | 299 | 2.110092% |
| B | 14170 | 545 | 3.846154% |
| C | 14170 | 13491 | 95.208186% |
| D | 14169 | 14169 | 100.000000% |
Noise dominated data is calculated using 1-second bins in cleaned event files. If a bin has >2000 counts, and if more than 50% of those come from <1% of pixels, then it is considered to be noise-dominated and hence unusable.
| Quadrant | # 1 sec bins | Bins with >0 counts | Bins with >2000 counts | High rate bins dominated by noise | Noise dominated (total time) | Noise dominated (detector-on time) | Marked lightcurve |
|---|---|---|---|---|---|---|---|
| A | 14770 | 14172 | 79 | 79 | 0.53% | 0.56% | 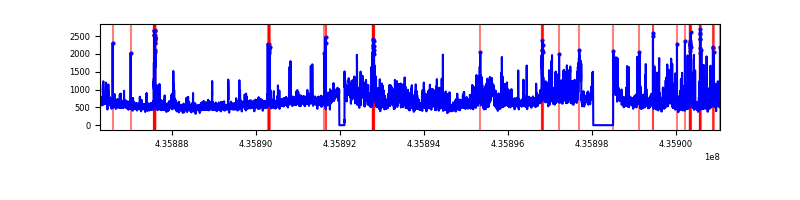 |
| B | 14770 | 14172 | 181 | 181 | 1.23% | 1.28% | 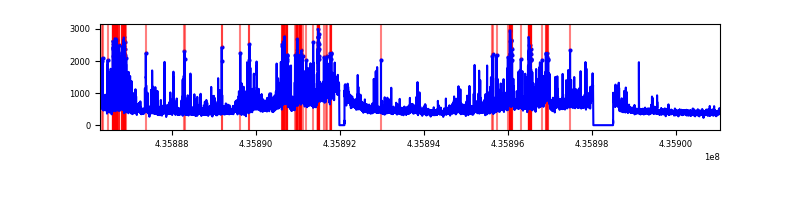 |
| C | 14770 | 14172 | 13218 | 13218 | 89.49% | 93.27% | 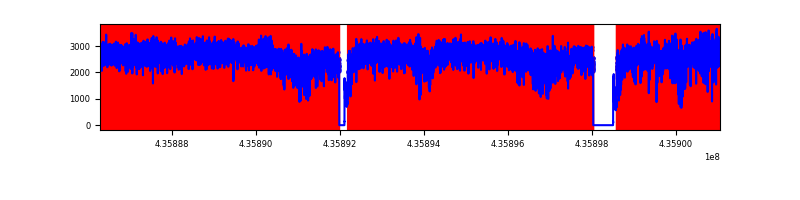 |
| D | 14769 | 14171 | 14017 | 14017 | 94.91% | 98.91% | 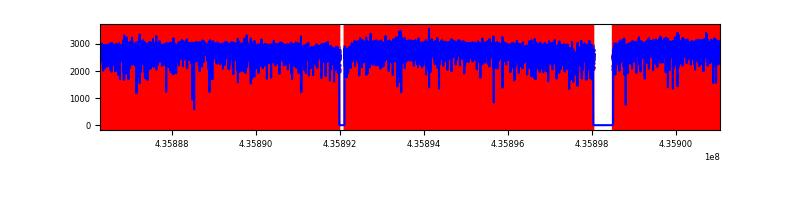 |
Top three noisy pixels from each quadrant. If the there are fewer than three noisy pixels in the level2.evt file, extra rows are filled as -1
| Pixel properties | Quadrant properties | ||||||
|---|---|---|---|---|---|---|---|
| Quadrant | DetID | PixID | Counts | Sigma | Mean | Median | Sigma |
| A | 10 | 83 | 1658079 | 5141.65 | 1558 | 1527 | 322.2 |
| A | 14 | 63 | 911893 | 2825.62 | 1558 | 1527 | 322.2 |
| A | 15 | 223 | 570794 | 1766.91 | 1558 | 1527 | 322.2 |
| B | 4 | 206 | 938836 | 3138.27 | 1541 | 1495 | 298.7 |
| B | 3 | 42 | 592008 | 1977.07 | 1541 | 1495 | 298.7 |
| B | 12 | 3 | 354176 | 1180.8 | 1541 | 1495 | 298.7 |
| C | 15 | 142 | 24988839 | 161175.31 | 660 | 662 | 155.0 |
| C | 15 | 126 | 4362554 | 28134.48 | 660 | 662 | 155.0 |
| C | 15 | 158 | 1412214 | 9104.6 | 660 | 662 | 155.0 |
| D | 8 | 192 | 34696473 | 456079.27 | 247 | 237 | 76.1 |
| D | 4 | 216 | 745465 | 9795.96 | 247 | 237 | 76.1 |
| D | 4 | 221 | 564449 | 7416.52 | 247 | 237 | 76.1 |
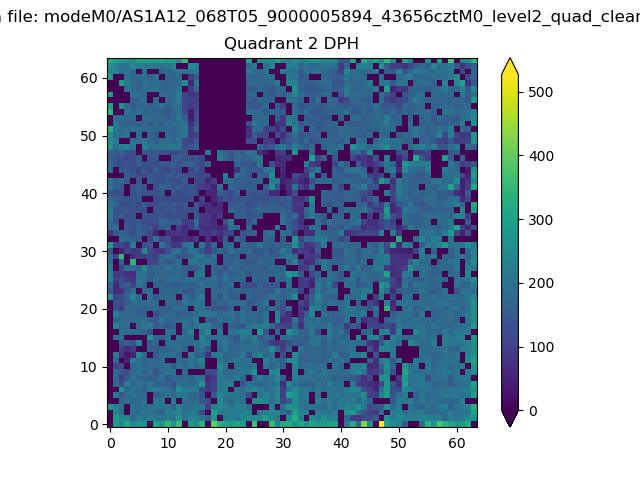
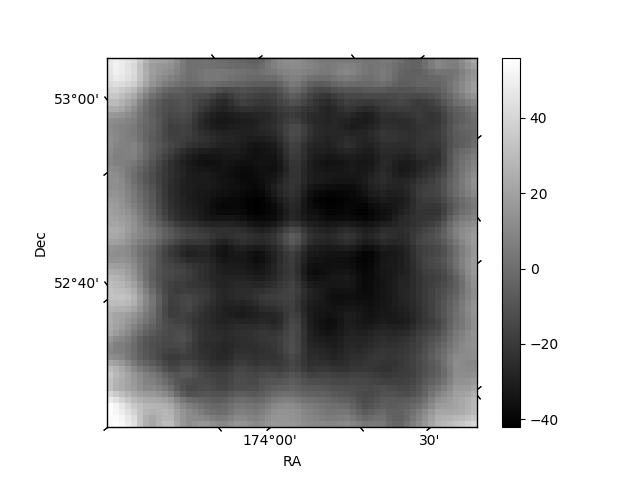
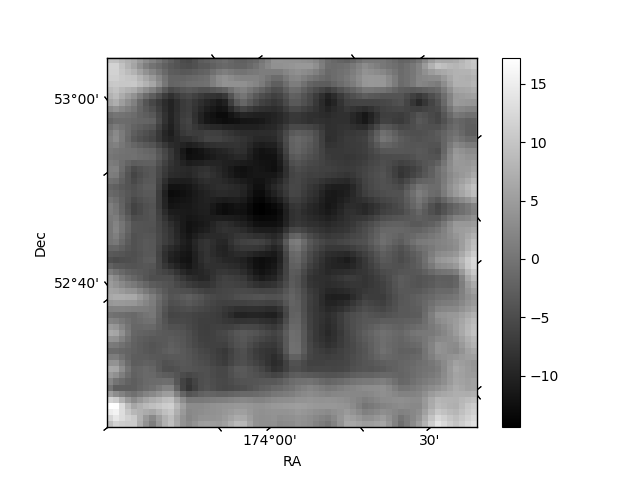
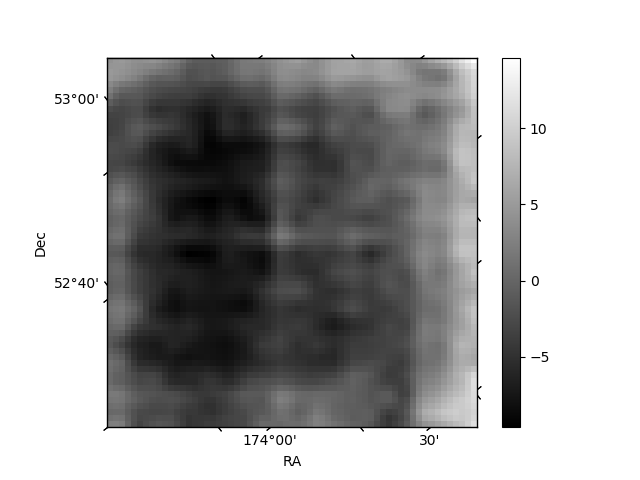
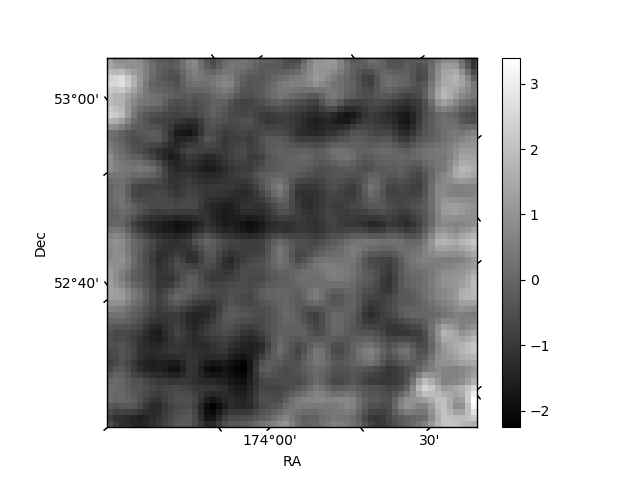
Histogram calculated using DETX and DETY for each event in the final _common_clean file
| Quadrant A | 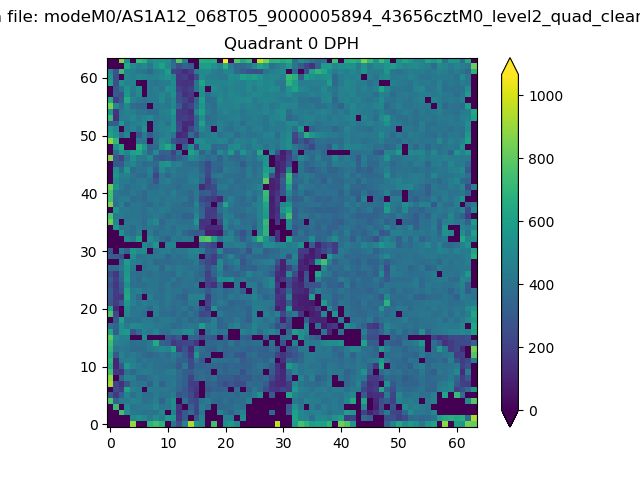 |
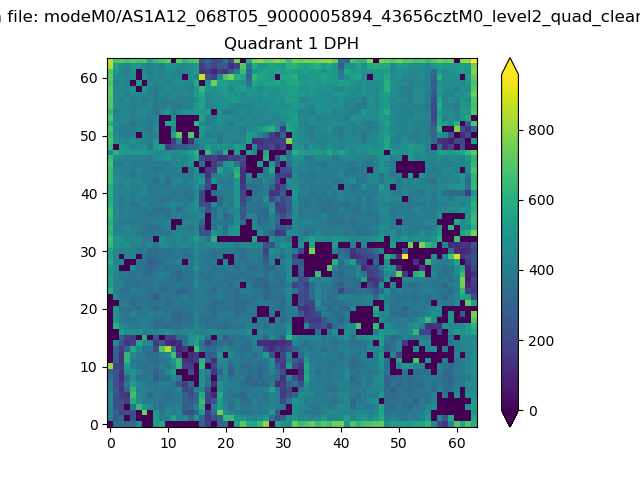 |
Quadrant B |
|---|---|---|---|
| Quadrant D | 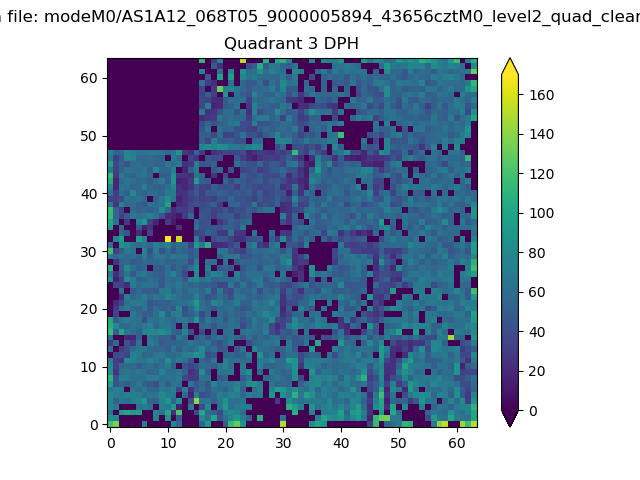 |
 |
Quadrant C |
| Plot type | Count rate plots | Images |
|---|---|---|
| Comparison with Poisson distribution Blue bars denote a histogram of data divided into 1 sec bins. Red curve is a Poisson curve with rate = median count rate of data. |
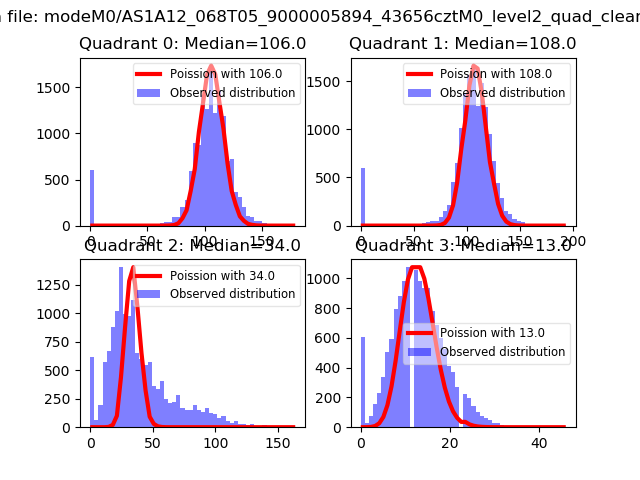 |
 |
| Quadrant-wise count rates Data is divided into 100 sec bins |
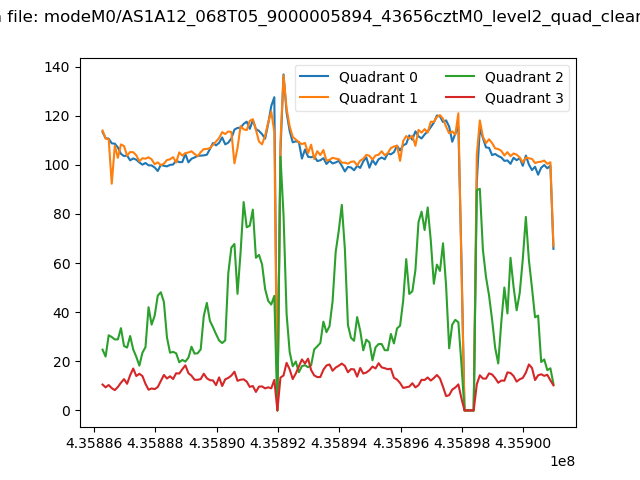 |
|
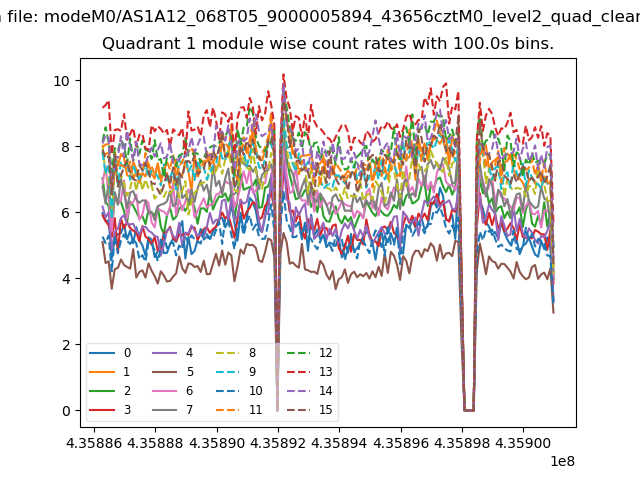
| Module-wise count rates for Quadrant A Data is divided into 100 sec bins |
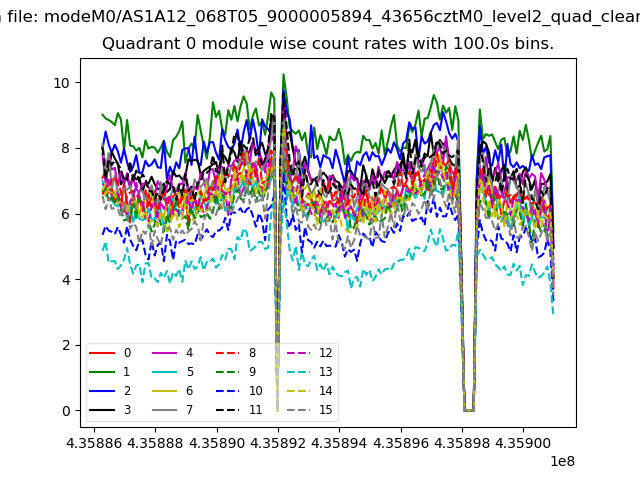 |
 |
| Module-wise count rates for Quadrant B Data is divided into 100 sec bins |
 |
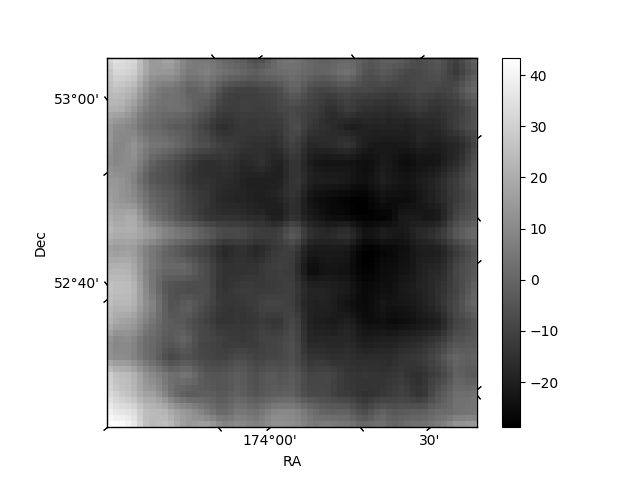 |
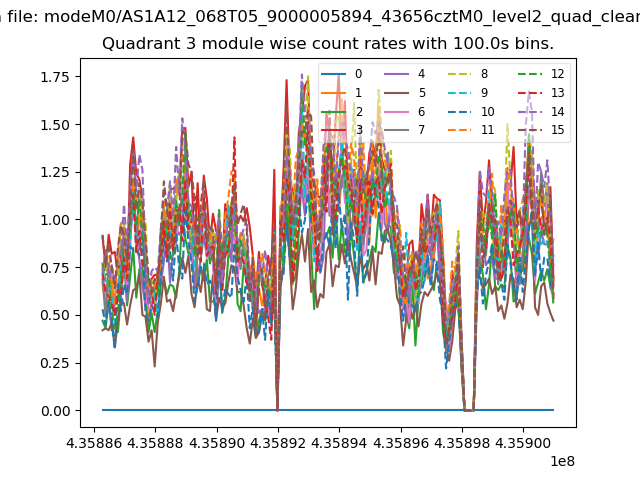
| Module-wise count rates for Quadrant C Data is divided into 100 sec bins |
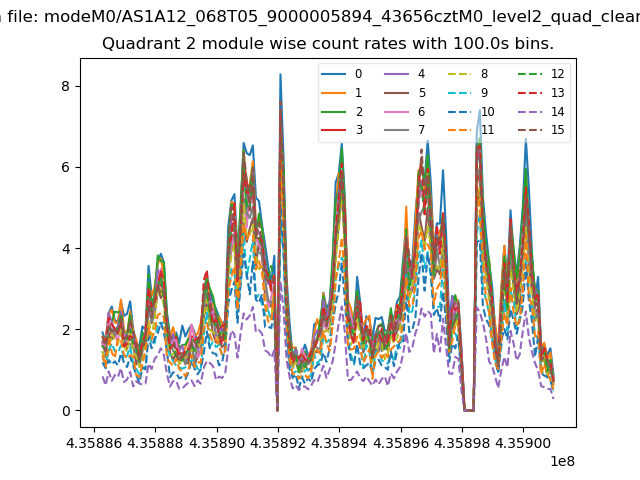 |
 |
| Module-wise count rates for Quadrant D Data is divided into 100 sec bins |
 |
 |
| Parameter | Plot |
|---|---|
| CZT HV Monitor | 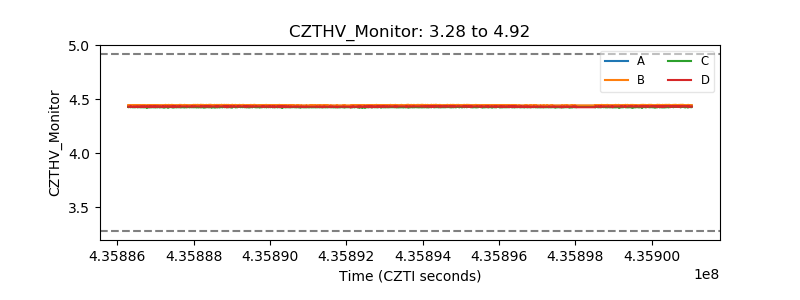 |
| D_VDD | 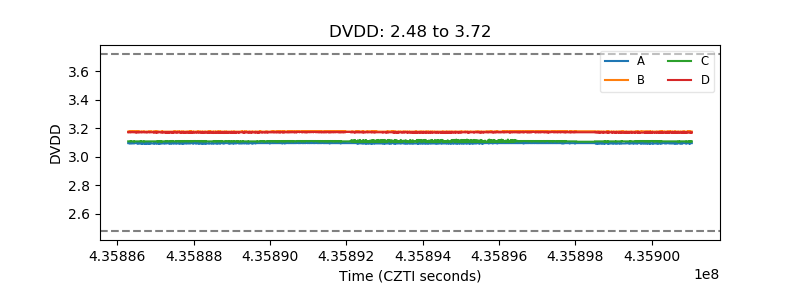 |
| Temperature 1 | 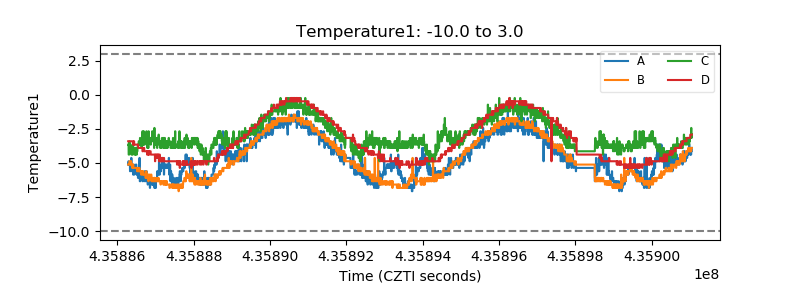 |
| Veto HV Monitor | 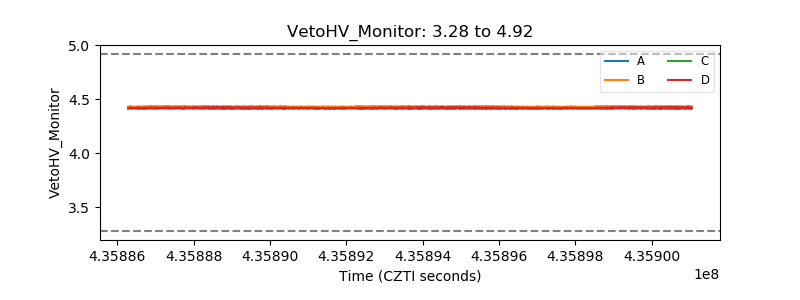 |
| Veto LLD | 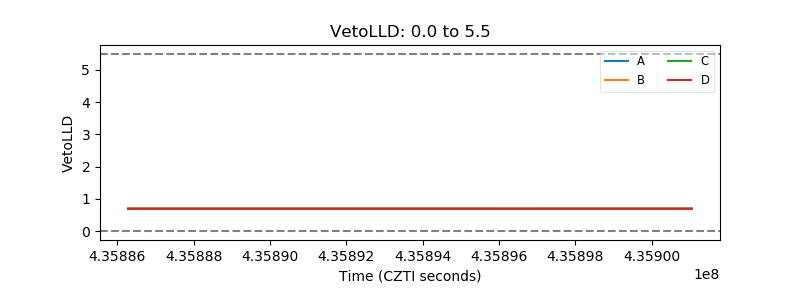 |
| Alpha Counter | 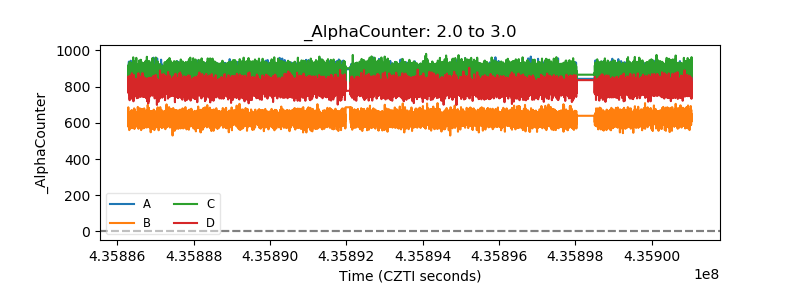 |
| _CPM_Rate | 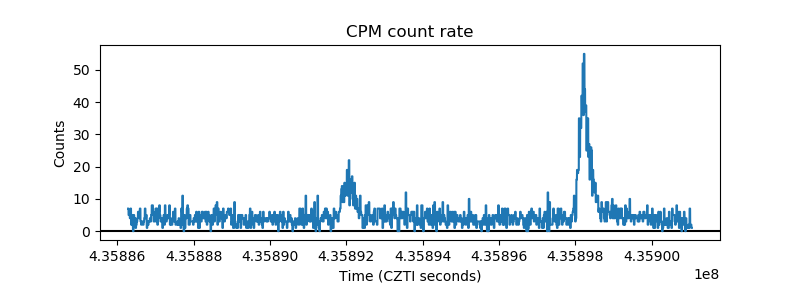 |
| CZT Counter | 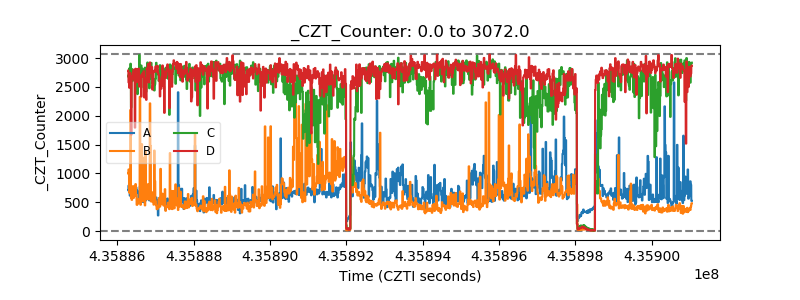 |
| +2.5 Volts monitor | 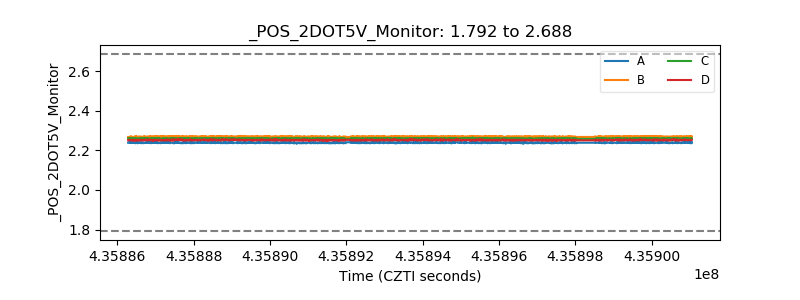 |
| +5 Volts monitor | 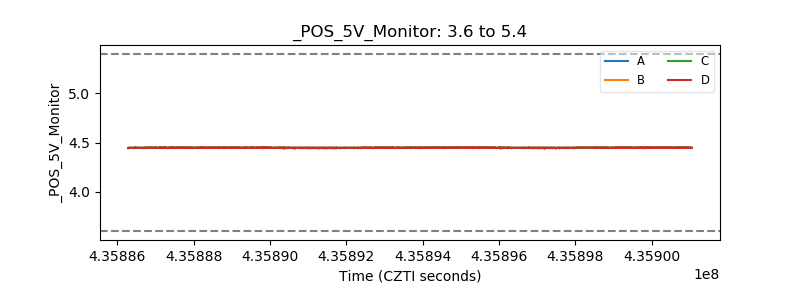 |
| _ROLL_ROT | 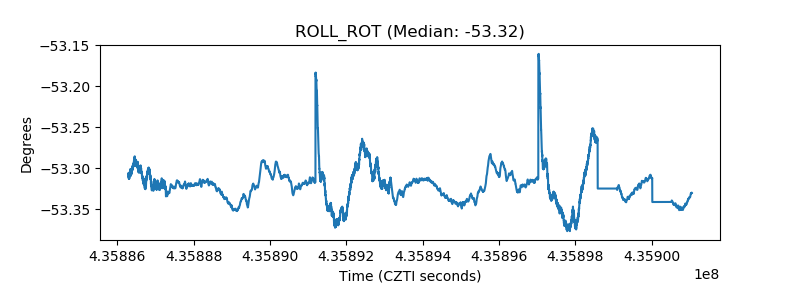 |
| _Roll_DEC | 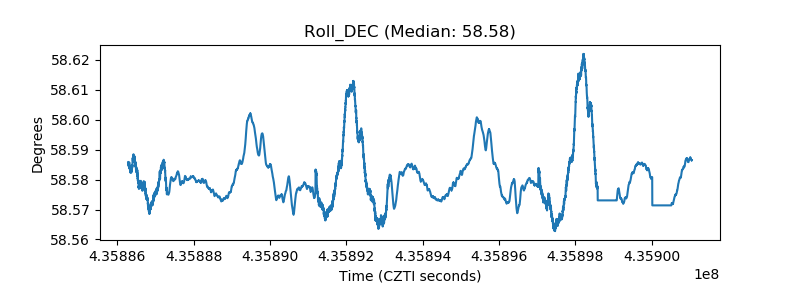 |
| _Roll_RA | 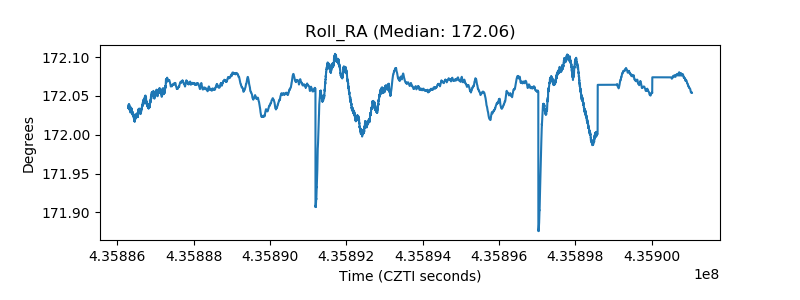 |
| Veto Counter | 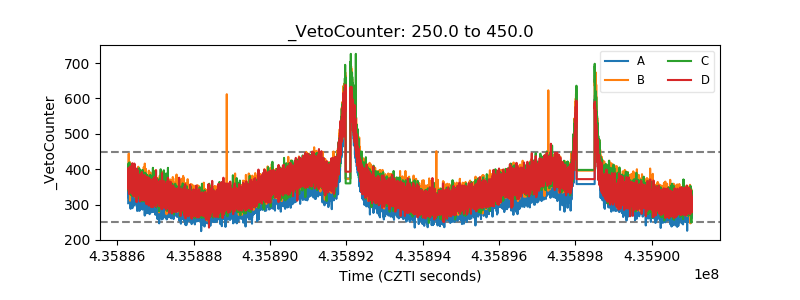 |