| Param | Original file | Final file |
|---|---|---|
| Filename | modeM0/AS1A12_068T05_9000005894_43660cztM0_level2.fits | modeM0/AS1A12_068T05_9000005894_43660cztM0_level2_quad_clean.evt |
| Size (bytes) | 988,603,200 | 90,743,040 |
| Size | 942.8 MB | 86.5 MB |
| Events in quadrant A | 5,975,154 | 730,477 |
| Events in quadrant B | 3,858,885 | 749,918 |
| Events in quadrant C | 15,910,553 | 335,392 |
| Events in quadrant D | 10,358,776 | 482,989 |
| Mode SS | |||
|---|---|---|---|
| Quadrant | BADHDUFLAG | Total packets | Discarded packets |
| A | 0 | 132 | 0 |
| B | 0 | 132 | 0 |
| C | 0 | 132 | 0 |
| D | 0 | 132 | 0 |
| Mode M9 | |||
|---|---|---|---|
| Quadrant | BADHDUFLAG | Total packets | Discarded packets |
| A | 0 | 10 | 0 |
| B | 0 | 10 | 0 |
| C | 0 | 10 | 0 |
| D | 0 | 10 | 0 |
| Mode M0 | |||
|---|---|---|---|
| Quadrant | BADHDUFLAG | Total packets | Discarded packets |
| A | 0 | 22365 | 1 |
| B | 0 | 15696 | 1 |
| C | 0 | 51523 | 8 |
| D | 0 | 35178 | 1 |
| Quadrant | Total seconds | Saturated seconds | Saturation percentage |
|---|---|---|---|
| A | 6364 | 310 | 4.871150% |
| B | 6364 | 89 | 1.398492% |
| C | 6364 | 5589 | 87.822124% |
| D | 6364 | 2900 | 45.568825% |
Noise dominated data is calculated using 1-second bins in cleaned event files. If a bin has >2000 counts, and if more than 50% of those come from <1% of pixels, then it is considered to be noise-dominated and hence unusable.
| Quadrant | # 1 sec bins | Bins with >0 counts | Bins with >2000 counts | High rate bins dominated by noise | Noise dominated (total time) | Noise dominated (detector-on time) | Marked lightcurve |
|---|---|---|---|---|---|---|---|
| A | 7419 | 6365 | 131 | 131 | 1.77% | 2.06% | 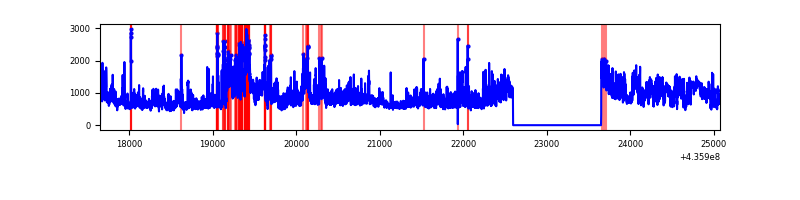 |
| B | 7419 | 6365 | 18 | 18 | 0.24% | 0.28% | 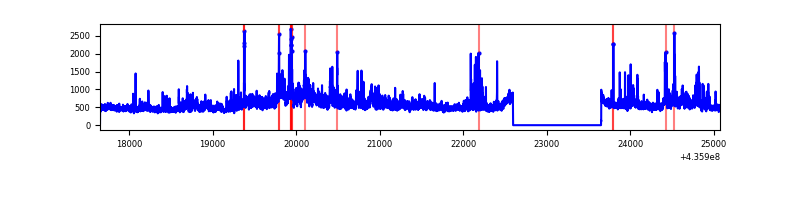 |
| C | 7419 | 6365 | 5541 | 5541 | 74.69% | 87.05% | 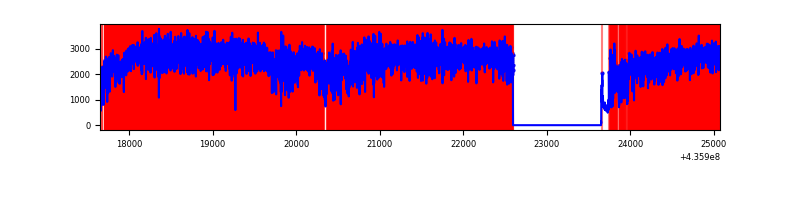 |
| D | 7419 | 6365 | 2439 | 2439 | 32.88% | 38.32% | 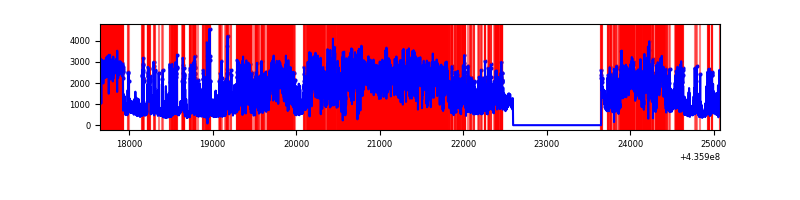 |
Top three noisy pixels from each quadrant. If the there are fewer than three noisy pixels in the level2.evt file, extra rows are filled as -1
| Pixel properties | Quadrant properties | ||||||
|---|---|---|---|---|---|---|---|
| Quadrant | DetID | PixID | Counts | Sigma | Mean | Median | Sigma |
| A | 14 | 63 | 1291785 | 8730.89 | 722 | 706 | 147.9 |
| A | 10 | 83 | 818868 | 5532.8 | 722 | 706 | 147.9 |
| A | 15 | 223 | 583467 | 3940.91 | 722 | 706 | 147.9 |
| B | 4 | 206 | 540579 | 3858.6 | 721 | 702 | 139.9 |
| B | 5 | 235 | 146234 | 1040.15 | 721 | 702 | 139.9 |
| B | 0 | 230 | 129964 | 923.86 | 721 | 702 | 139.9 |
| C | 15 | 142 | 12468346 | 156716.84 | 338 | 339 | 79.6 |
| C | 15 | 158 | 905931 | 11382.86 | 338 | 339 | 79.6 |
| C | 15 | 157 | 747572 | 9392.36 | 338 | 339 | 79.6 |
| D | 12 | 6 | 3193506 | 21872.33 | 538 | 522 | 146.0 |
| D | 7 | 80 | 1113192 | 7621.92 | 538 | 522 | 146.0 |
| D | 8 | 192 | 724456 | 4959.04 | 538 | 522 | 146.0 |
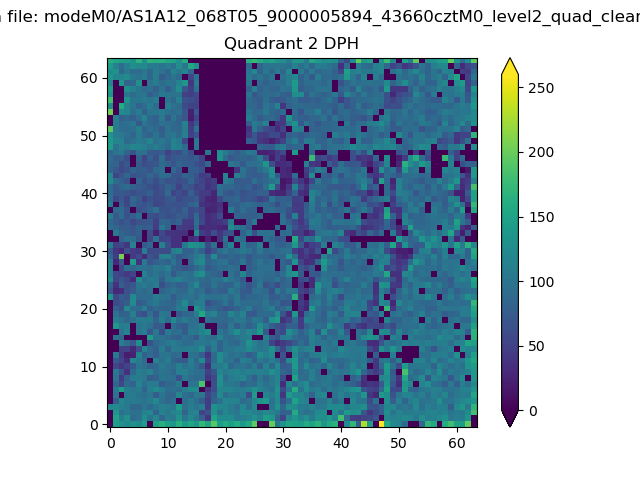
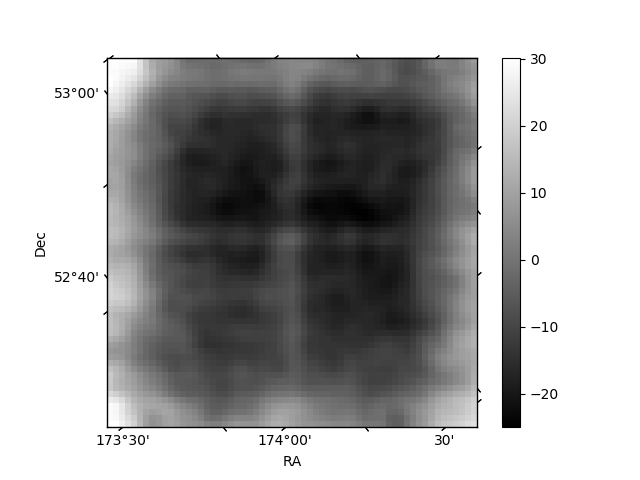
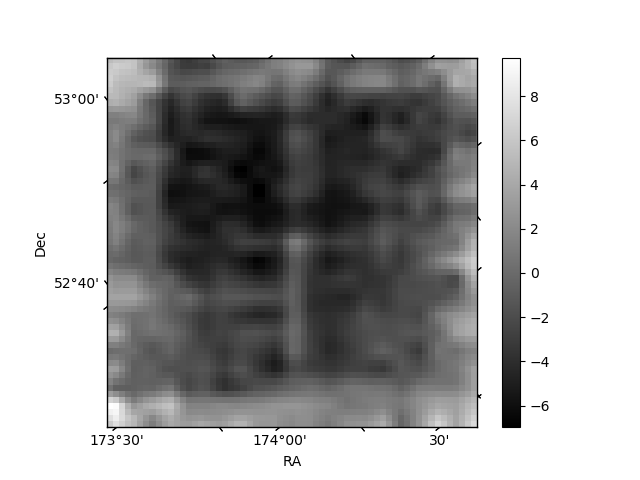
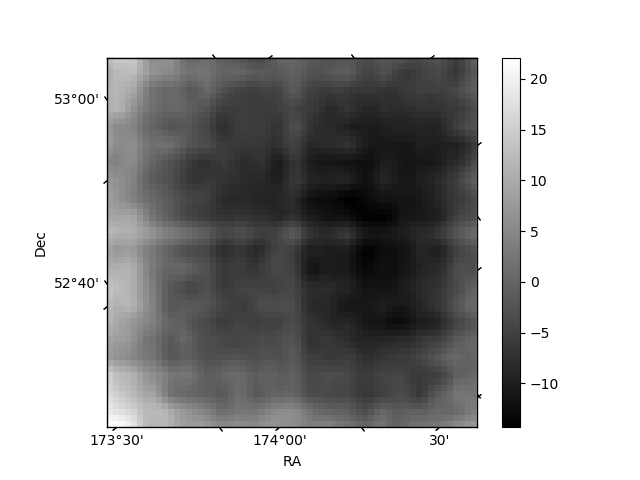
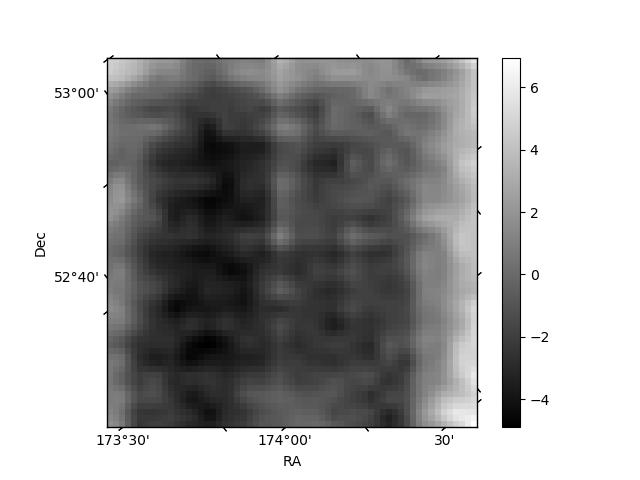
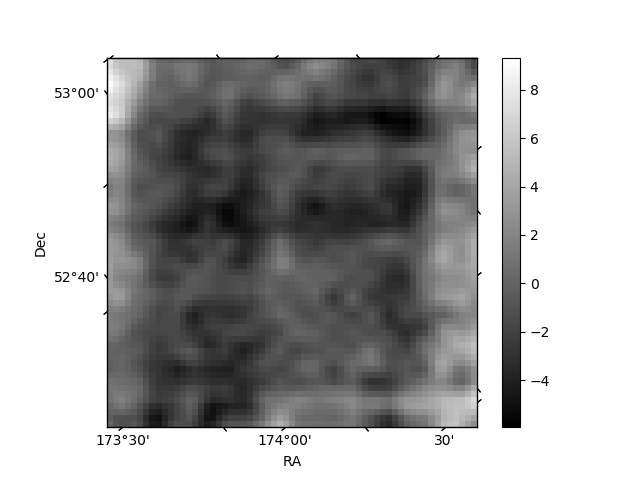
Histogram calculated using DETX and DETY for each event in the final _common_clean file
| Quadrant A | 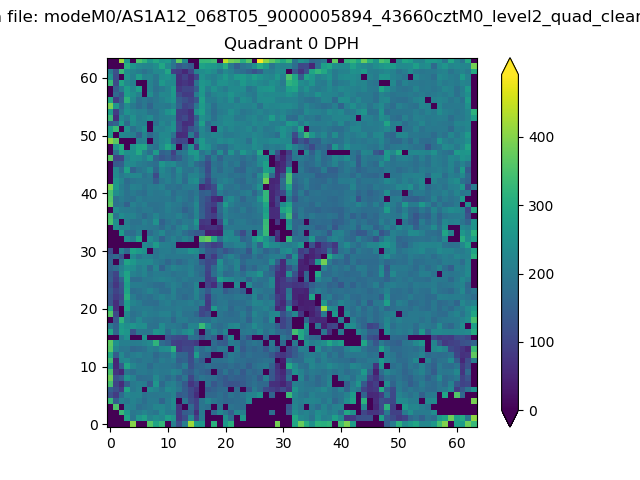 |
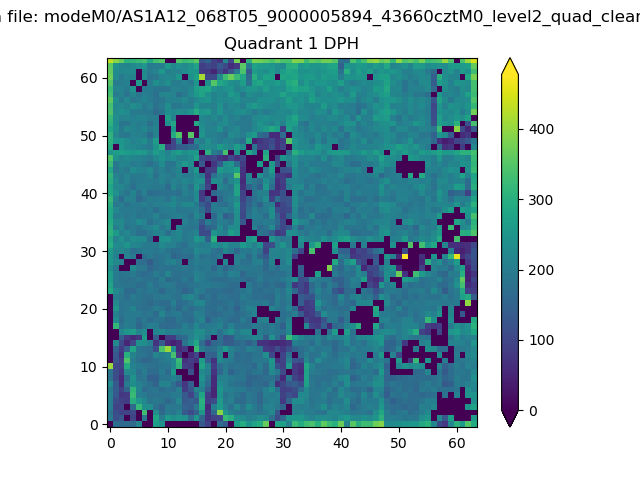 |
Quadrant B |
|---|---|---|---|
| Quadrant D | 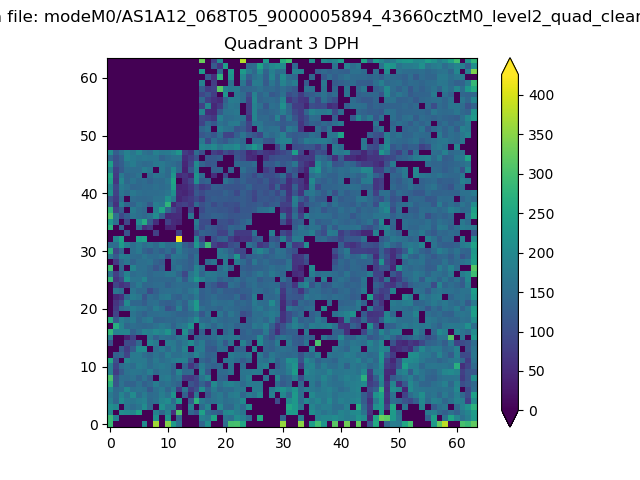 |
 |
Quadrant C |
| Plot type | Count rate plots | Images |
|---|---|---|
| Comparison with Poisson distribution Blue bars denote a histogram of data divided into 1 sec bins. Red curve is a Poisson curve with rate = median count rate of data. |
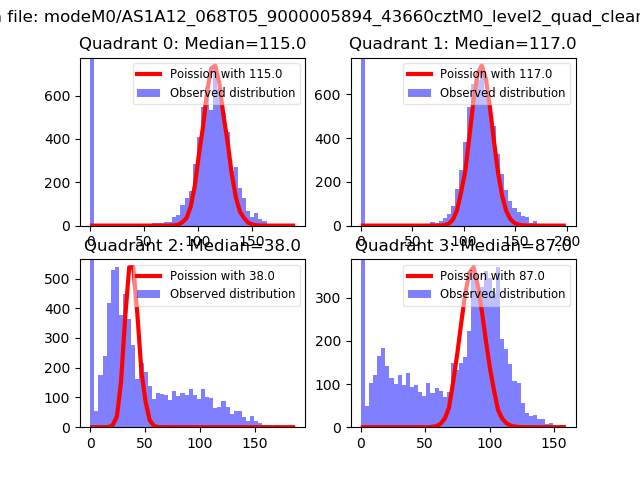 |
 |
| Quadrant-wise count rates Data is divided into 100 sec bins |
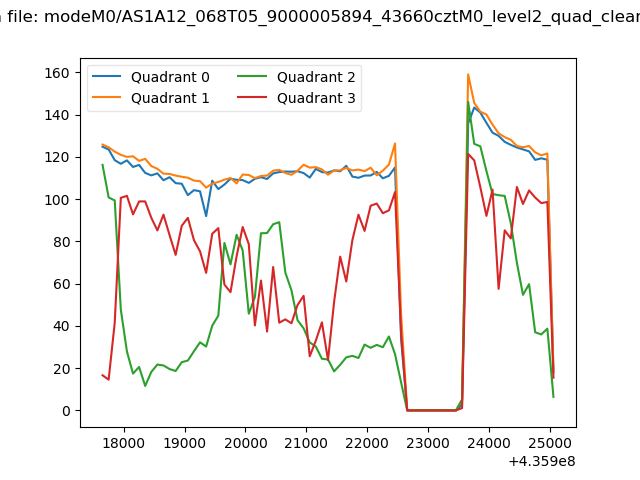 |
|
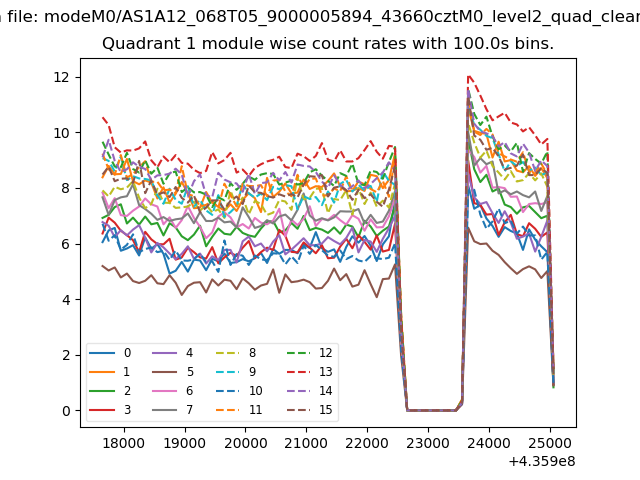
| Module-wise count rates for Quadrant A Data is divided into 100 sec bins |
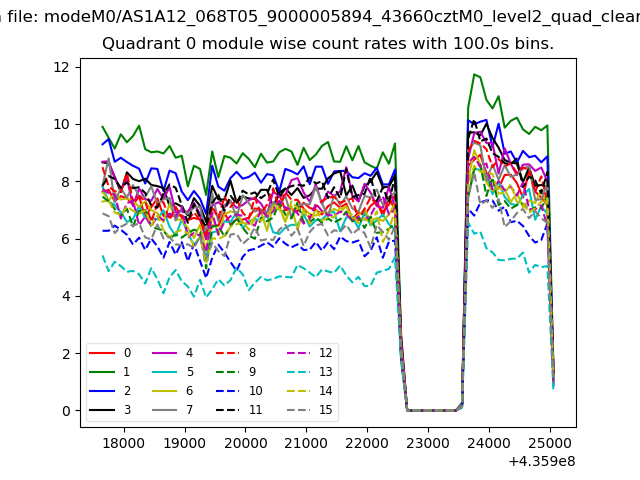 |
 |
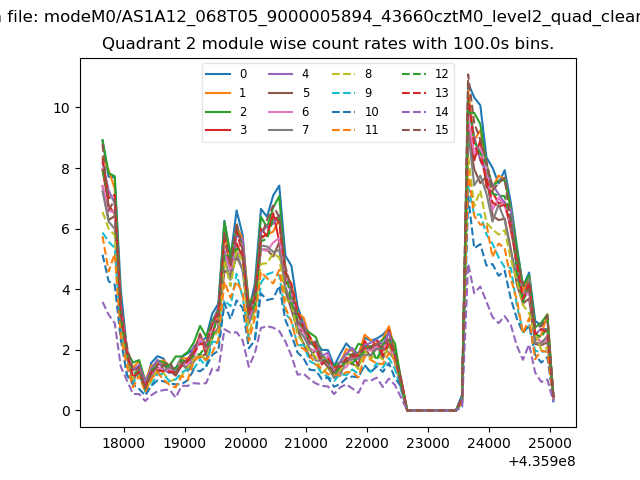
| Module-wise count rates for Quadrant B Data is divided into 100 sec bins |
 |
 |
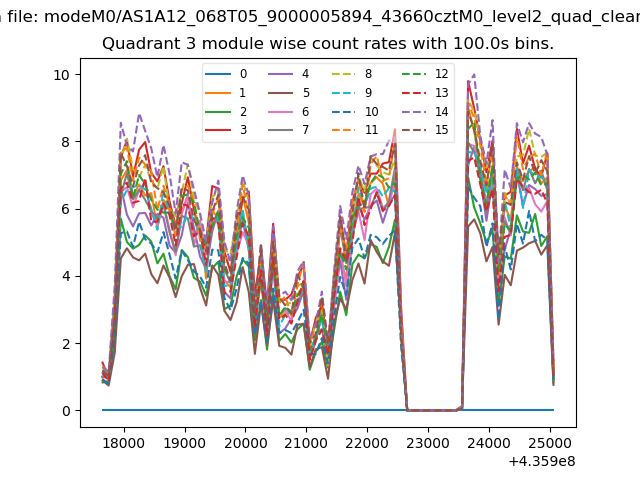
| Module-wise count rates for Quadrant C Data is divided into 100 sec bins |
 |
 |
| Module-wise count rates for Quadrant D Data is divided into 100 sec bins |
 |
 |
| Parameter | Plot |
|---|---|
| CZT HV Monitor |  |
| D_VDD | 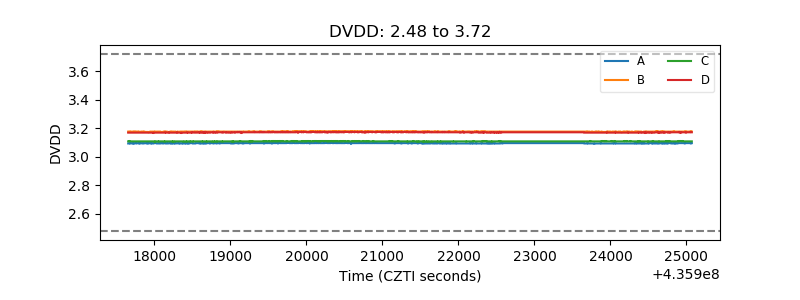 |
| Temperature 1 | 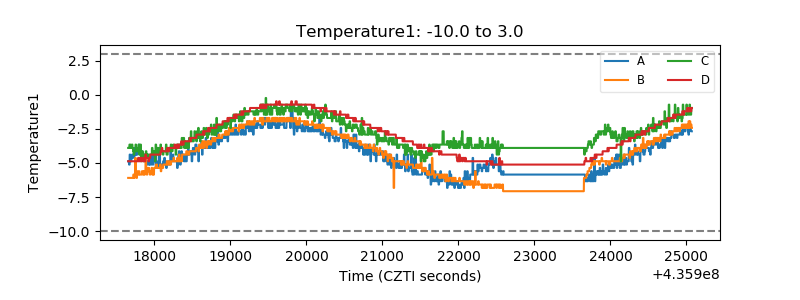 |
| Veto HV Monitor | 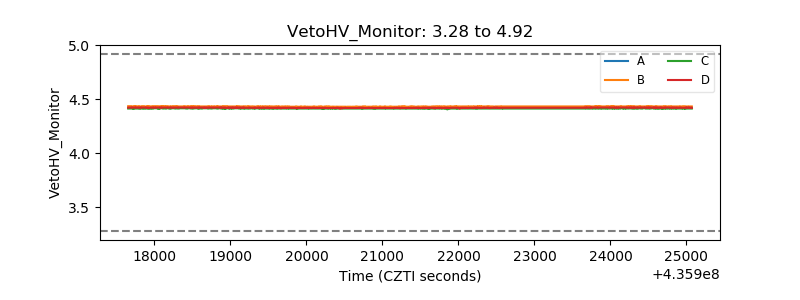 |
| Veto LLD | 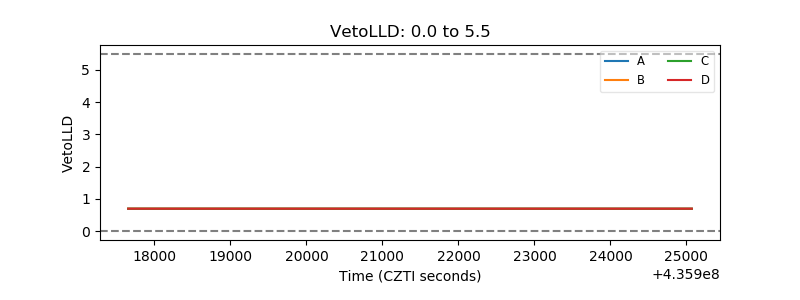 |
| Alpha Counter | 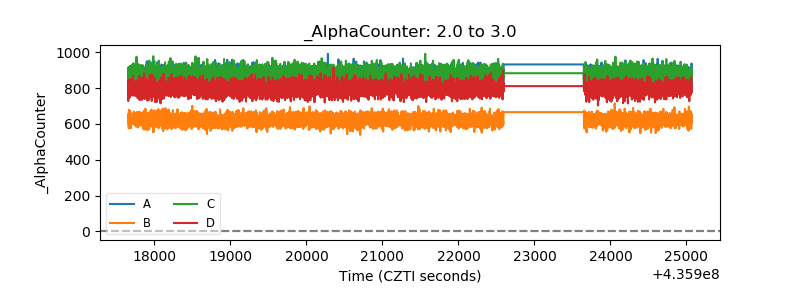 |
| _CPM_Rate | 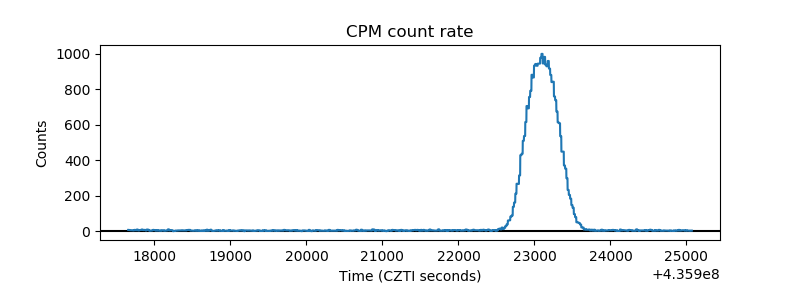 |
| CZT Counter | 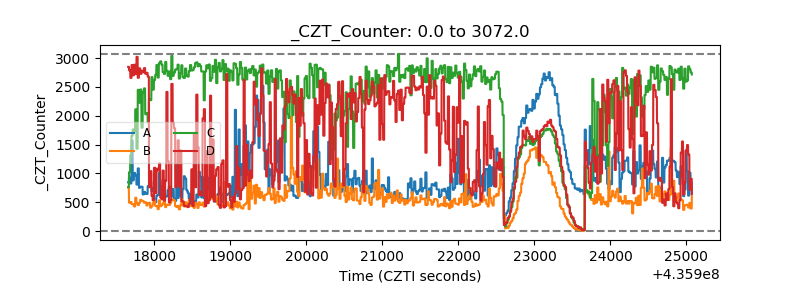 |
| +2.5 Volts monitor | 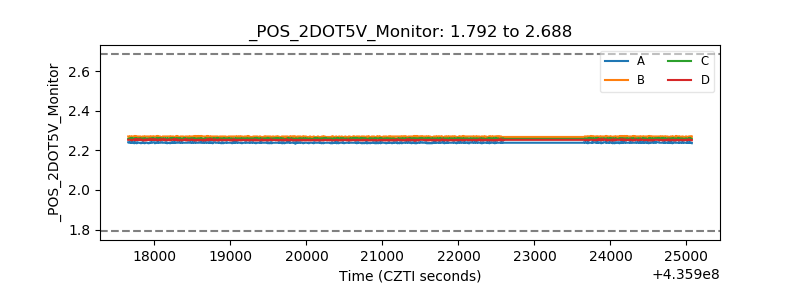 |
| +5 Volts monitor | 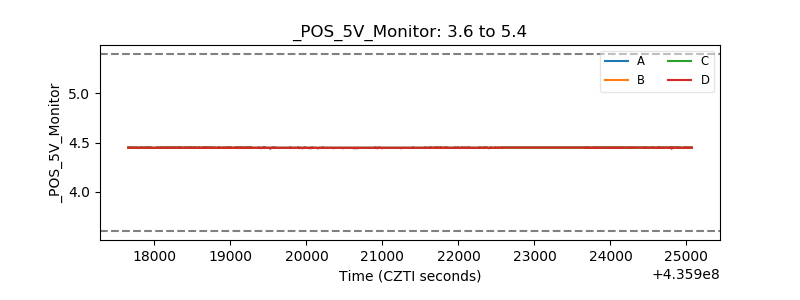 |
| _ROLL_ROT | 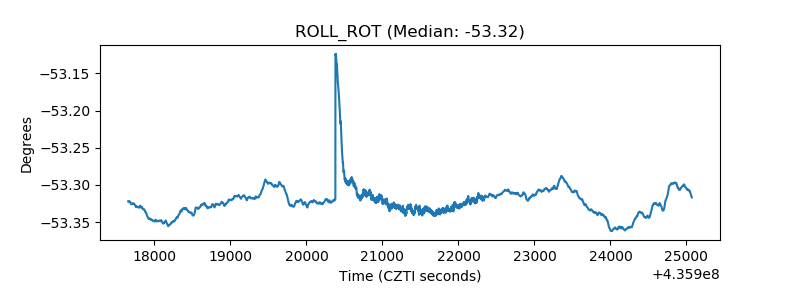 |
| _Roll_DEC | 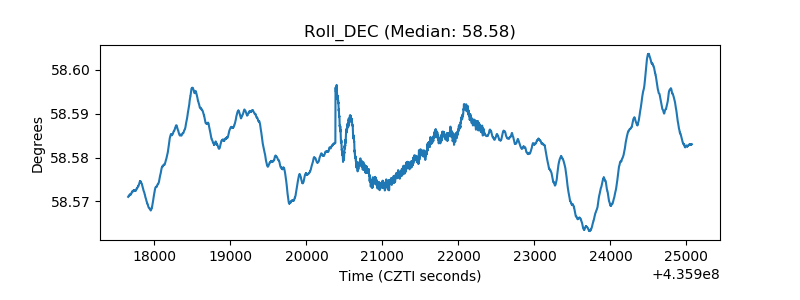 |
| _Roll_RA | 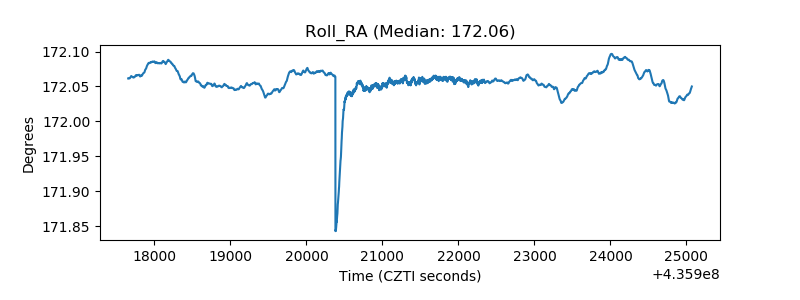 |
| Veto Counter | 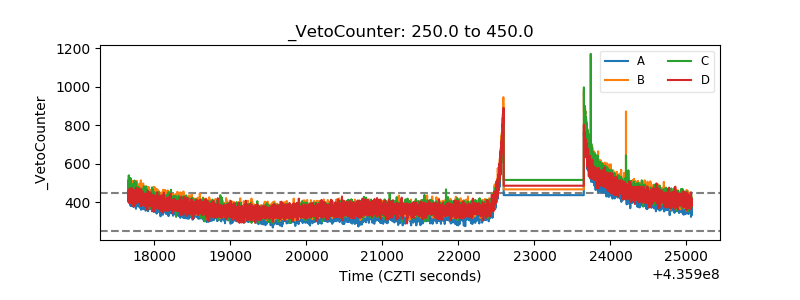 |