| Param | Original file | Final file |
|---|---|---|
| Filename | modeM0/AS1A12_068T05_9000005894_43661cztM0_level2.fits | modeM0/AS1A12_068T05_9000005894_43661cztM0_level2_quad_clean.evt |
| Size (bytes) | 851,495,040 | 70,053,120 |
| Size | 812.0 MB | 66.8 MB |
| Events in quadrant A | 5,396,042 | 629,162 |
| Events in quadrant B | 4,661,177 | 607,635 |
| Events in quadrant C | 13,165,090 | 91,173 |
| Events in quadrant D | 7,883,530 | 418,022 |
| Mode SS | |||
|---|---|---|---|
| Quadrant | BADHDUFLAG | Total packets | Discarded packets |
| A | 0 | 108 | 0 |
| B | 0 | 108 | 0 |
| C | 0 | 108 | 0 |
| D | 0 | 108 | 0 |
| Mode M9 | |||
|---|---|---|---|
| Quadrant | BADHDUFLAG | Total packets | Discarded packets |
| A | 0 | 12 | 0 |
| B | 0 | 12 | 0 |
| C | 0 | 12 | 0 |
| D | 0 | 12 | 0 |
| Mode M0 | |||
|---|---|---|---|
| Quadrant | BADHDUFLAG | Total packets | Discarded packets |
| A | 0 | 20014 | 1 |
| B | 0 | 17429 | 1 |
| C | 0 | 42761 | 1 |
| D | 0 | 27121 | 1 |
| Quadrant | Total seconds | Saturated seconds | Saturation percentage |
|---|---|---|---|
| A | 5357 | 241 | 4.498787% |
| B | 5358 | 520 | 9.705114% |
| C | 5358 | 4737 | 88.409854% |
| D | 5358 | 1798 | 33.557297% |
Noise dominated data is calculated using 1-second bins in cleaned event files. If a bin has >2000 counts, and if more than 50% of those come from <1% of pixels, then it is considered to be noise-dominated and hence unusable.
| Quadrant | # 1 sec bins | Bins with >0 counts | Bins with >2000 counts | High rate bins dominated by noise | Noise dominated (total time) | Noise dominated (detector-on time) | Marked lightcurve |
|---|---|---|---|---|---|---|---|
| A | 6527 | 5358 | 77 | 77 | 1.18% | 1.44% | 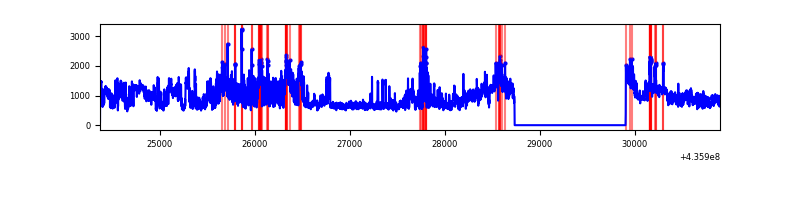 |
| B | 6528 | 5359 | 403 | 403 | 6.17% | 7.52% | 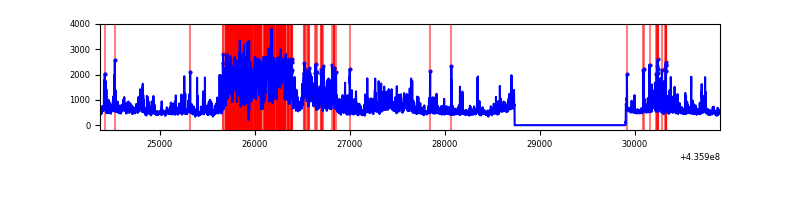 |
| C | 6528 | 5359 | 4546 | 4546 | 69.64% | 84.83% | 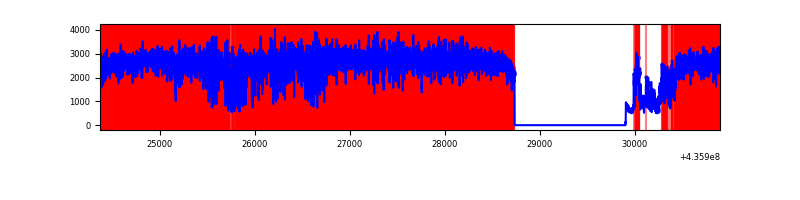 |
| D | 6528 | 5359 | 1561 | 1561 | 23.91% | 29.13% | 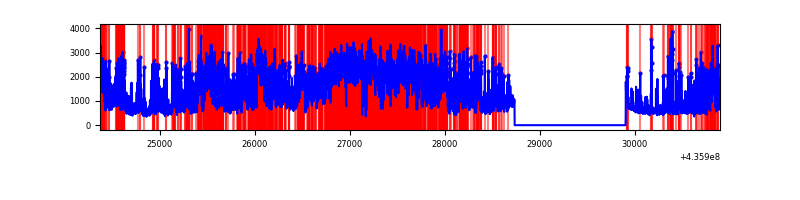 |
Top three noisy pixels from each quadrant. If the there are fewer than three noisy pixels in the level2.evt file, extra rows are filled as -1
| Pixel properties | Quadrant properties | ||||||
|---|---|---|---|---|---|---|---|
| Quadrant | DetID | PixID | Counts | Sigma | Mean | Median | Sigma |
| A | 14 | 63 | 1741831 | 13609.87 | 619 | 607 | 127.9 |
| A | 10 | 83 | 704699 | 5503.37 | 619 | 607 | 127.9 |
| A | 15 | 222 | 321398 | 2507.39 | 619 | 607 | 127.9 |
| B | 4 | 206 | 1485324 | 12812.91 | 598 | 581 | 115.9 |
| B | 5 | 235 | 314874 | 2712.26 | 598 | 581 | 115.9 |
| B | 0 | 219 | 259357 | 2233.16 | 598 | 581 | 115.9 |
| C | 15 | 142 | 10621094 | 161832.46 | 280 | 280 | 65.6 |
| C | 15 | 158 | 988345 | 15055.43 | 280 | 280 | 65.6 |
| C | 15 | 157 | 192059 | 2922.19 | 280 | 280 | 65.6 |
| D | 12 | 233 | 1175957 | 8451.16 | 533 | 515 | 139.1 |
| D | 12 | 6 | 782621 | 5623.16 | 533 | 515 | 139.1 |
| D | 13 | 187 | 522151 | 3750.44 | 533 | 515 | 139.1 |
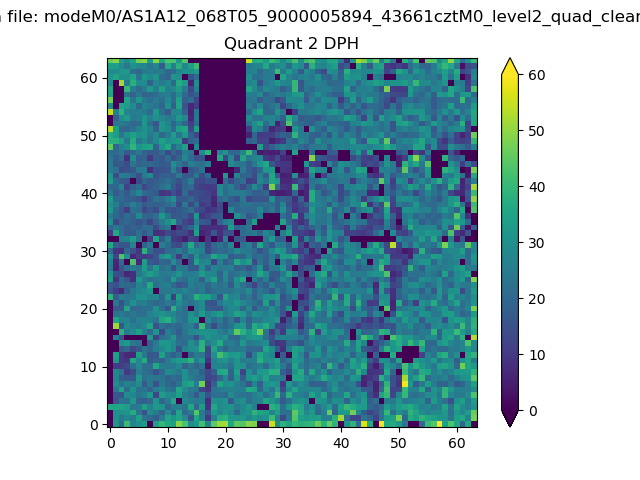
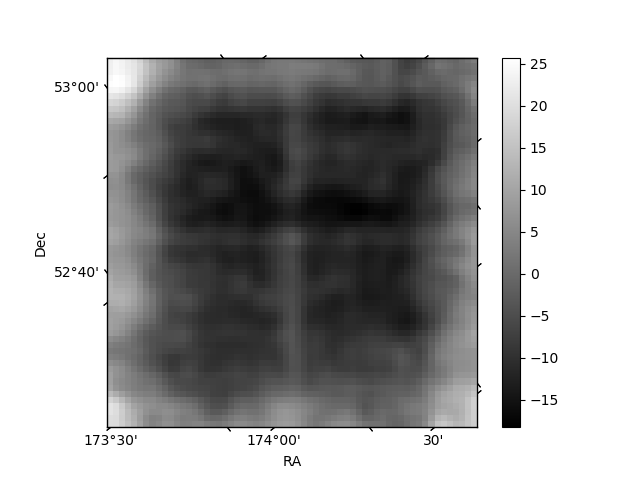
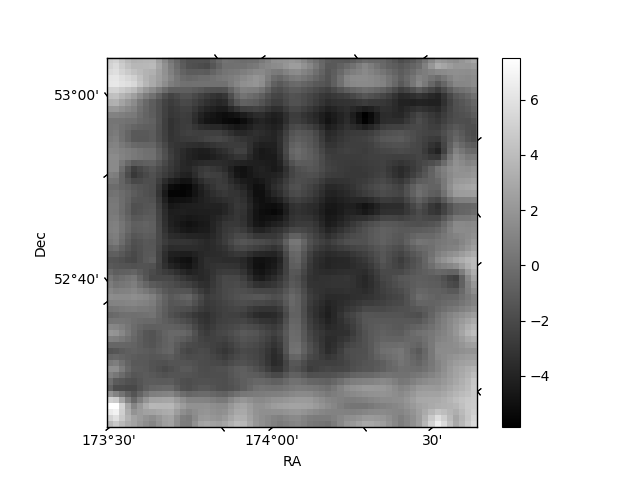
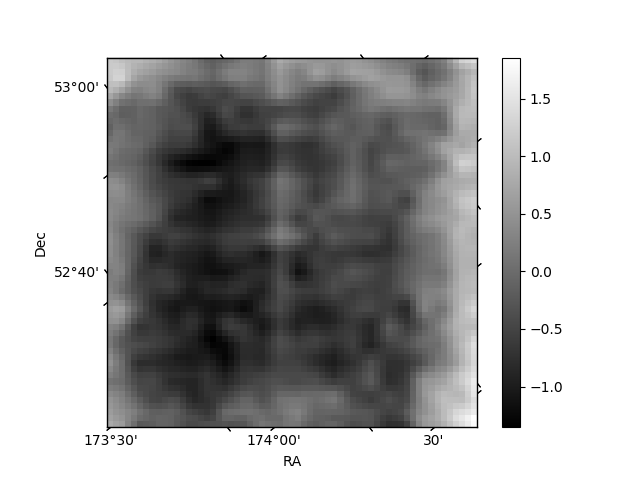
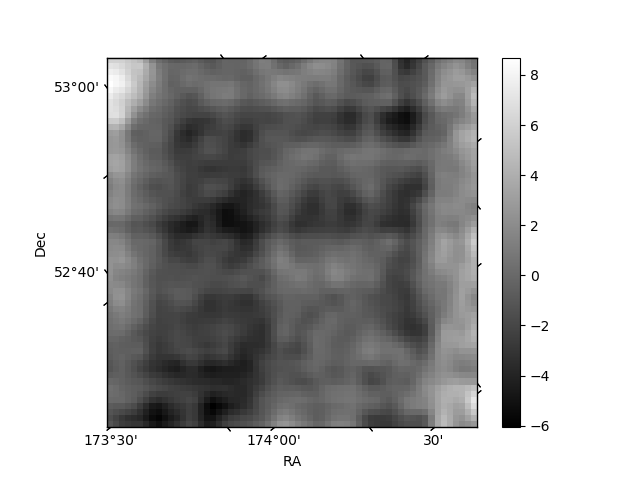
Histogram calculated using DETX and DETY for each event in the final _common_clean file
| Quadrant A | 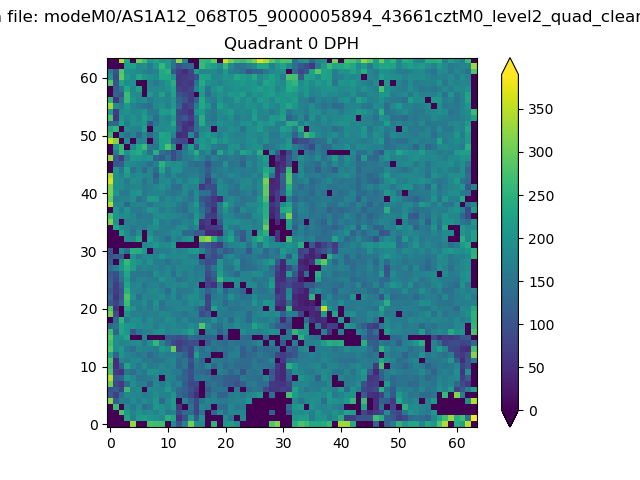 |
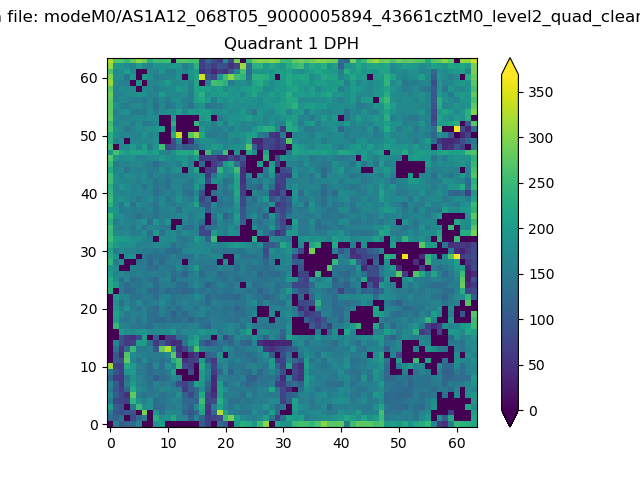 |
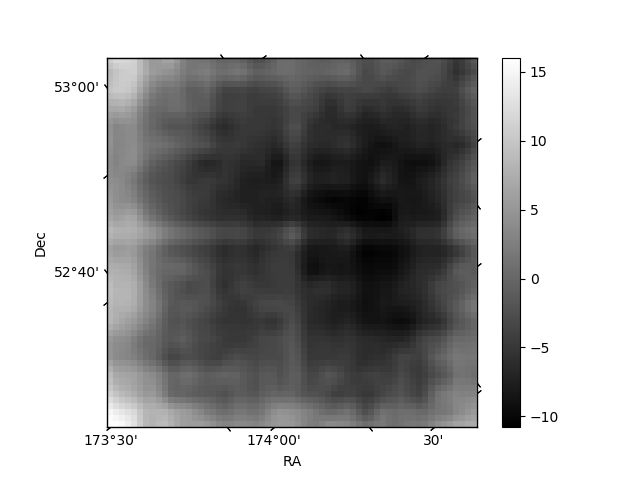
Quadrant B |
|---|---|---|---|
| Quadrant D | 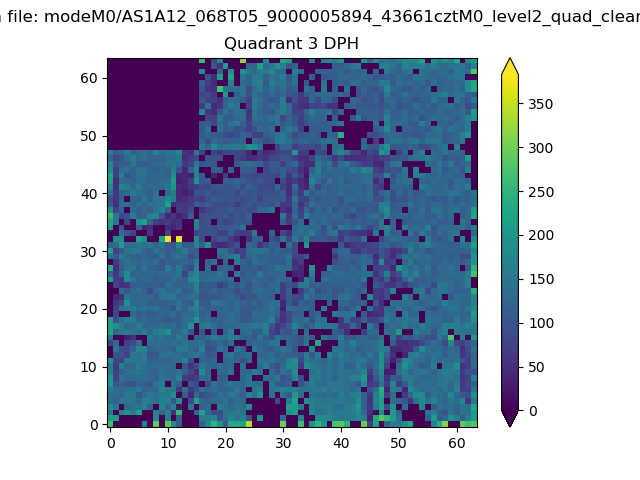 |
 |
Quadrant C |
| Plot type | Count rate plots | Images |
|---|---|---|
| Comparison with Poisson distribution Blue bars denote a histogram of data divided into 1 sec bins. Red curve is a Poisson curve with rate = median count rate of data. |
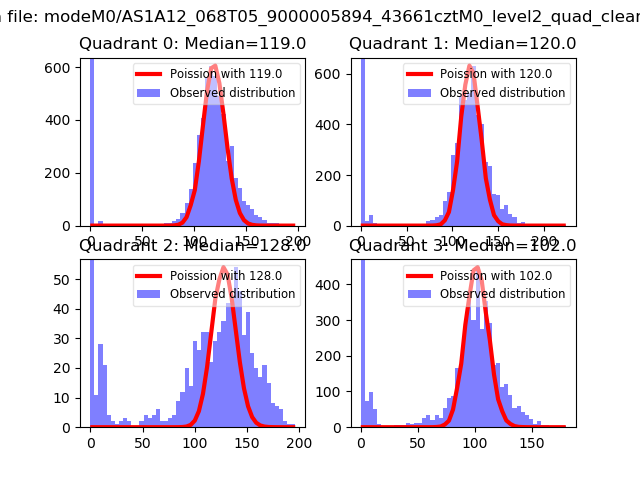 |
 |
| Quadrant-wise count rates Data is divided into 100 sec bins |
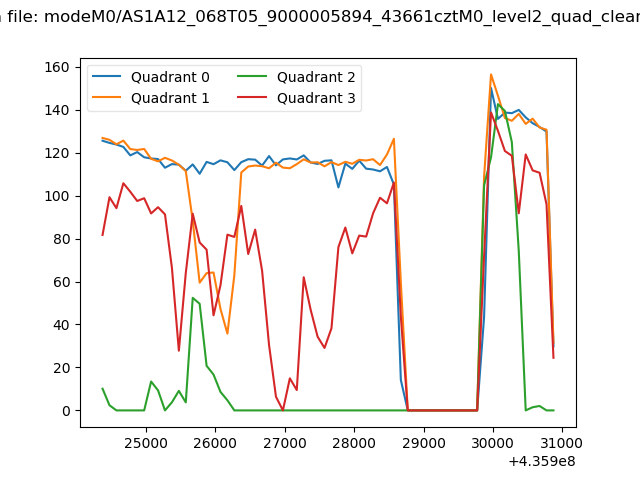 |
|
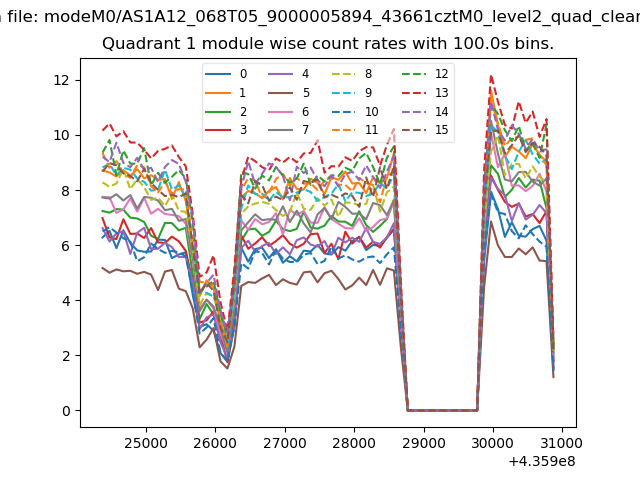
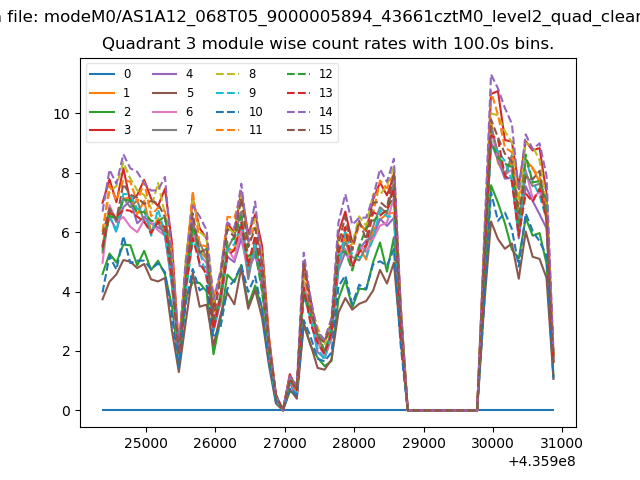
| Module-wise count rates for Quadrant A Data is divided into 100 sec bins |
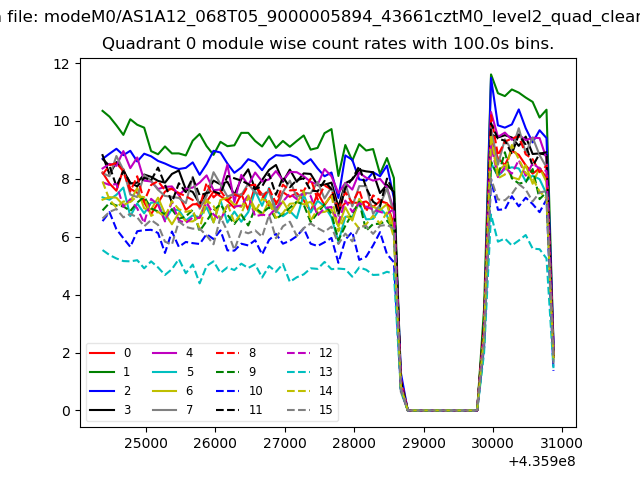 |
 |
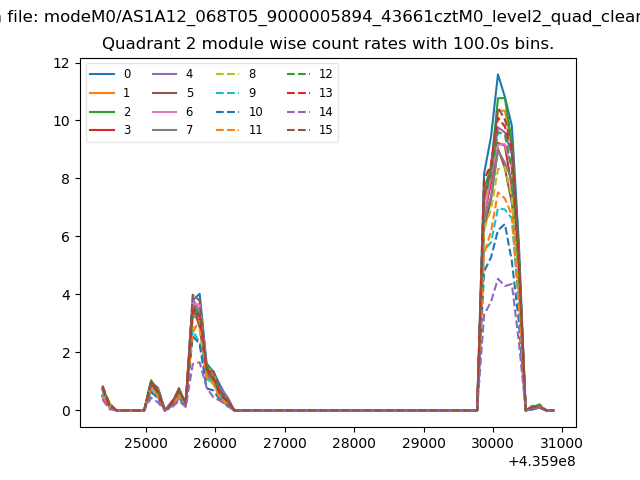
| Module-wise count rates for Quadrant B Data is divided into 100 sec bins |
 |
 |
| Module-wise count rates for Quadrant C Data is divided into 100 sec bins |
 |
 |
| Module-wise count rates for Quadrant D Data is divided into 100 sec bins |
 |
 |
| Parameter | Plot |
|---|---|
| CZT HV Monitor | 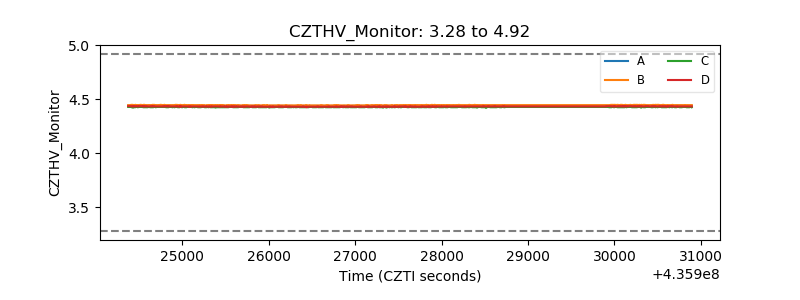 |
| D_VDD | 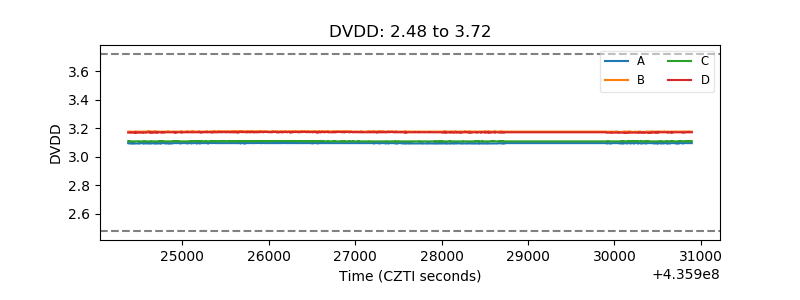 |
| Temperature 1 | 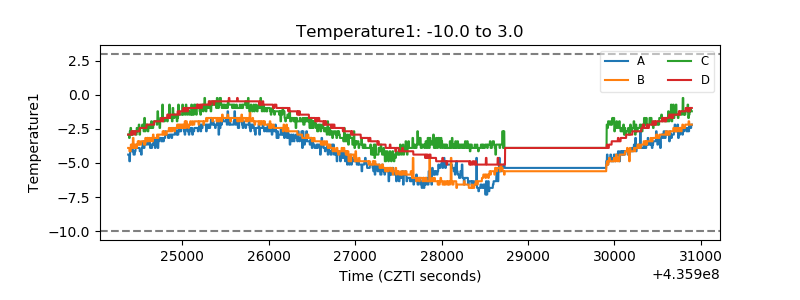 |
| Veto HV Monitor | 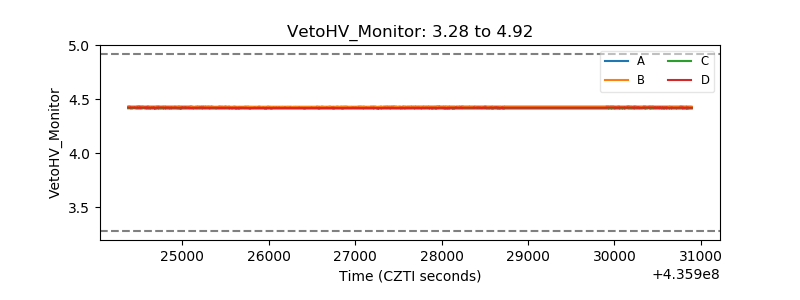 |
| Veto LLD | 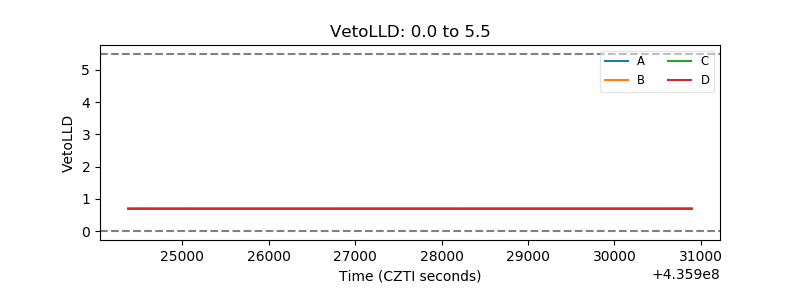 |
| Alpha Counter | 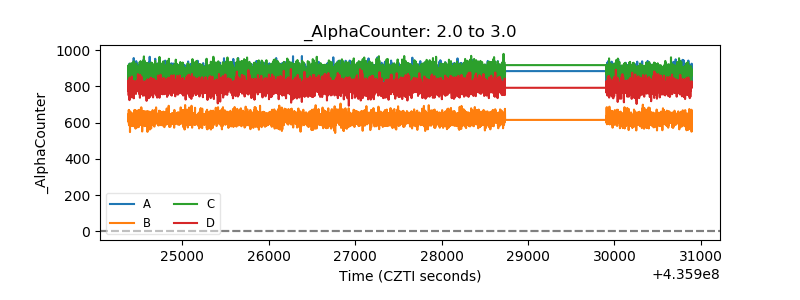 |
| _CPM_Rate | 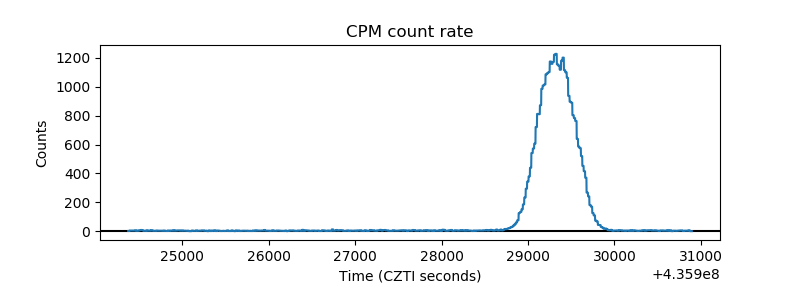 |
| CZT Counter | 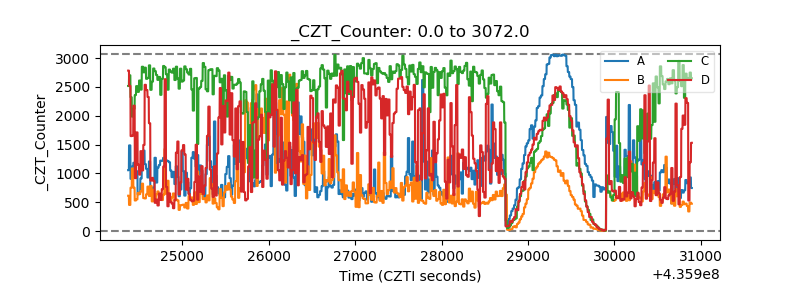 |
| +2.5 Volts monitor | 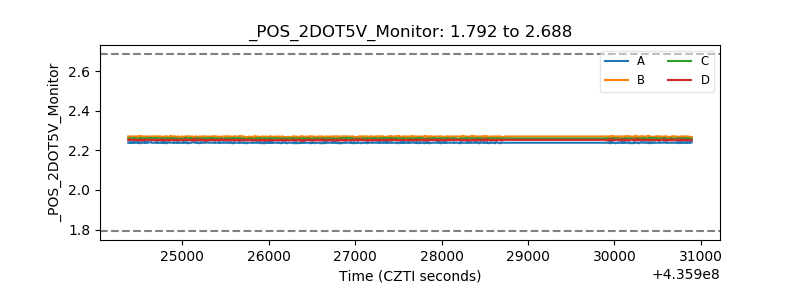 |
| +5 Volts monitor | 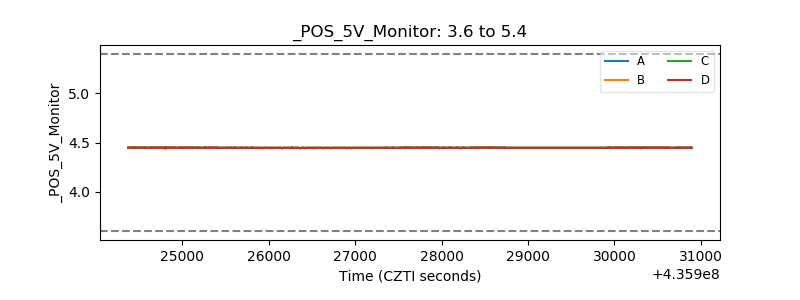 |
| _ROLL_ROT | 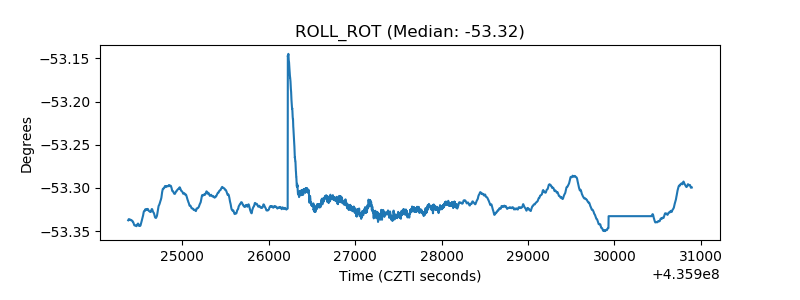 |
| _Roll_DEC | 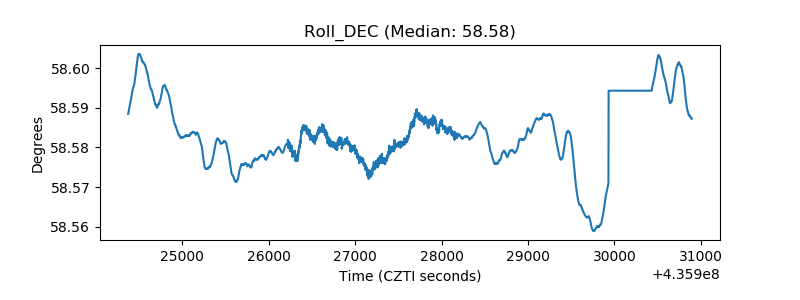 |
| _Roll_RA | 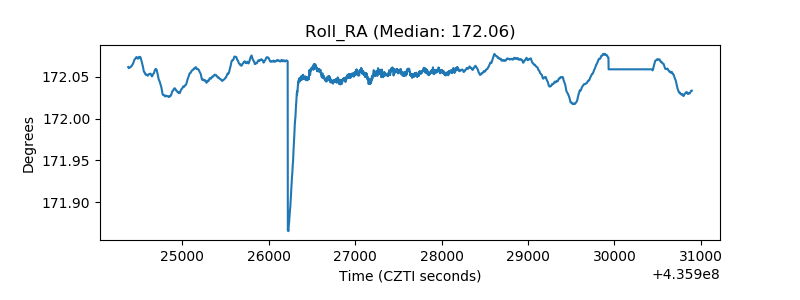 |
| Veto Counter | 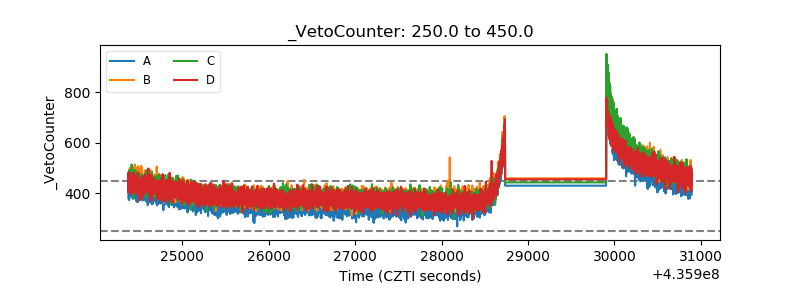 |