| Param | Original file | Final file |
|---|---|---|
| Filename | modeM0/AS1A12_018T01_9000005896_43663cztM0_level2.fits | modeM0/AS1A12_018T01_9000005896_43663cztM0_level2_quad_clean.evt |
| Size (bytes) | 1,108,131,840 | 68,518,080 |
| Size | 1.0 GB | 65.3 MB |
| Events in quadrant A | 5,835,466 | 726,077 |
| Events in quadrant B | 4,336,764 | 745,436 |
| Events in quadrant C | 15,795,203 | 50,224 |
| Events in quadrant D | 14,576,314 | 122,090 |
| Mode SS | |||
|---|---|---|---|
| Quadrant | BADHDUFLAG | Total packets | Discarded packets |
| A | 0 | 124 | 0 |
| B | 0 | 124 | 0 |
| C | 0 | 124 | 0 |
| D | 0 | 124 | 0 |
| Mode M0 | |||
|---|---|---|---|
| Quadrant | BADHDUFLAG | Total packets | Discarded packets |
| A | 0 | 21832 | 1 |
| B | 0 | 17006 | 1 |
| C | 0 | 51058 | 1 |
| D | 0 | 47514 | 5 |
| Mode M9 | |||
|---|---|---|---|
| Quadrant | BADHDUFLAG | Total packets | Discarded packets |
| A | 0 | 12 | 0 |
| B | 0 | 12 | 0 |
| C | 0 | 12 | 0 |
| D | 0 | 12 | 0 |
| Quadrant | Total seconds | Saturated seconds | Saturation percentage |
|---|---|---|---|
| A | 6175 | 306 | 4.955466% |
| B | 6175 | 179 | 2.898785% |
| C | 6175 | 5873 | 95.109312% |
| D | 6174 | 5209 | 84.369938% |
Noise dominated data is calculated using 1-second bins in cleaned event files. If a bin has >2000 counts, and if more than 50% of those come from <1% of pixels, then it is considered to be noise-dominated and hence unusable.
| Quadrant | # 1 sec bins | Bins with >0 counts | Bins with >2000 counts | High rate bins dominated by noise | Noise dominated (total time) | Noise dominated (detector-on time) | Marked lightcurve |
|---|---|---|---|---|---|---|---|
| A | 7335 | 6176 | 76 | 76 | 1.04% | 1.23% | 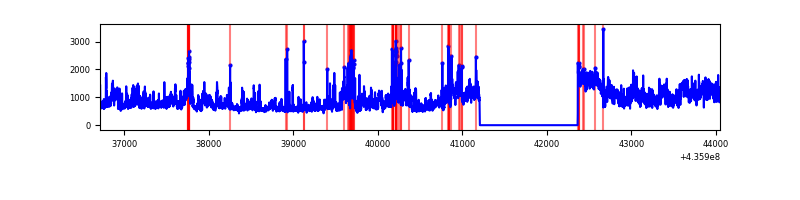 |
| B | 7335 | 6176 | 82 | 82 | 1.12% | 1.33% | 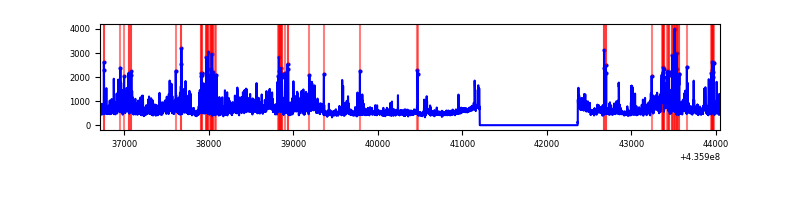 |
| C | 7335 | 6175 | 5604 | 5604 | 76.40% | 90.75% | 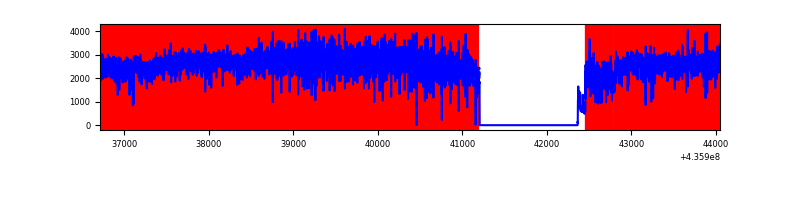 |
| D | 7334 | 6175 | 4708 | 4708 | 64.19% | 76.24% | 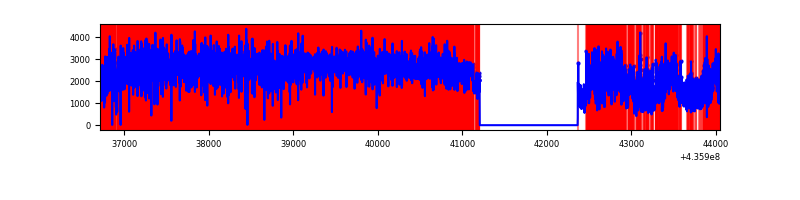 |
Top three noisy pixels from each quadrant. If the there are fewer than three noisy pixels in the level2.evt file, extra rows are filled as -1
| Pixel properties | Quadrant properties | ||||||
|---|---|---|---|---|---|---|---|
| Quadrant | DetID | PixID | Counts | Sigma | Mean | Median | Sigma |
| A | 15 | 222 | 1699042 | 11783.82 | 708 | 692 | 144.1 |
| A | 10 | 83 | 865355 | 5999.37 | 708 | 692 | 144.1 |
| A | 15 | 223 | 349094 | 2417.35 | 708 | 692 | 144.1 |
| B | 4 | 206 | 345308 | 2600.83 | 705 | 687 | 132.5 |
| B | 0 | 230 | 268535 | 2021.43 | 705 | 687 | 132.5 |
| B | 10 | 128 | 256015 | 1926.94 | 705 | 687 | 132.5 |
| C | 15 | 142 | 13706727 | 216286.42 | 271 | 272 | 63.4 |
| C | 15 | 158 | 459393 | 7244.88 | 271 | 272 | 63.4 |
| C | 15 | 157 | 353969 | 5581.3 | 271 | 272 | 63.4 |
| D | 8 | 192 | 9560933 | 117669.29 | 298 | 288 | 81.3 |
| D | 7 | 80 | 1344563 | 16544.9 | 298 | 288 | 81.3 |
| D | 12 | 6 | 614992 | 7565.58 | 298 | 288 | 81.3 |
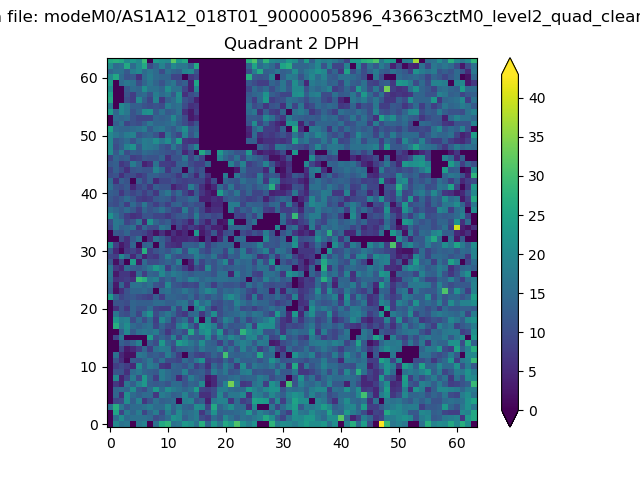
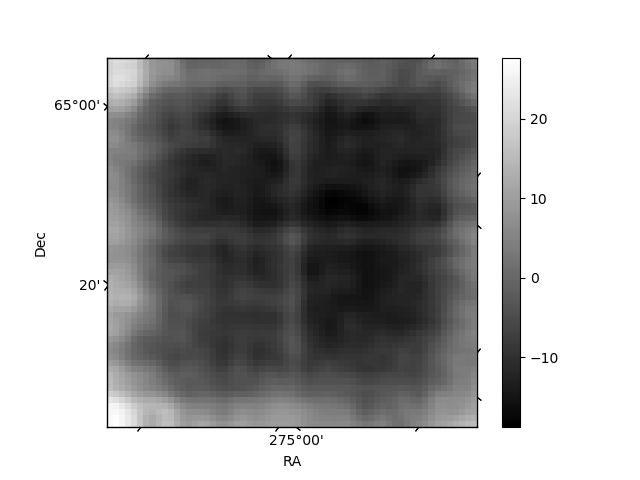
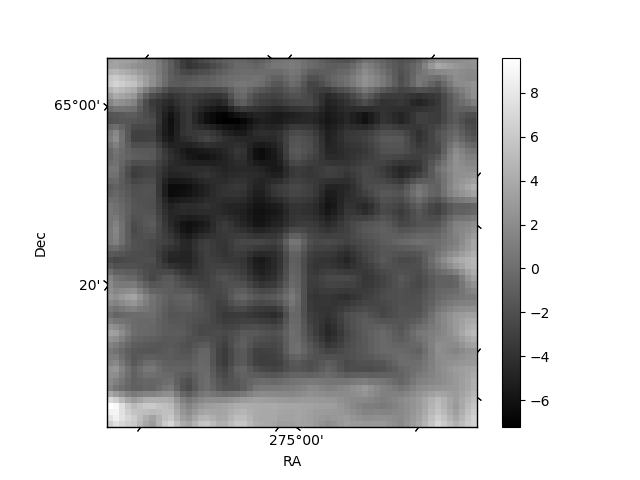
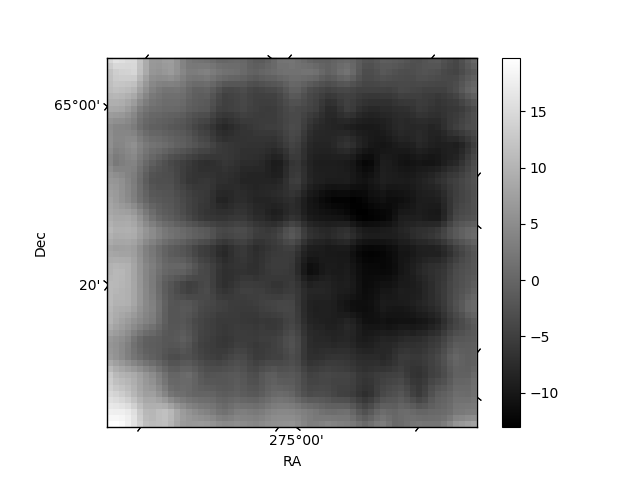
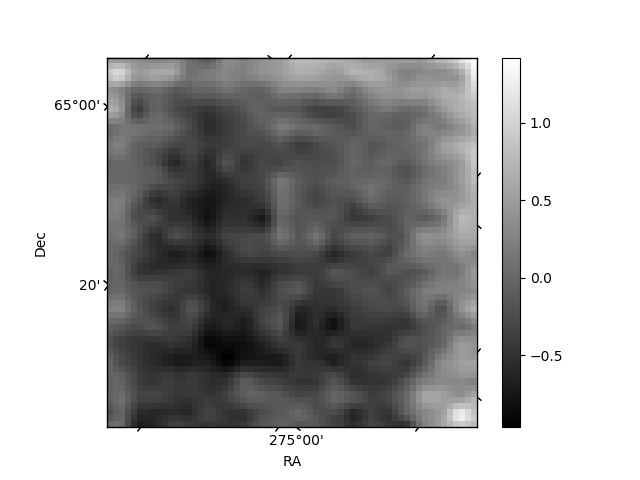
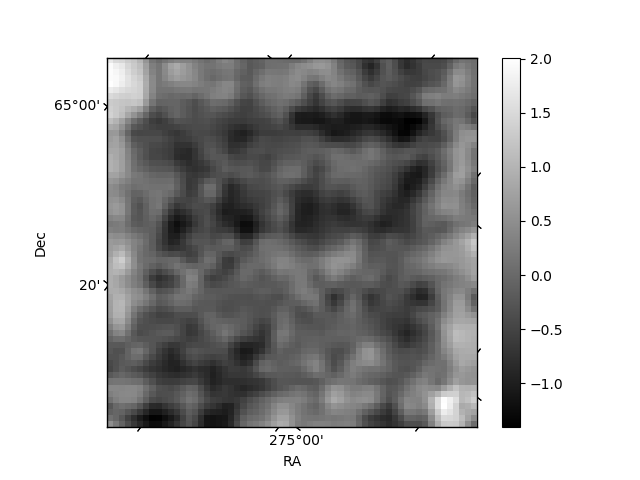
Histogram calculated using DETX and DETY for each event in the final _common_clean file
| Quadrant A | 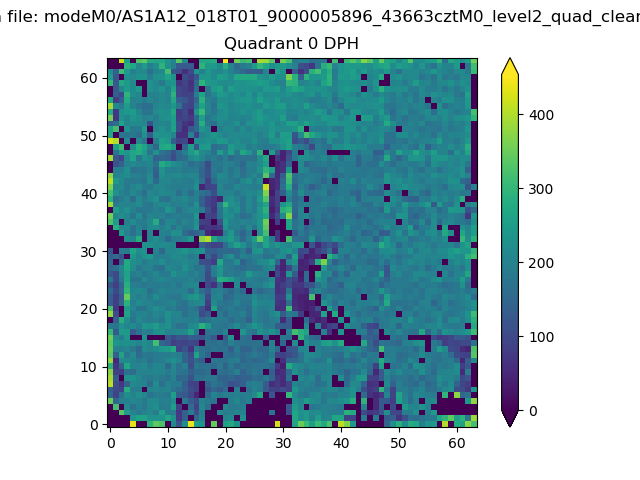 |
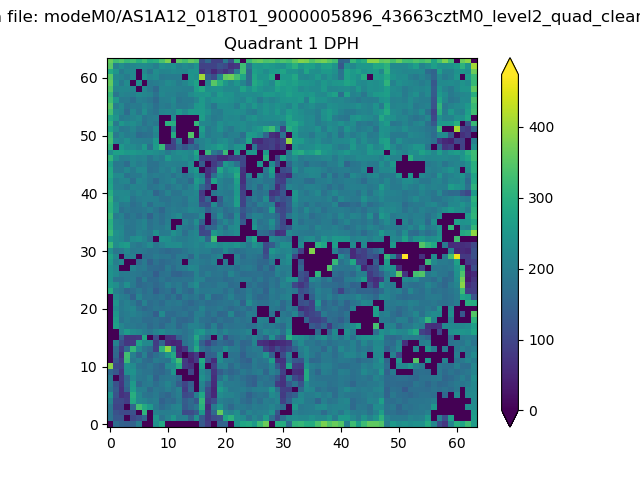 |
Quadrant B |
|---|---|---|---|
| Quadrant D | 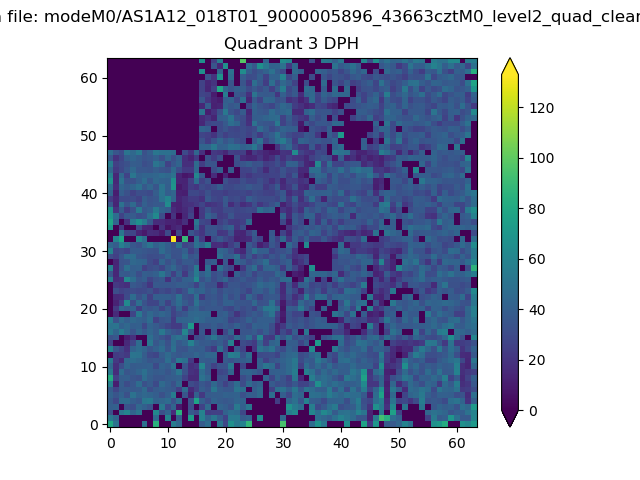 |
 |
Quadrant C |
| Plot type | Count rate plots | Images |
|---|---|---|
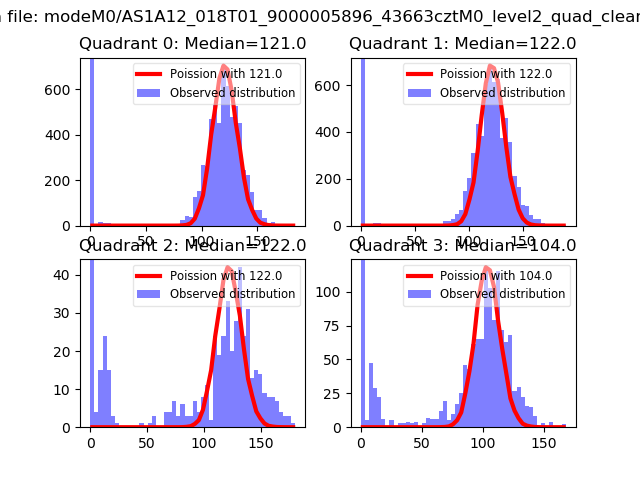
| Comparison with Poisson distribution Blue bars denote a histogram of data divided into 1 sec bins. Red curve is a Poisson curve with rate = median count rate of data. |
 |
 |
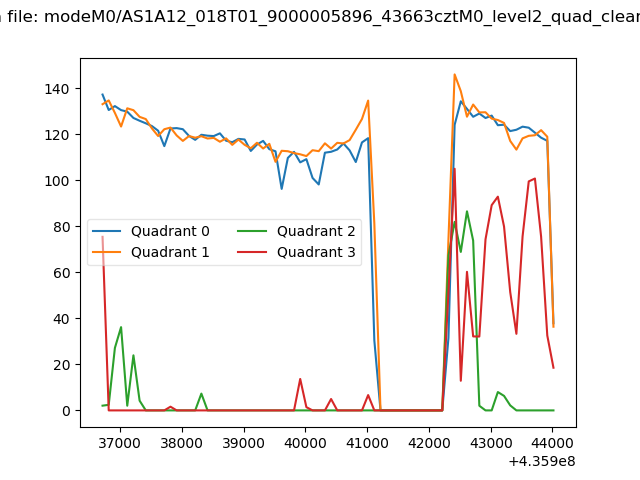
| Quadrant-wise count rates Data is divided into 100 sec bins |
 |
|
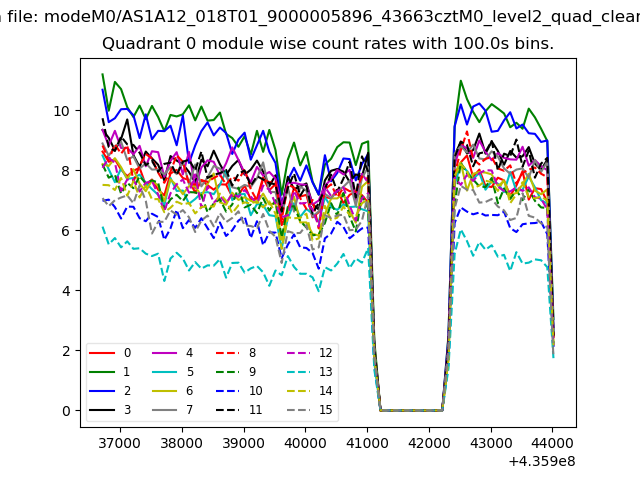
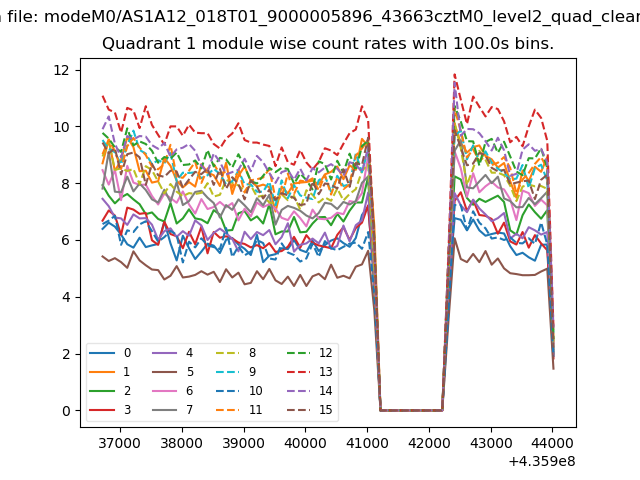
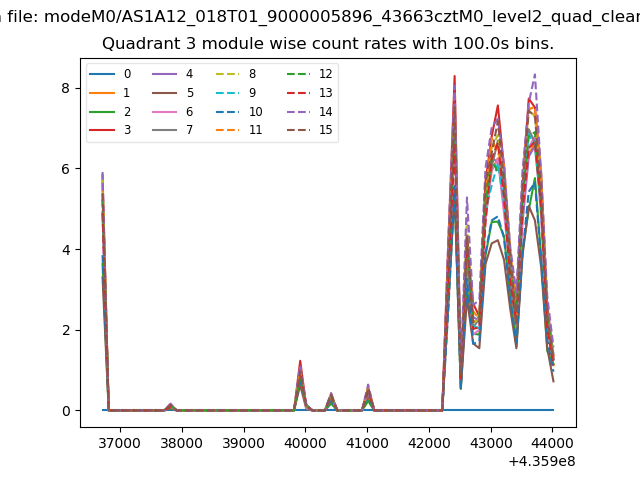
| Module-wise count rates for Quadrant A Data is divided into 100 sec bins |
 |
 |
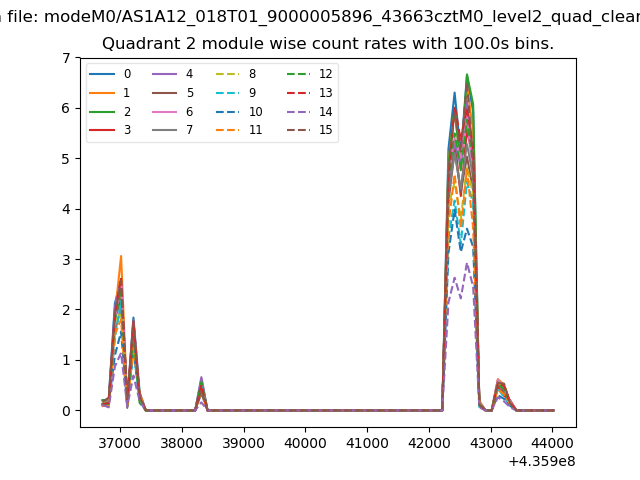
| Module-wise count rates for Quadrant B Data is divided into 100 sec bins |
 |
 |
| Module-wise count rates for Quadrant C Data is divided into 100 sec bins |
 |
 |
| Module-wise count rates for Quadrant D Data is divided into 100 sec bins |
 |
 |
| Parameter | Plot |
|---|---|
| CZT HV Monitor | 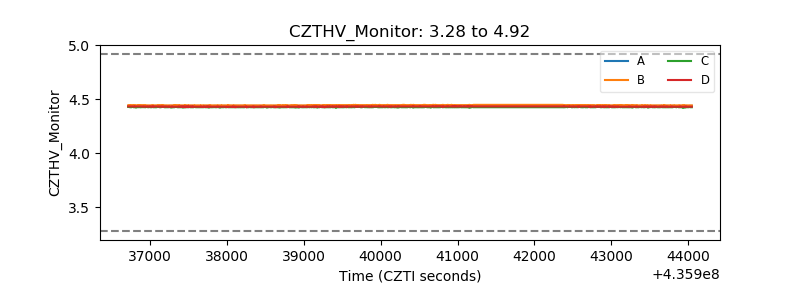 |
| D_VDD | 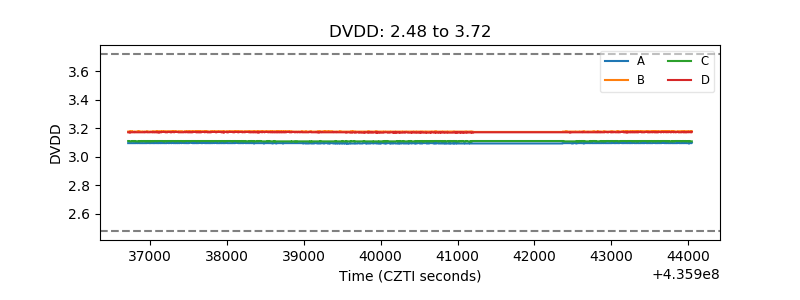 |
| Temperature 1 | 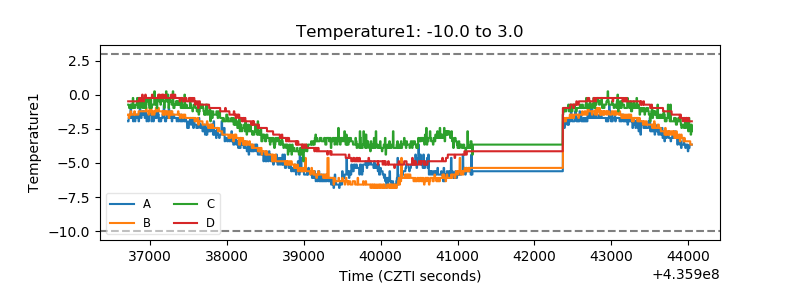 |
| Veto HV Monitor | 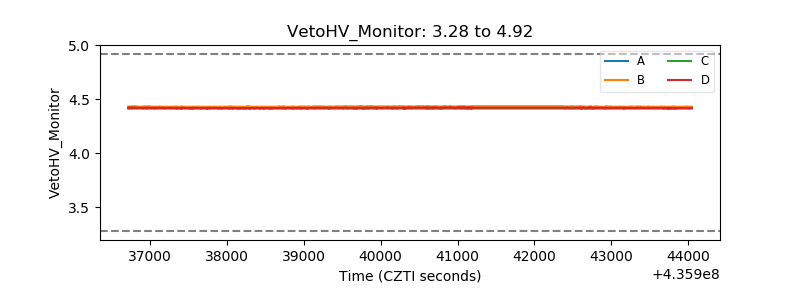 |
| Veto LLD | 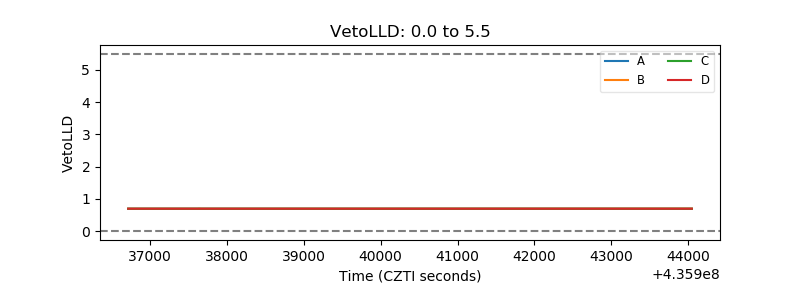 |
| Alpha Counter | 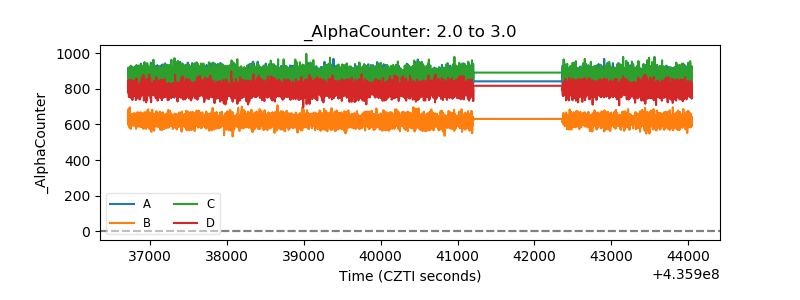 |
| _CPM_Rate | 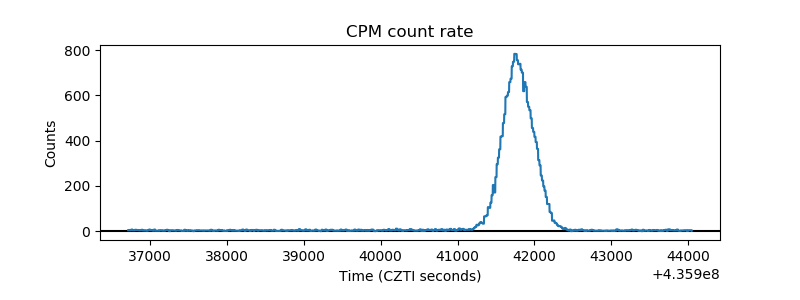 |
| CZT Counter | 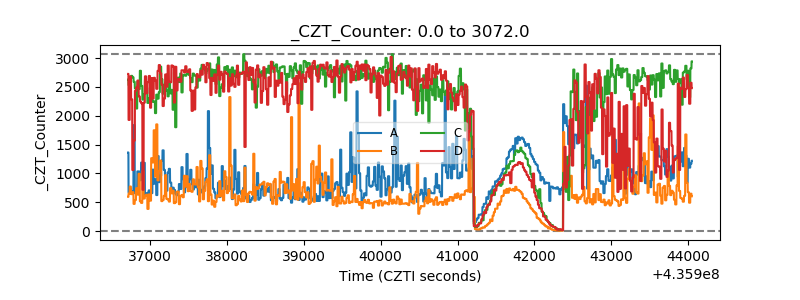 |
| +2.5 Volts monitor |  |
| +5 Volts monitor | 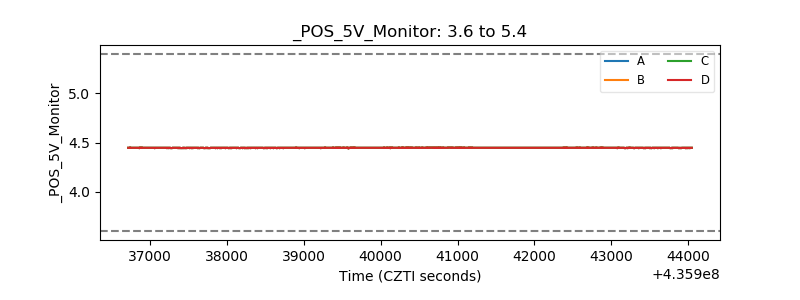 |
| _ROLL_ROT | 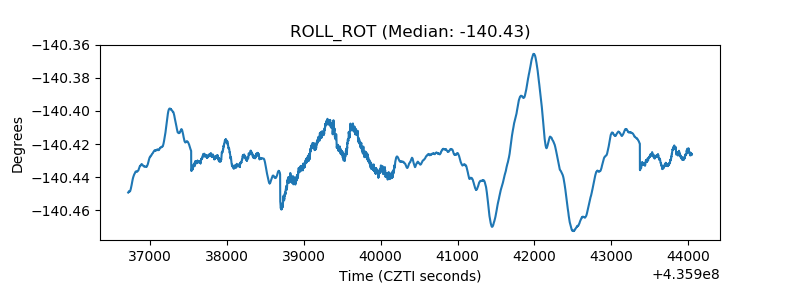 |
| _Roll_DEC | 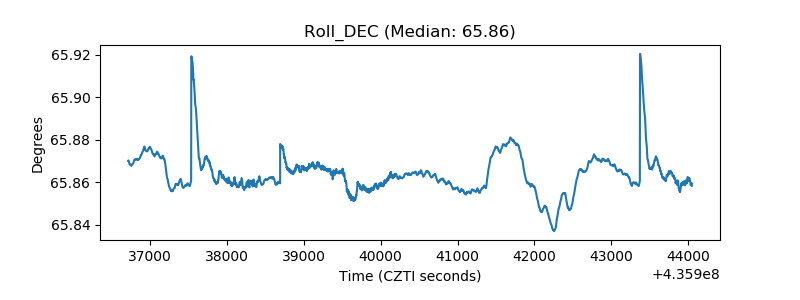 |
| _Roll_RA | 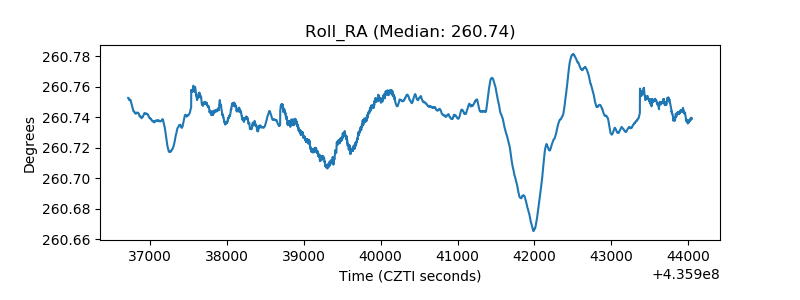 |
| Veto Counter | 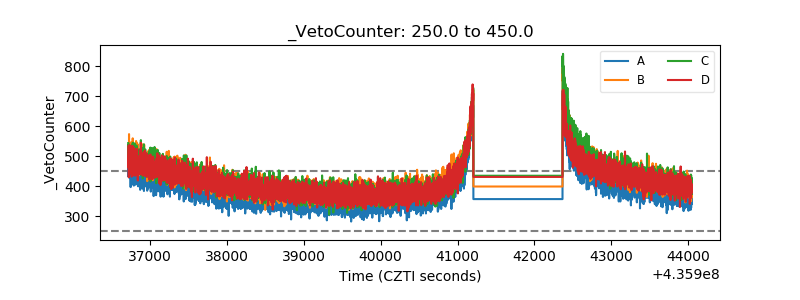 |