| Param | Original file | Final file |
|---|---|---|
| Filename | modeM0/AS1A12_018T01_9000005896_43664cztM0_level2.fits | modeM0/AS1A12_018T01_9000005896_43664cztM0_level2_quad_clean.evt |
| Size (bytes) | 890,392,320 | 84,556,800 |
| Size | 849.1 MB | 80.6 MB |
| Events in quadrant A | 6,568,692 | 656,799 |
| Events in quadrant B | 3,901,622 | 677,007 |
| Events in quadrant C | 13,431,340 | 293,853 |
| Events in quadrant D | 8,612,116 | 525,313 |
| Mode SS | |||
|---|---|---|---|
| Quadrant | BADHDUFLAG | Total packets | Discarded packets |
| A | 0 | 118 | 0 |
| B | 0 | 118 | 0 |
| C | 0 | 118 | 0 |
| D | 0 | 118 | 0 |
| Mode M0 | |||
|---|---|---|---|
| Quadrant | BADHDUFLAG | Total packets | Discarded packets |
| A | 0 | 23651 | 2 |
| B | 0 | 15531 | 3 |
| C | 0 | 43784 | 2 |
| D | 0 | 29625 | 2 |
| Mode M9 | |||
|---|---|---|---|
| Quadrant | BADHDUFLAG | Total packets | Discarded packets |
| A | 0 | 10 | 0 |
| B | 0 | 10 | 0 |
| C | 0 | 10 | 0 |
| D | 0 | 10 | 0 |
| Quadrant | Total seconds | Saturated seconds | Saturation percentage |
|---|---|---|---|
| A | 5779 | 505 | 8.738536% |
| B | 5779 | 213 | 3.685759% |
| C | 5779 | 4646 | 80.394532% |
| D | 5779 | 1699 | 29.399550% |
Noise dominated data is calculated using 1-second bins in cleaned event files. If a bin has >2000 counts, and if more than 50% of those come from <1% of pixels, then it is considered to be noise-dominated and hence unusable.
| Quadrant | # 1 sec bins | Bins with >0 counts | Bins with >2000 counts | High rate bins dominated by noise | Noise dominated (total time) | Noise dominated (detector-on time) | Marked lightcurve |
|---|---|---|---|---|---|---|---|
| A | 6769 | 5781 | 191 | 191 | 2.82% | 3.30% | 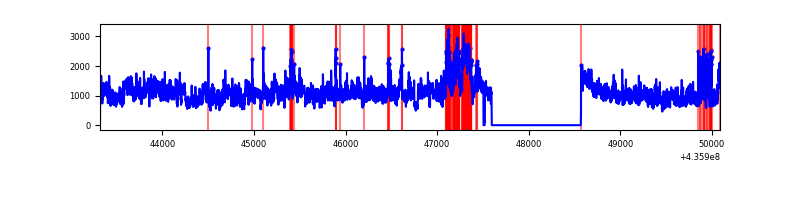 |
| B | 6769 | 5781 | 88 | 88 | 1.30% | 1.52% | 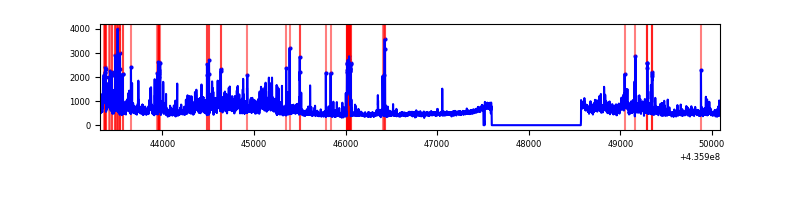 |
| C | 6769 | 5781 | 4392 | 4392 | 64.88% | 75.97% | 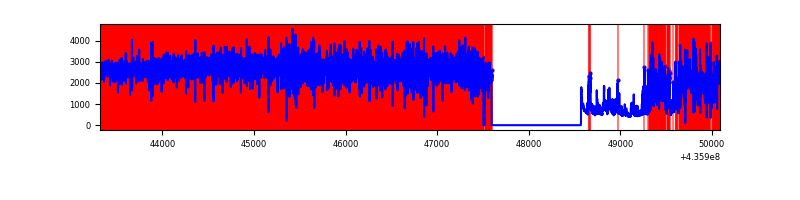 |
| D | 6769 | 5781 | 1579 | 1579 | 23.33% | 27.31% | 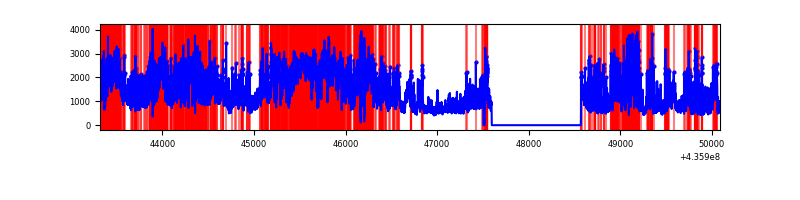 |
Top three noisy pixels from each quadrant. If the there are fewer than three noisy pixels in the level2.evt file, extra rows are filled as -1
| Pixel properties | Quadrant properties | ||||||
|---|---|---|---|---|---|---|---|
| Quadrant | DetID | PixID | Counts | Sigma | Mean | Median | Sigma |
| A | 15 | 222 | 2521601 | 19292.89 | 636 | 623 | 130.7 |
| A | 10 | 83 | 771544 | 5899.81 | 636 | 623 | 130.7 |
| A | 15 | 223 | 652384 | 4987.89 | 636 | 623 | 130.7 |
| B | 4 | 206 | 518258 | 4185.78 | 649 | 630 | 123.7 |
| B | 12 | 32 | 202663 | 1633.73 | 649 | 630 | 123.7 |
| B | 0 | 230 | 172758 | 1391.91 | 649 | 630 | 123.7 |
| C | 15 | 142 | 10914576 | 152058.11 | 305 | 306 | 71.8 |
| C | 15 | 158 | 858909 | 11962.1 | 305 | 306 | 71.8 |
| C | 15 | 157 | 162034 | 2253.2 | 305 | 306 | 71.8 |
| D | 7 | 80 | 1973703 | 12890.75 | 576 | 561 | 153.1 |
| D | 12 | 6 | 790845 | 5163.01 | 576 | 561 | 153.1 |
| D | 1 | 52 | 579516 | 3782.38 | 576 | 561 | 153.1 |
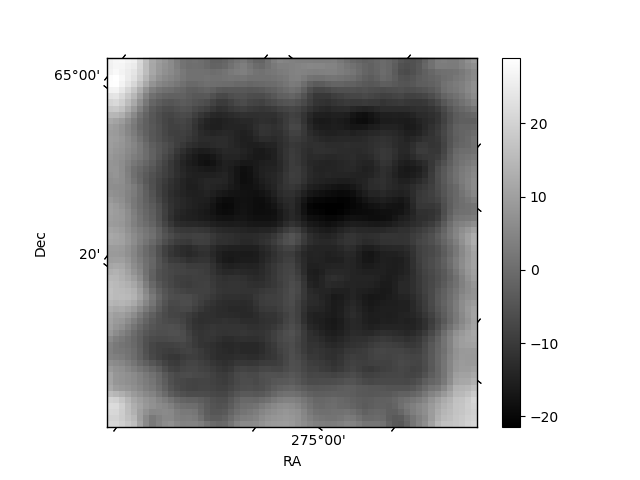
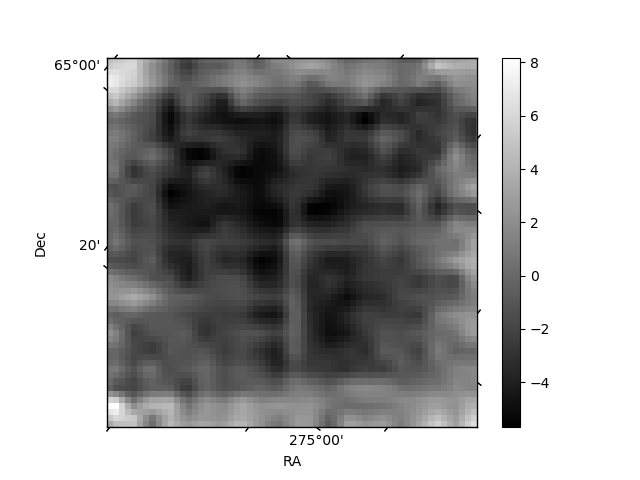
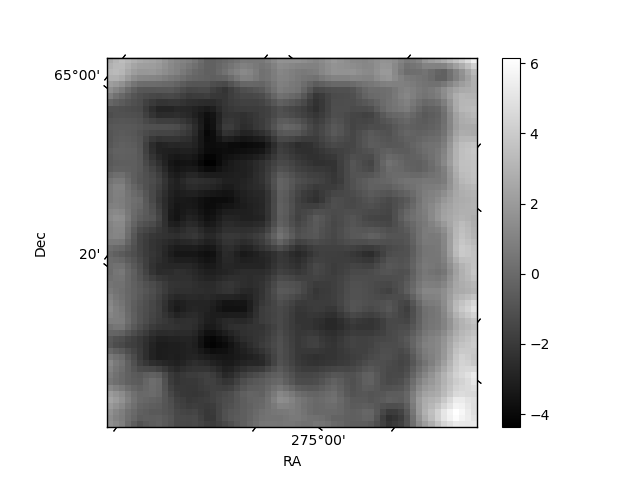
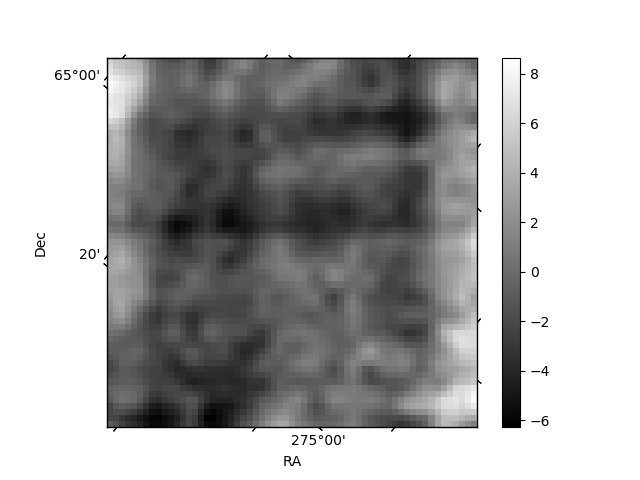
Histogram calculated using DETX and DETY for each event in the final _common_clean file
| Quadrant A | 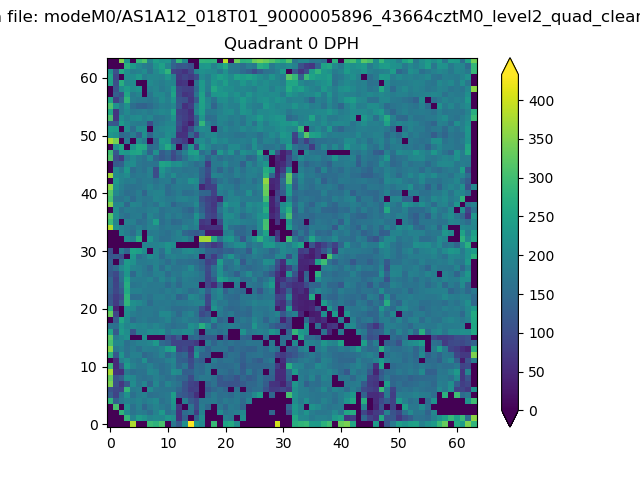 |
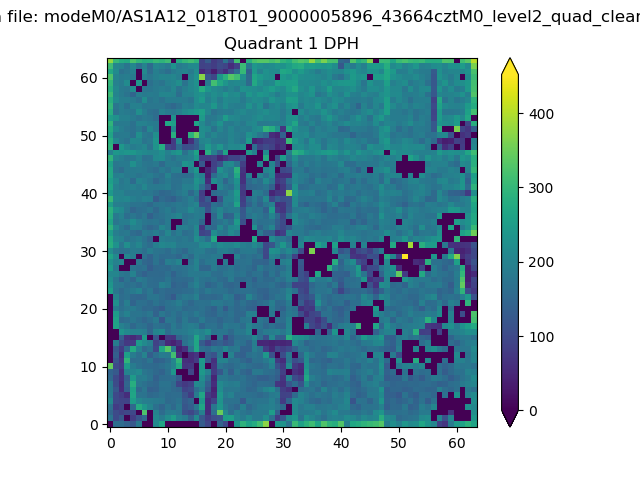 |
Quadrant B |
|---|---|---|---|
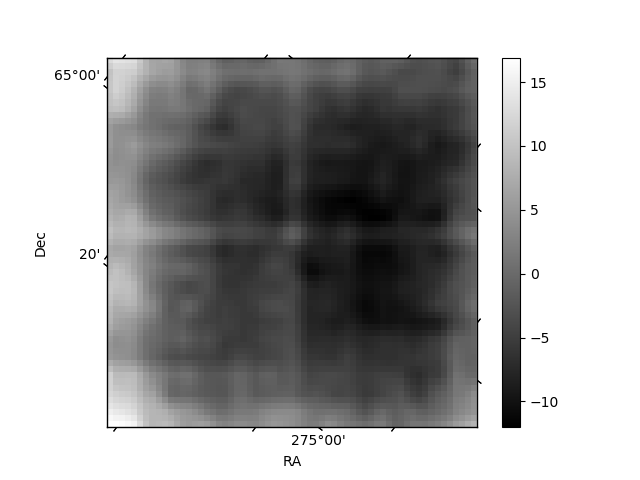
| Quadrant D | 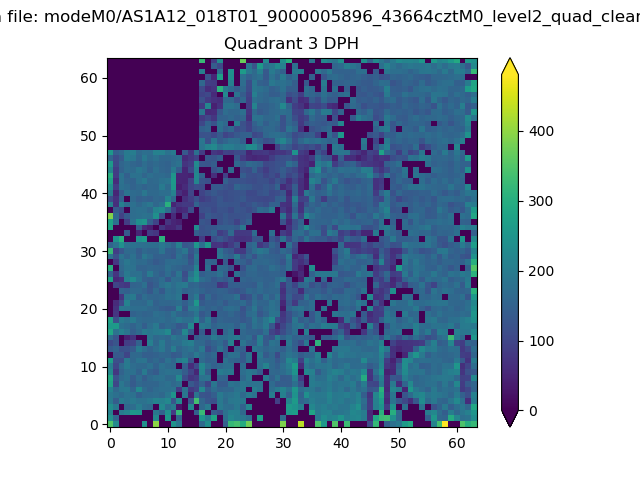 |
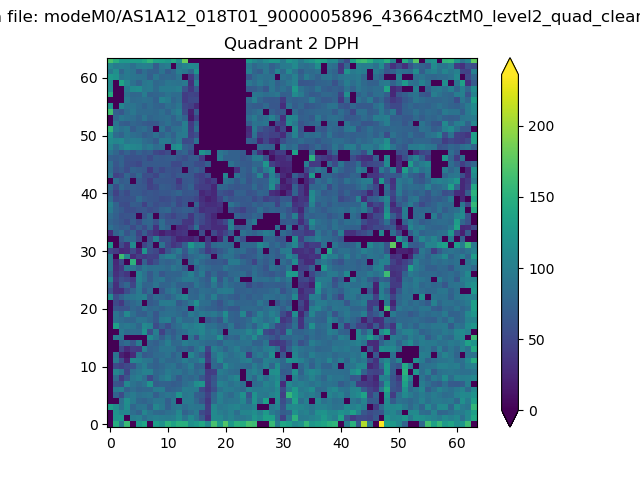 |
Quadrant C |
| Plot type | Count rate plots | Images |
|---|---|---|
| Comparison with Poisson distribution Blue bars denote a histogram of data divided into 1 sec bins. Red curve is a Poisson curve with rate = median count rate of data. |
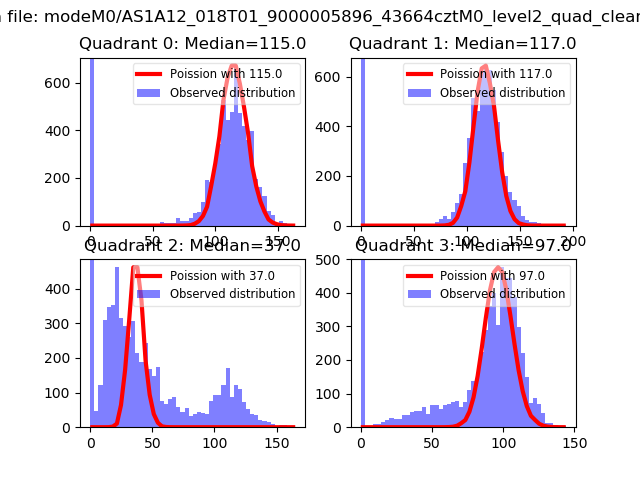 |
 |
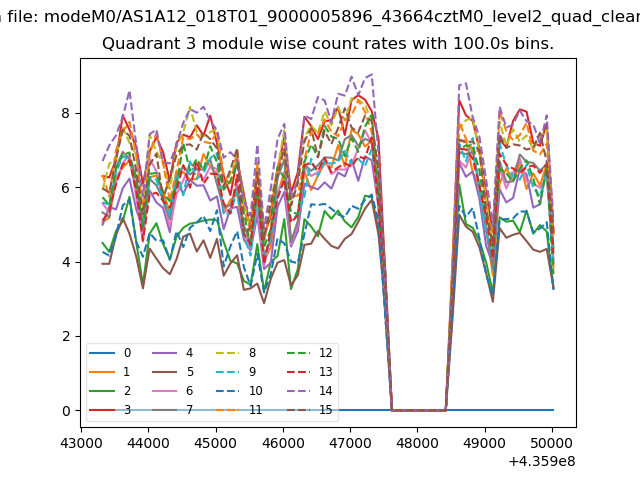
| Quadrant-wise count rates Data is divided into 100 sec bins |
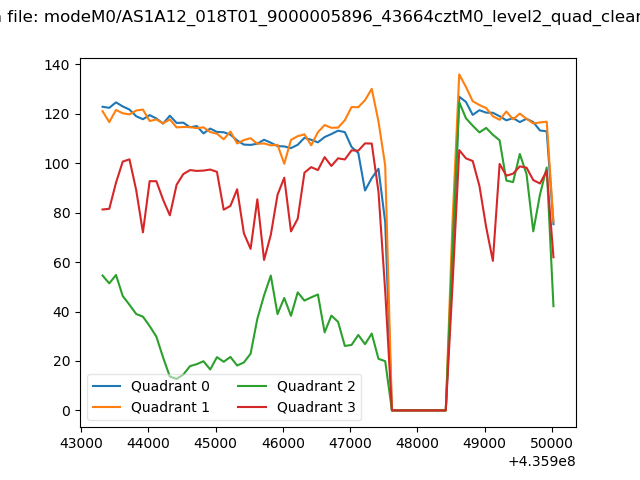 |
|
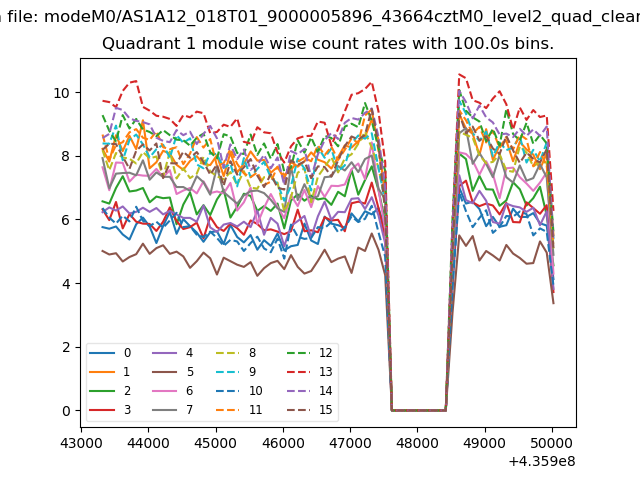
| Module-wise count rates for Quadrant A Data is divided into 100 sec bins |
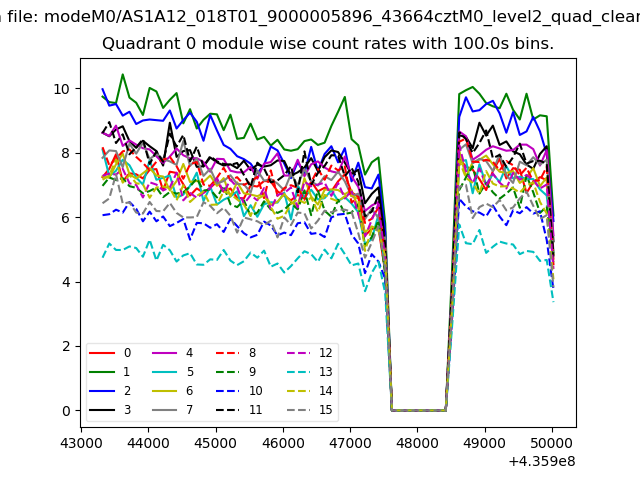 |
 |
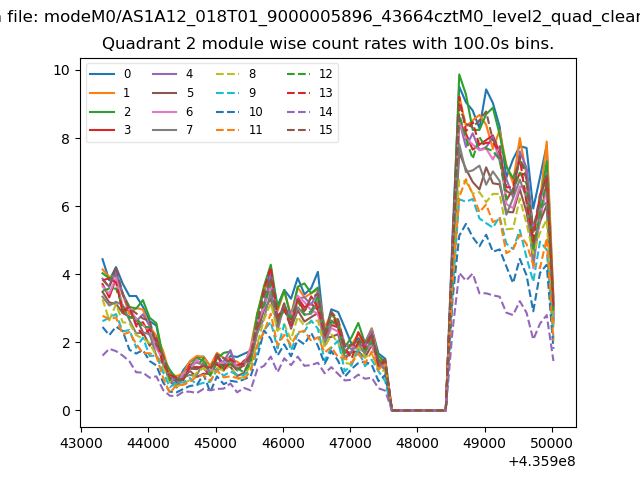
| Module-wise count rates for Quadrant B Data is divided into 100 sec bins |
 |
 |
| Module-wise count rates for Quadrant C Data is divided into 100 sec bins |
 |
 |
| Module-wise count rates for Quadrant D Data is divided into 100 sec bins |
 |
 |
| Parameter | Plot |
|---|---|
| CZT HV Monitor | 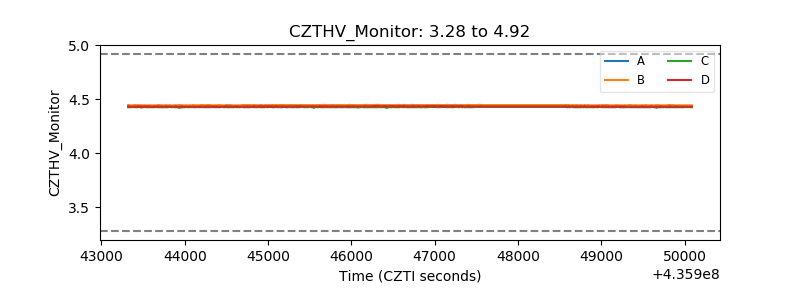 |
| D_VDD | 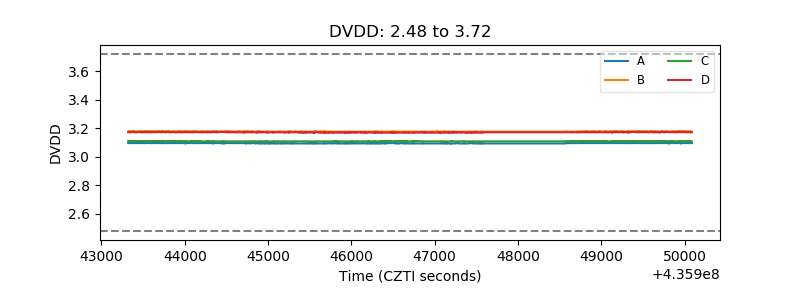 |
| Temperature 1 | 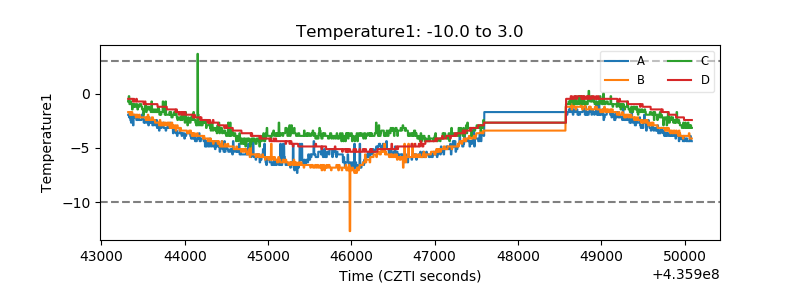 |
| Veto HV Monitor | 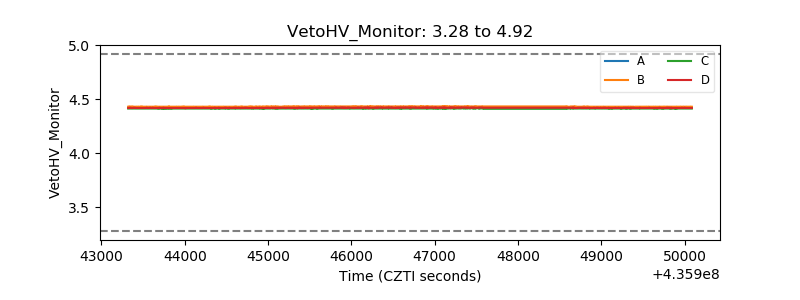 |
| Veto LLD | 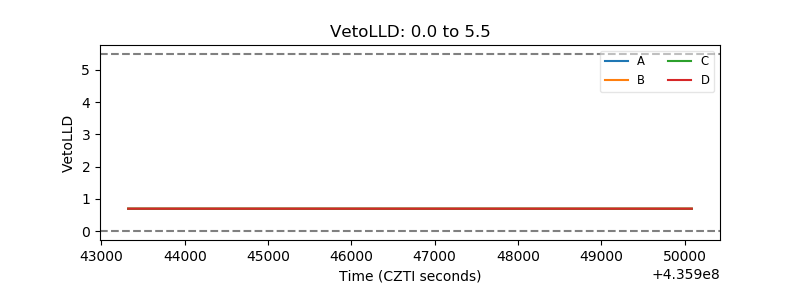 |
| Alpha Counter | 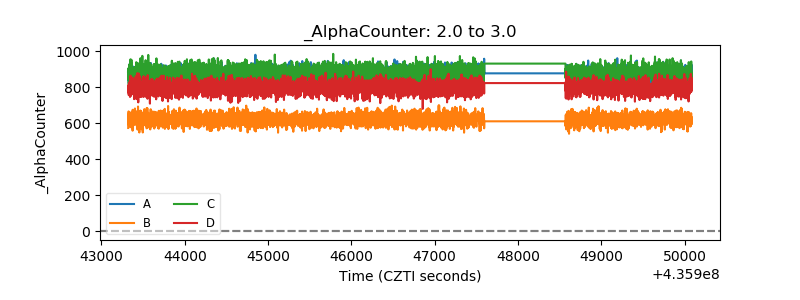 |
| _CPM_Rate | 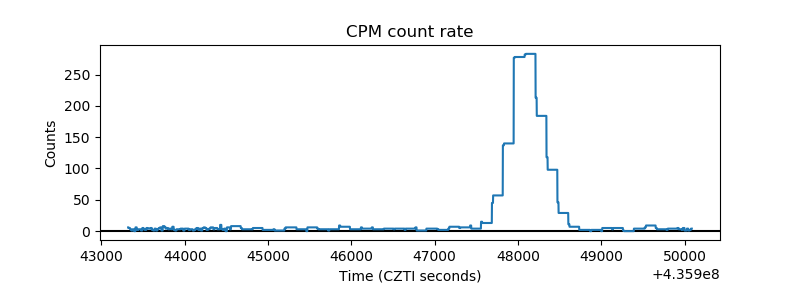 |
| CZT Counter | 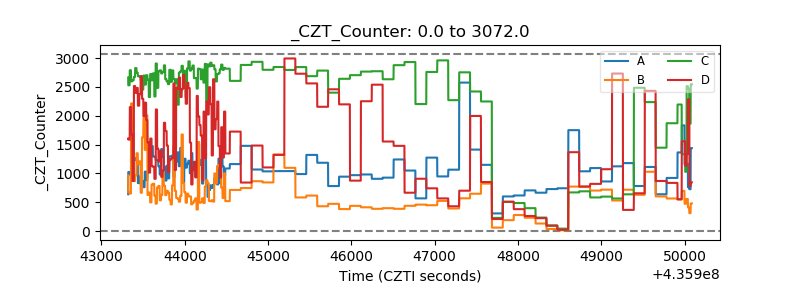 |
| +2.5 Volts monitor | 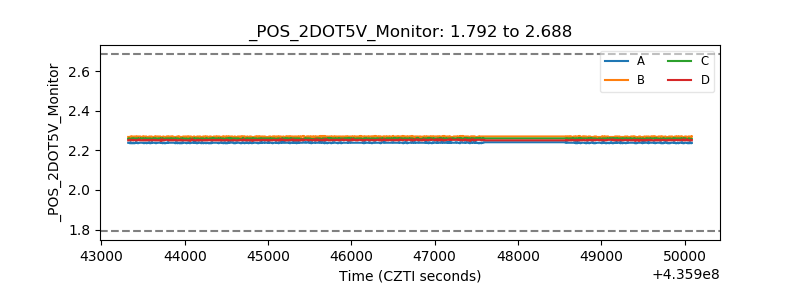 |
| +5 Volts monitor | 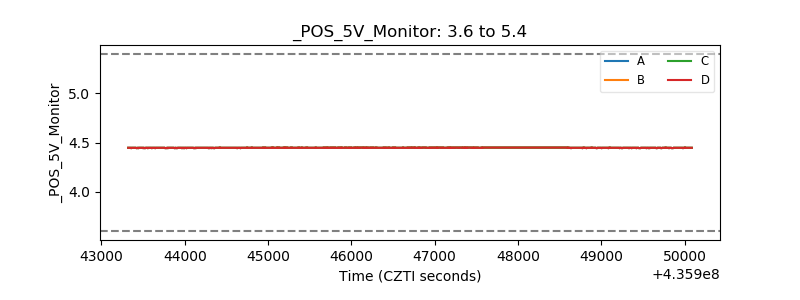 |
| _ROLL_ROT | 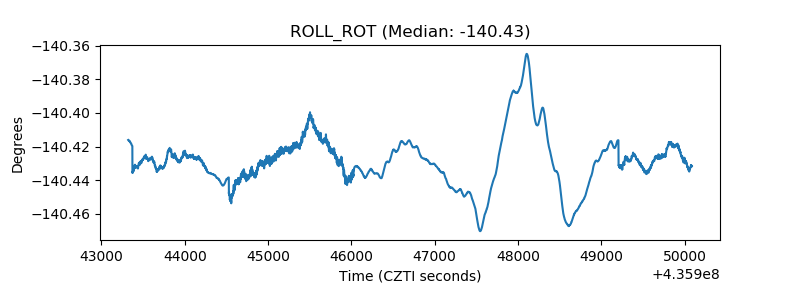 |
| _Roll_DEC | 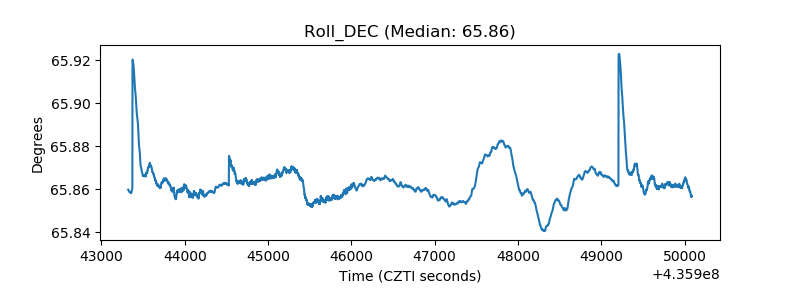 |
| _Roll_RA | 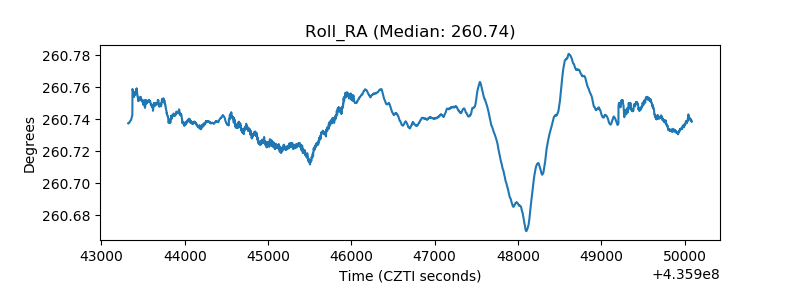 |
| Veto Counter | 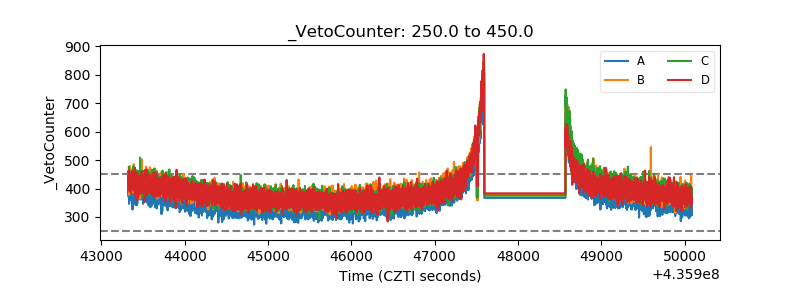 |