| Param | Original file | Final file |
|---|---|---|
| Filename | modeM0/AS1A12_018T01_9000005896_43665cztM0_level2.fits | modeM0/AS1A12_018T01_9000005896_43665cztM0_level2_quad_clean.evt |
| Size (bytes) | 951,482,880 | 97,395,840 |
| Size | 907.4 MB | 92.9 MB |
| Events in quadrant A | 8,350,851 | 746,285 |
| Events in quadrant B | 3,712,842 | 761,341 |
| Events in quadrant C | 14,587,965 | 383,429 |
| Events in quadrant D | 8,054,324 | 589,235 |
| Mode SS | |||
|---|---|---|---|
| Quadrant | BADHDUFLAG | Total packets | Discarded packets |
| A | 0 | 136 | 0 |
| B | 0 | 136 | 0 |
| C | 0 | 136 | 0 |
| D | 0 | 136 | 0 |
| Mode M0 | |||
|---|---|---|---|
| Quadrant | BADHDUFLAG | Total packets | Discarded packets |
| A | 0 | 29527 | 1 |
| B | 0 | 15685 | 1 |
| C | 0 | 47799 | 1 |
| D | 0 | 28605 | 3 |
| Mode M9 | |||
|---|---|---|---|
| Quadrant | BADHDUFLAG | Total packets | Discarded packets |
| A | 0 | 8 | 0 |
| B | 0 | 8 | 0 |
| C | 0 | 8 | 0 |
| D | 0 | 8 | 0 |
| Quadrant | Total seconds | Saturated seconds | Saturation percentage |
|---|---|---|---|
| A | 6676 | 329 | 4.928101% |
| B | 6677 | 84 | 1.258050% |
| C | 6677 | 4789 | 71.723828% |
| D | 6676 | 1380 | 20.671061% |
Noise dominated data is calculated using 1-second bins in cleaned event files. If a bin has >2000 counts, and if more than 50% of those come from <1% of pixels, then it is considered to be noise-dominated and hence unusable.
| Quadrant | # 1 sec bins | Bins with >0 counts | Bins with >2000 counts | High rate bins dominated by noise | Noise dominated (total time) | Noise dominated (detector-on time) | Marked lightcurve |
|---|---|---|---|---|---|---|---|
| A | 7471 | 6678 | 107 | 107 | 1.43% | 1.60% | 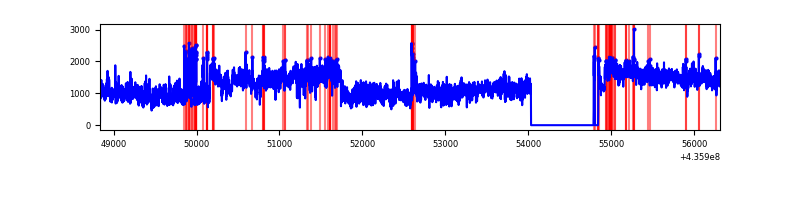 |
| B | 7472 | 6679 | 18 | 18 | 0.24% | 0.27% | 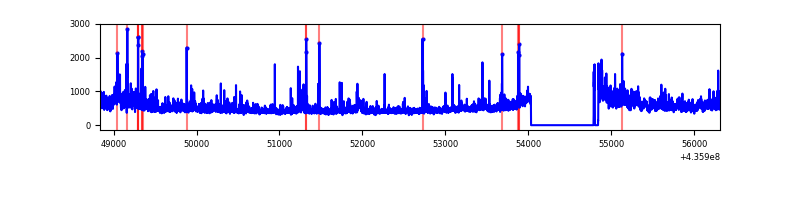 |
| C | 7472 | 6679 | 4390 | 4390 | 58.75% | 65.73% | 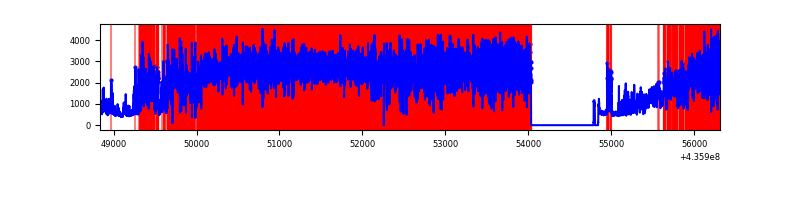 |
| D | 7471 | 6678 | 1124 | 1124 | 15.04% | 16.83% | 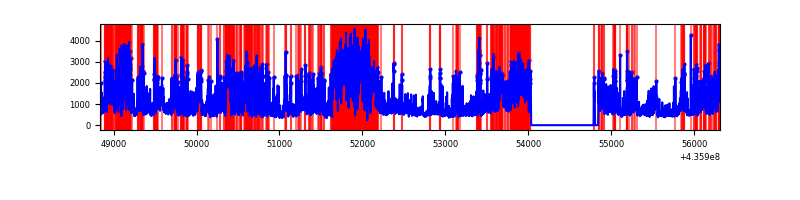 |
Top three noisy pixels from each quadrant. If the there are fewer than three noisy pixels in the level2.evt file, extra rows are filled as -1
| Pixel properties | Quadrant properties | ||||||
|---|---|---|---|---|---|---|---|
| Quadrant | DetID | PixID | Counts | Sigma | Mean | Median | Sigma |
| A | 15 | 222 | 4063634 | 27183.45 | 730 | 715 | 149.5 |
| A | 10 | 83 | 910387 | 6086.27 | 730 | 715 | 149.5 |
| A | 15 | 223 | 180729 | 1204.41 | 730 | 715 | 149.5 |
| B | 4 | 206 | 213289 | 1495.84 | 738 | 716 | 142.1 |
| B | 0 | 230 | 176285 | 1235.45 | 738 | 716 | 142.1 |
| B | 5 | 235 | 143769 | 1006.64 | 738 | 716 | 142.1 |
| C | 15 | 142 | 11228606 | 119000.13 | 400 | 403 | 94.4 |
| C | 15 | 158 | 1120708 | 11873.35 | 400 | 403 | 94.4 |
| C | 15 | 126 | 242106 | 2561.65 | 400 | 403 | 94.4 |
| D | 7 | 80 | 1434448 | 8398.21 | 659 | 639 | 170.7 |
| D | 12 | 6 | 941337 | 5509.92 | 659 | 639 | 170.7 |
| D | 1 | 52 | 477793 | 2794.82 | 659 | 639 | 170.7 |
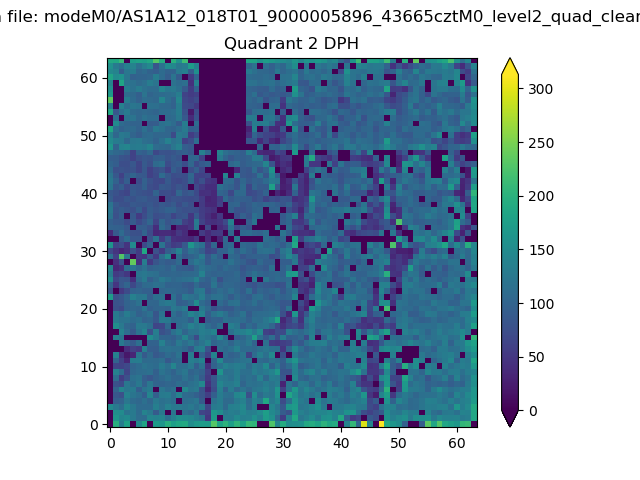
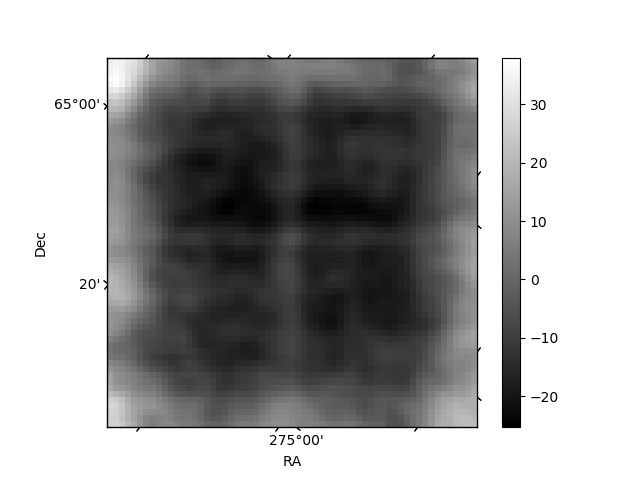
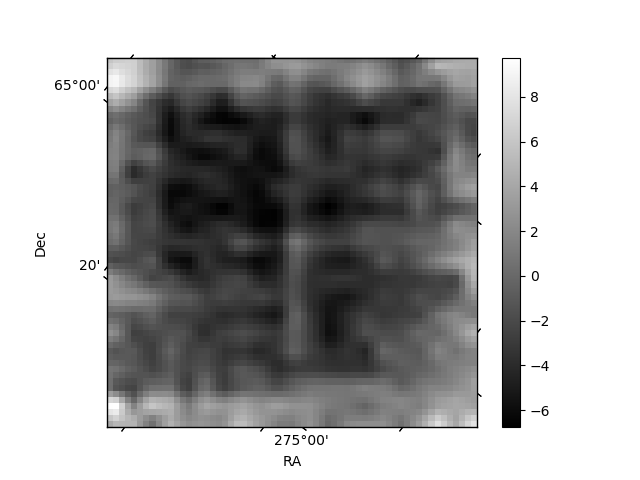
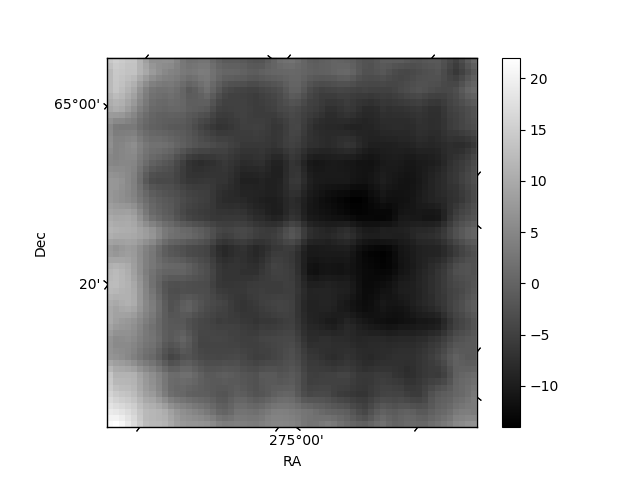
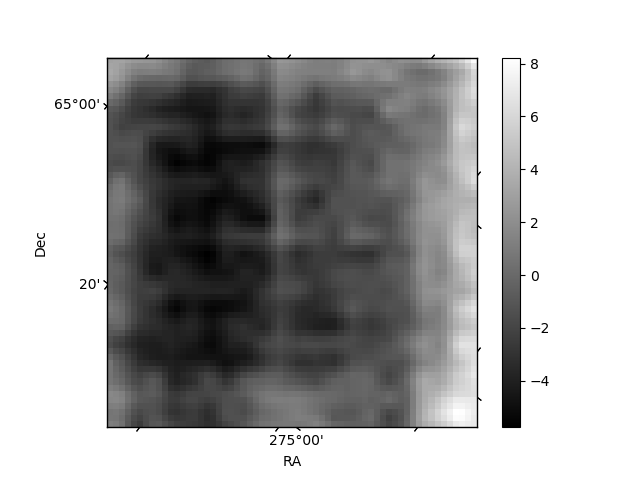
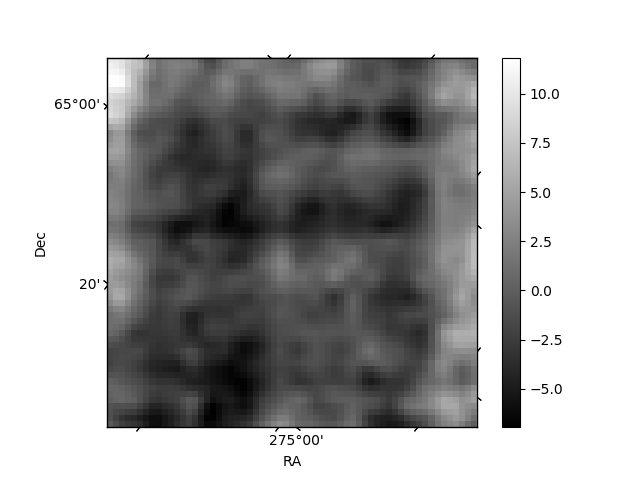
Histogram calculated using DETX and DETY for each event in the final _common_clean file
| Quadrant A | 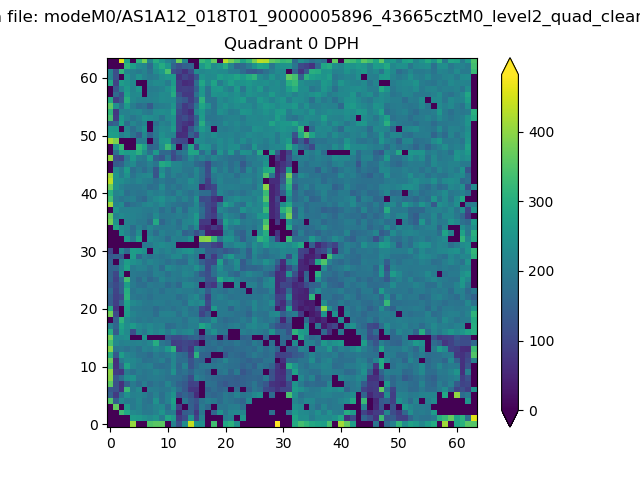 |
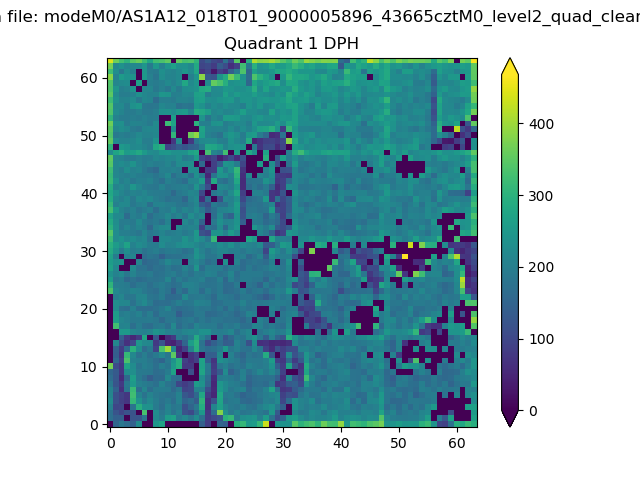 |
Quadrant B |
|---|---|---|---|
| Quadrant D | 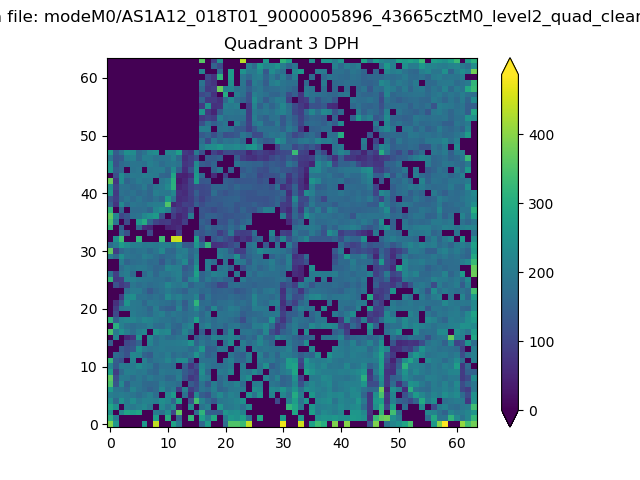 |
 |
Quadrant C |
| Plot type | Count rate plots | Images |
|---|---|---|
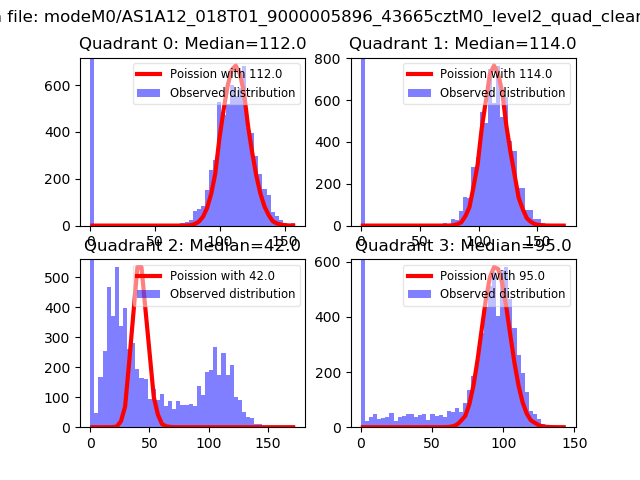
| Comparison with Poisson distribution Blue bars denote a histogram of data divided into 1 sec bins. Red curve is a Poisson curve with rate = median count rate of data. |
 |
 |
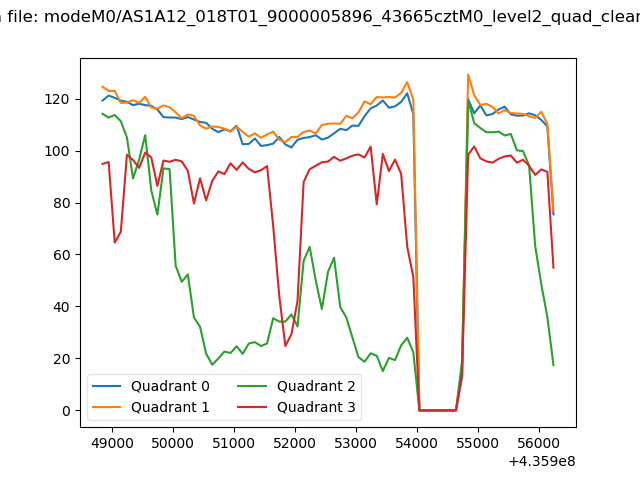
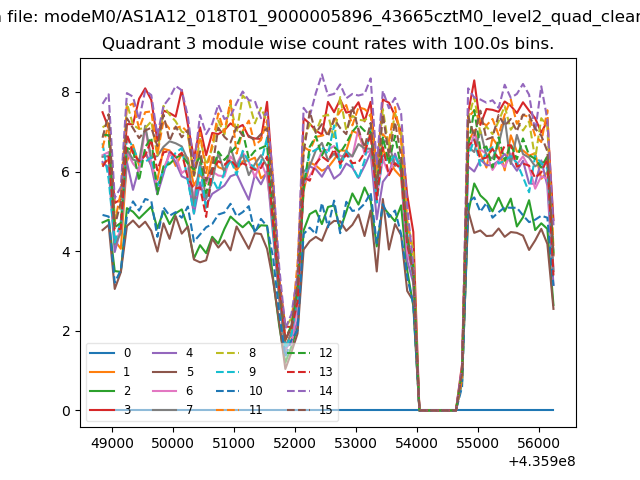
| Quadrant-wise count rates Data is divided into 100 sec bins |
 |
|
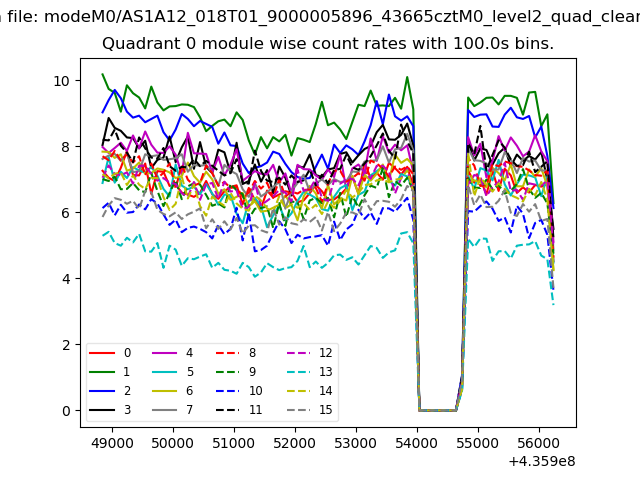
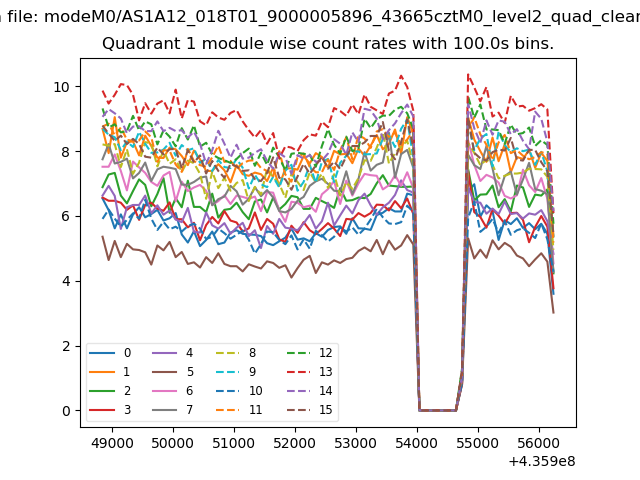
| Module-wise count rates for Quadrant A Data is divided into 100 sec bins |
 |
 |
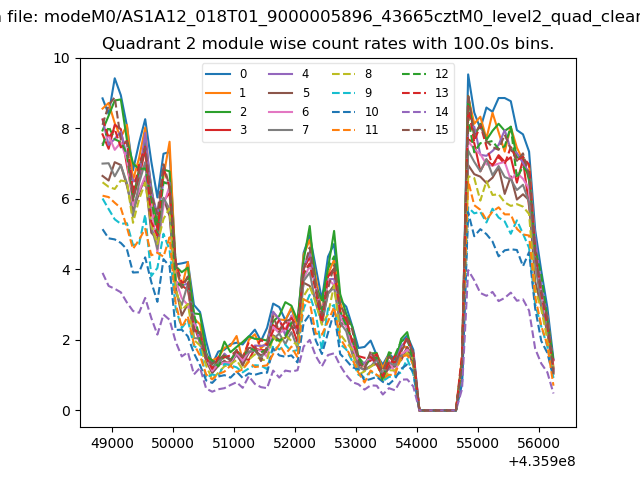
| Module-wise count rates for Quadrant B Data is divided into 100 sec bins |
 |
 |
| Module-wise count rates for Quadrant C Data is divided into 100 sec bins |
 |
 |
| Module-wise count rates for Quadrant D Data is divided into 100 sec bins |
 |
 |
| Parameter | Plot |
|---|---|
| CZT HV Monitor | 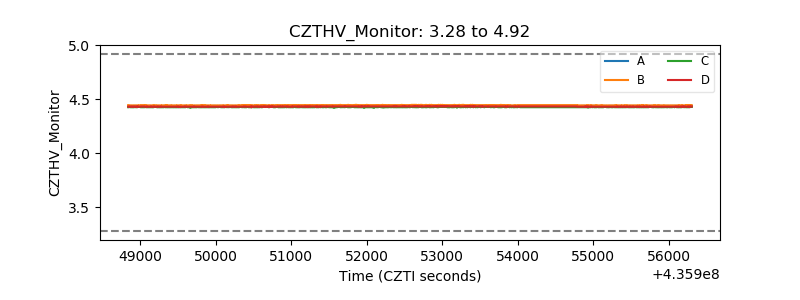 |
| D_VDD | 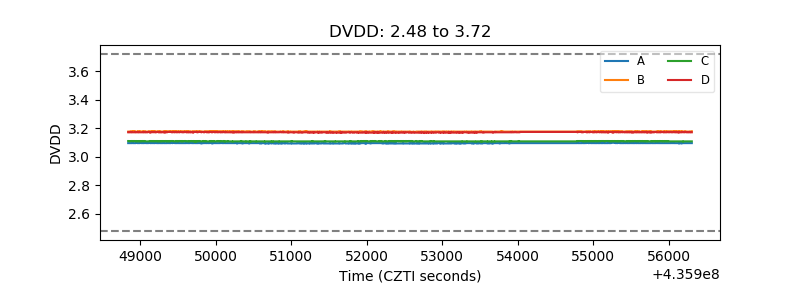 |
| Temperature 1 | 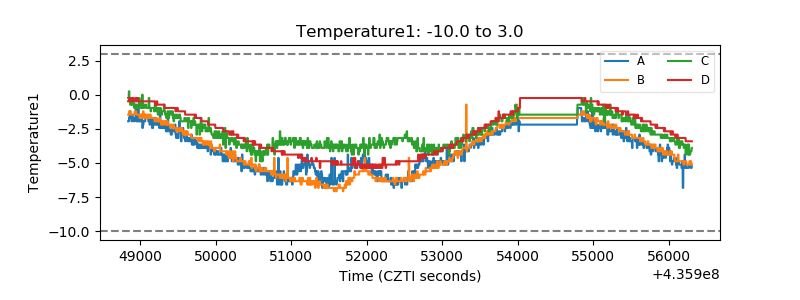 |
| Veto HV Monitor | 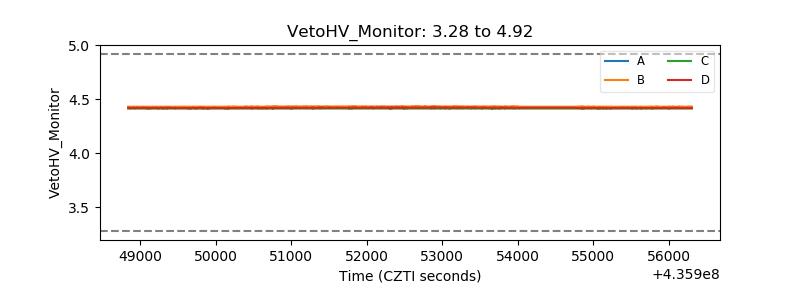 |
| Veto LLD | 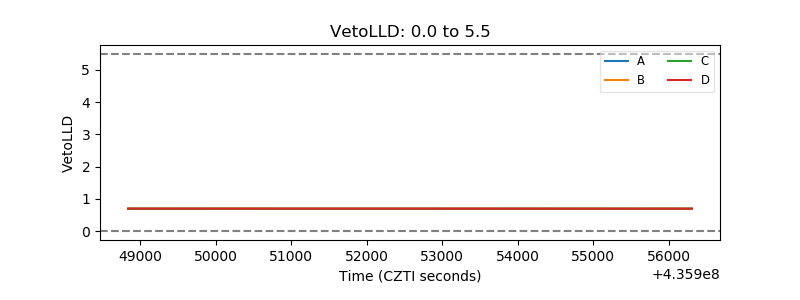 |
| Alpha Counter | 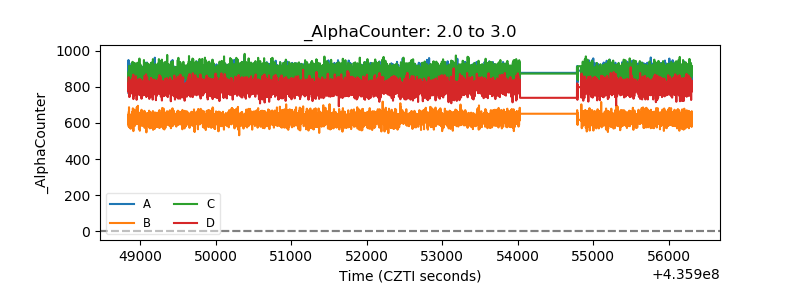 |
| _CPM_Rate | 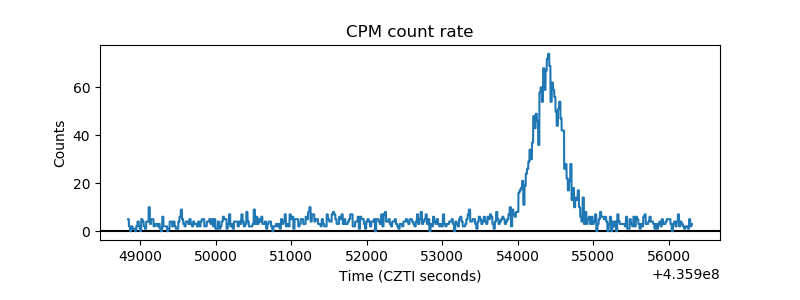 |
| CZT Counter | 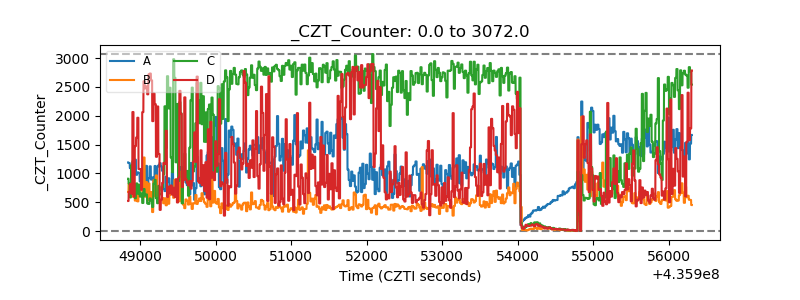 |
| +2.5 Volts monitor | 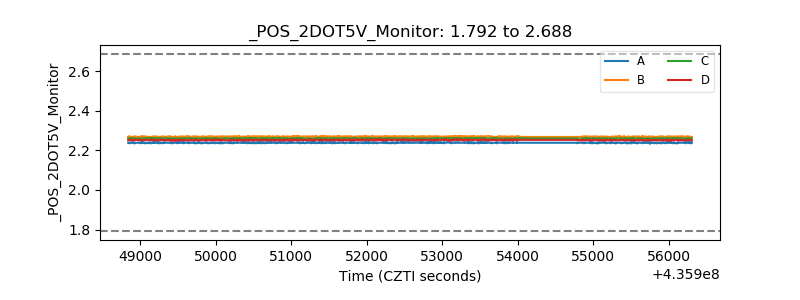 |
| +5 Volts monitor | 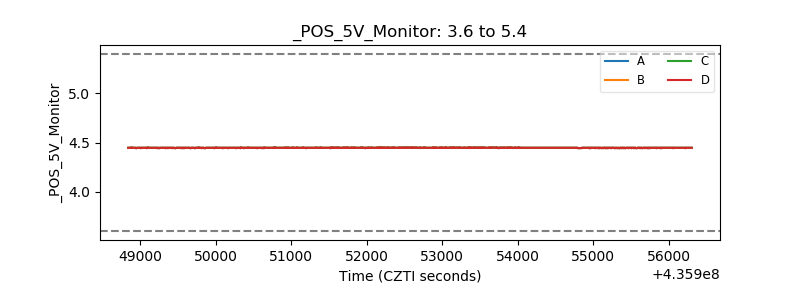 |
| _ROLL_ROT | 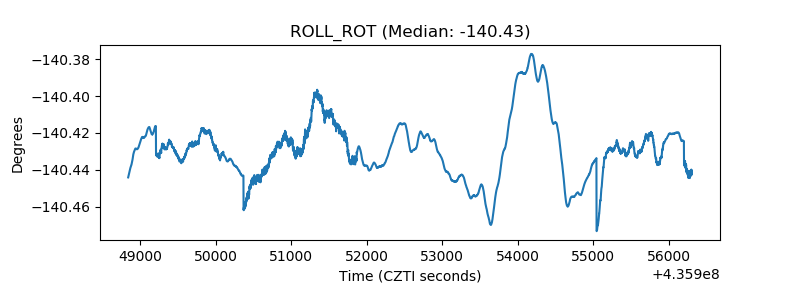 |
| _Roll_DEC | 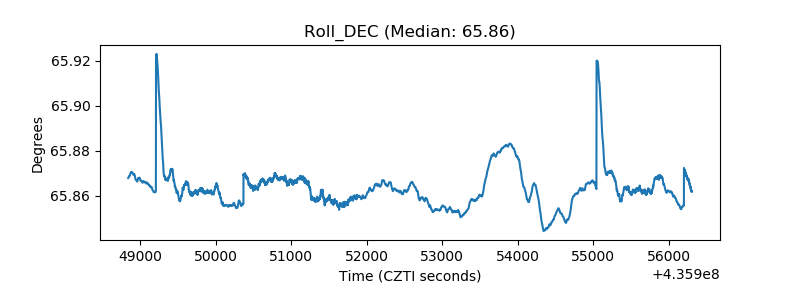 |
| _Roll_RA | 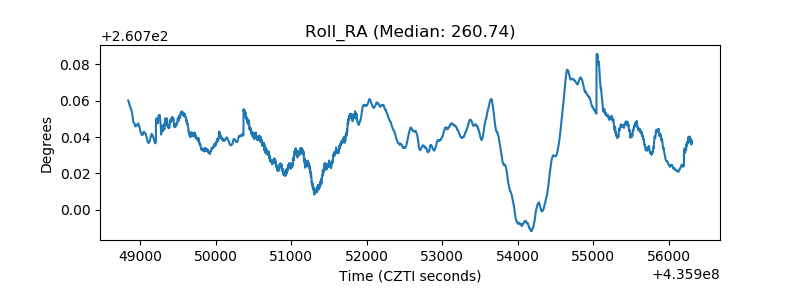 |
| Veto Counter | 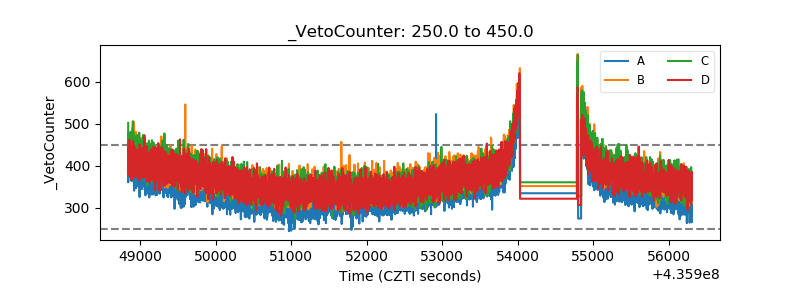 |