| Param | Original file | Final file |
|---|---|---|
| Filename | modeM0/AS1A12_018T01_9000005896_43666cztM0_level2.fits | modeM0/AS1A12_018T01_9000005896_43666cztM0_level2_quad_clean.evt |
| Size (bytes) | 1,100,545,920 | 106,352,640 |
| Size | 1.0 GB | 101.4 MB |
| Events in quadrant A | 10,134,248 | 803,905 |
| Events in quadrant B | 4,319,722 | 821,535 |
| Events in quadrant C | 15,956,931 | 438,704 |
| Events in quadrant D | 9,762,995 | 642,267 |
| Mode SS | |||
|---|---|---|---|
| Quadrant | BADHDUFLAG | Total packets | Discarded packets |
| A | 0 | 148 | 0 |
| B | 0 | 148 | 0 |
| C | 0 | 148 | 0 |
| D | 0 | 148 | 0 |
| Mode M0 | |||
|---|---|---|---|
| Quadrant | BADHDUFLAG | Total packets | Discarded packets |
| A | 0 | 35292 | 1 |
| B | 0 | 17929 | 1 |
| C | 0 | 52435 | 1 |
| D | 0 | 34165 | 6 |
| Mode M9 | |||
|---|---|---|---|
| Quadrant | BADHDUFLAG | Total packets | Discarded packets |
| A | 0 | 3 | 0 |
| B | 0 | 3 | 0 |
| C | 0 | 3 | 0 |
| D | 0 | 3 | 0 |
| Quadrant | Total seconds | Saturated seconds | Saturation percentage |
|---|---|---|---|
| A | 7336 | 648 | 8.833152% |
| B | 7337 | 219 | 2.984871% |
| C | 7337 | 5216 | 71.091727% |
| D | 7336 | 1844 | 25.136314% |
Noise dominated data is calculated using 1-second bins in cleaned event files. If a bin has >2000 counts, and if more than 50% of those come from <1% of pixels, then it is considered to be noise-dominated and hence unusable.
| Quadrant | # 1 sec bins | Bins with >0 counts | Bins with >2000 counts | High rate bins dominated by noise | Noise dominated (total time) | Noise dominated (detector-on time) | Marked lightcurve |
|---|---|---|---|---|---|---|---|
| A | 7526 | 7338 | 116 | 116 | 1.54% | 1.58% | 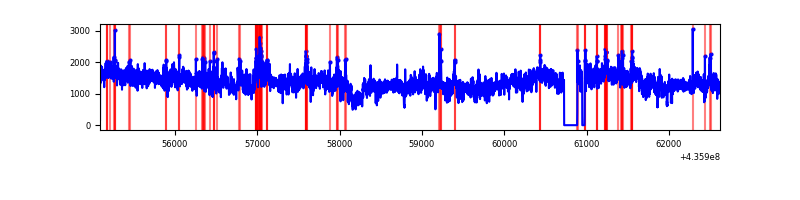 |
| B | 7527 | 7339 | 54 | 54 | 0.72% | 0.74% | 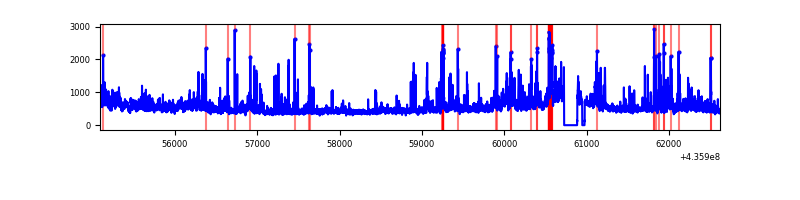 |
| C | 7527 | 7339 | 4614 | 4614 | 61.30% | 62.87% | 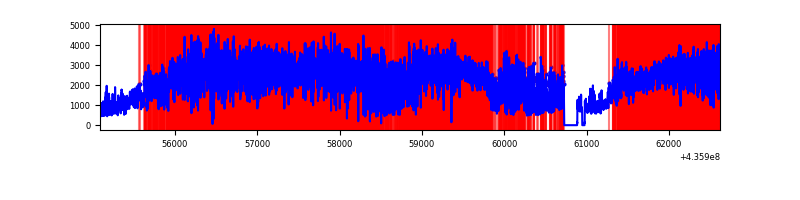 |
| D | 7526 | 7338 | 1527 | 1527 | 20.29% | 20.81% |  |
Top three noisy pixels from each quadrant. If the there are fewer than three noisy pixels in the level2.evt file, extra rows are filled as -1
| Pixel properties | Quadrant properties | ||||||
|---|---|---|---|---|---|---|---|
| Quadrant | DetID | PixID | Counts | Sigma | Mean | Median | Sigma |
| A | 15 | 222 | 5384030 | 32806.09 | 804 | 786 | 164.1 |
| A | 10 | 83 | 902633 | 5495.95 | 804 | 786 | 164.1 |
| A | 0 | 228 | 354619 | 2156.3 | 804 | 786 | 164.1 |
| B | 4 | 206 | 270791 | 1719.73 | 814 | 789 | 157.0 |
| B | 0 | 230 | 159564 | 1011.29 | 814 | 789 | 157.0 |
| B | 5 | 235 | 148281 | 939.42 | 814 | 789 | 157.0 |
| C | 15 | 142 | 11790953 | 105475.38 | 476 | 478 | 111.8 |
| C | 15 | 158 | 1611515 | 14412.03 | 476 | 478 | 111.8 |
| C | 15 | 157 | 294803 | 2632.97 | 476 | 478 | 111.8 |
| D | 12 | 6 | 2167278 | 10566.63 | 723 | 705 | 205.0 |
| D | 7 | 80 | 914873 | 4458.5 | 723 | 705 | 205.0 |
| D | 1 | 52 | 597810 | 2912.15 | 723 | 705 | 205.0 |
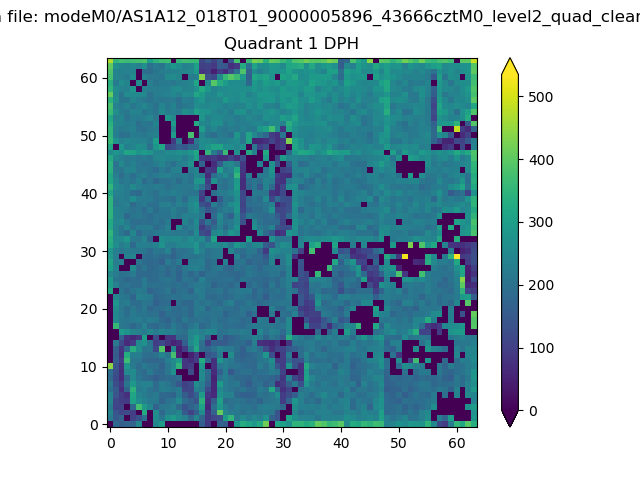
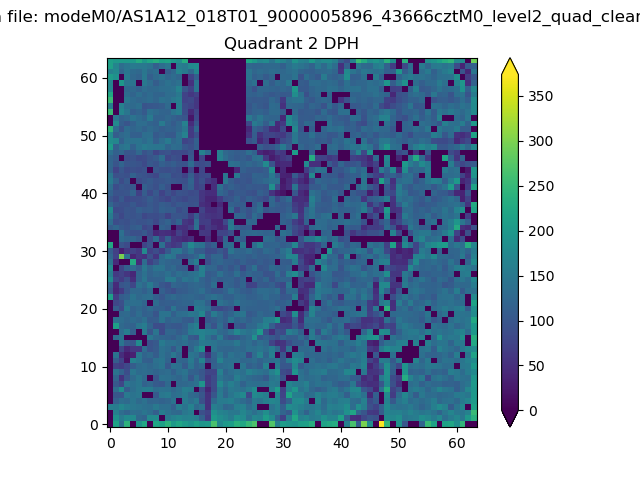
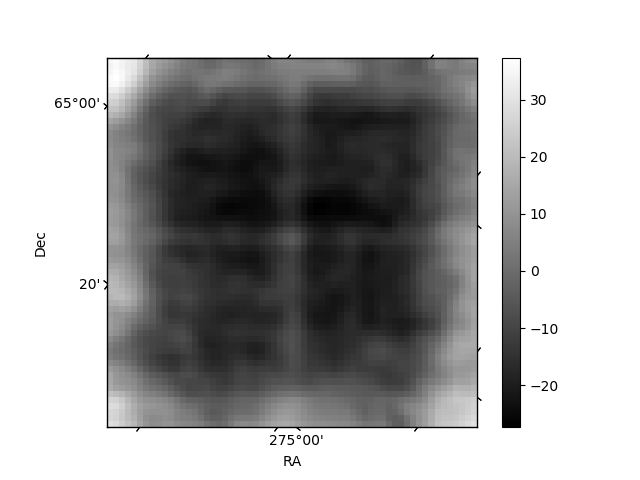
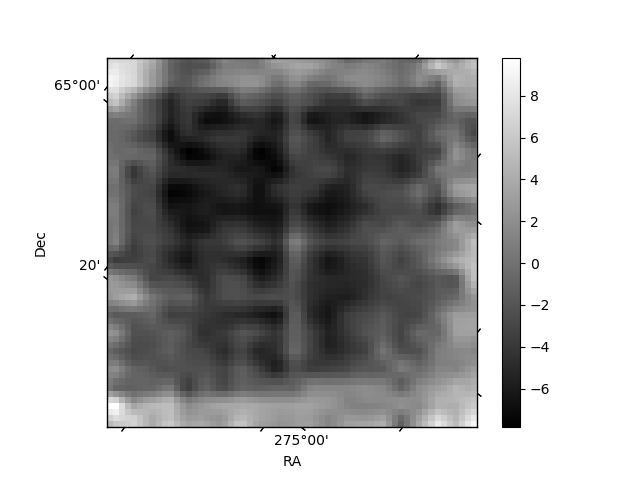
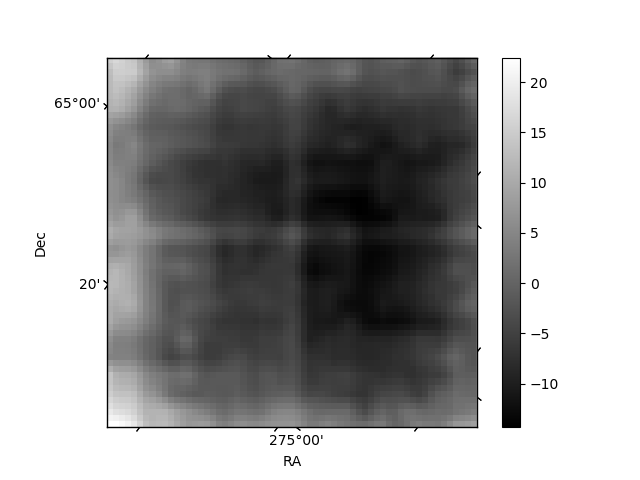
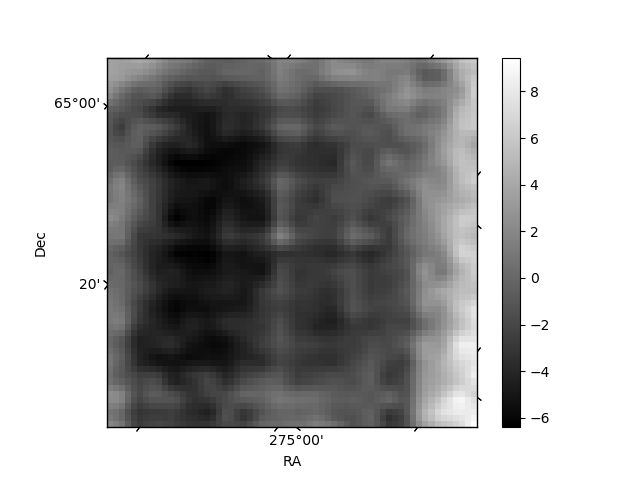
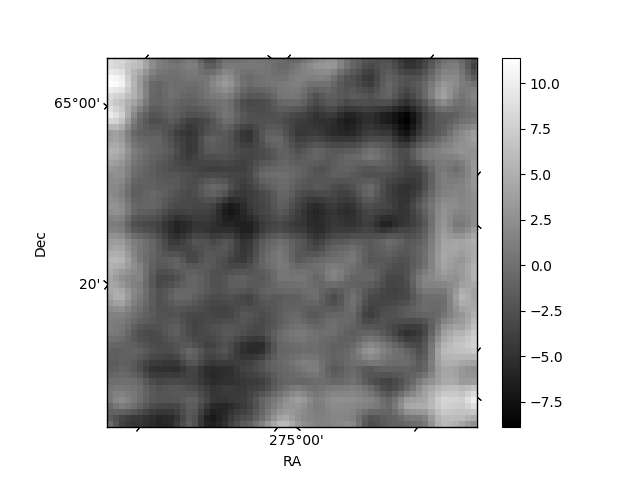
Histogram calculated using DETX and DETY for each event in the final _common_clean file
| Quadrant A | 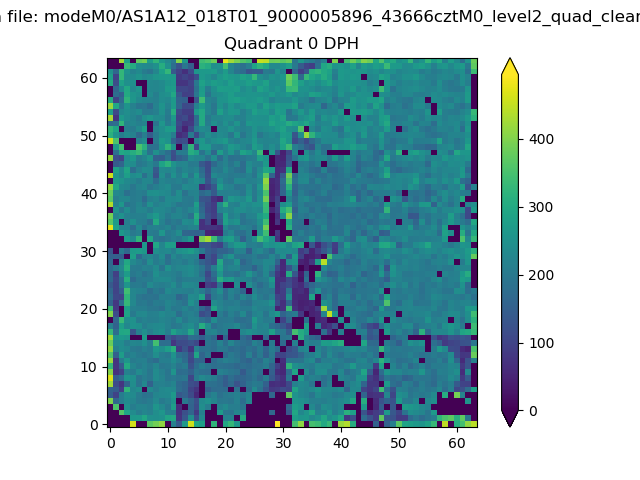 |
 |
Quadrant B |
|---|---|---|---|
| Quadrant D | 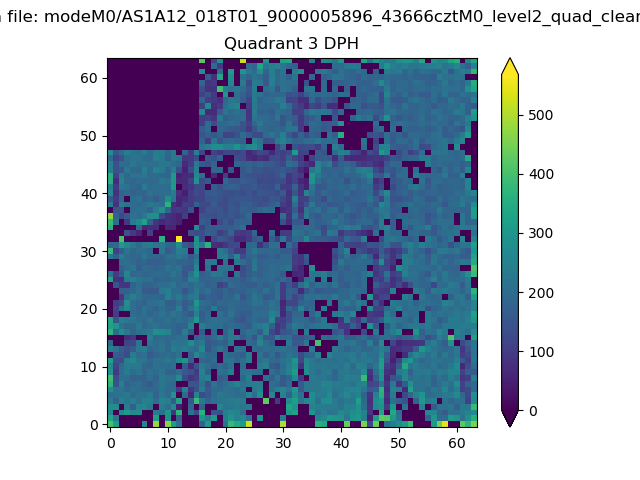 |
 |
Quadrant C |
| Plot type | Count rate plots | Images |
|---|---|---|
| Comparison with Poisson distribution Blue bars denote a histogram of data divided into 1 sec bins. Red curve is a Poisson curve with rate = median count rate of data. |
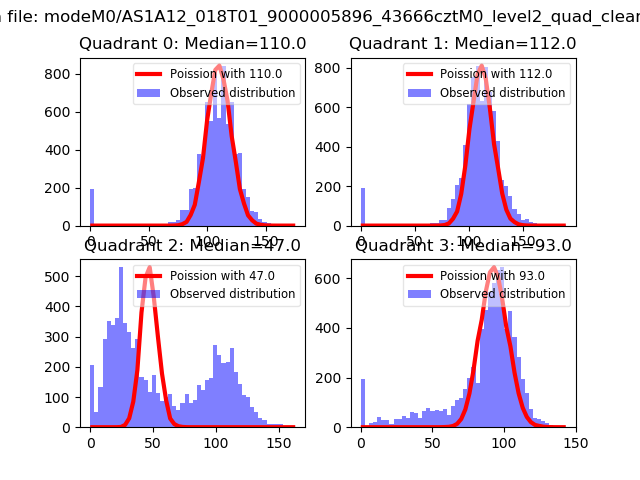 |
 |
| Quadrant-wise count rates Data is divided into 100 sec bins |
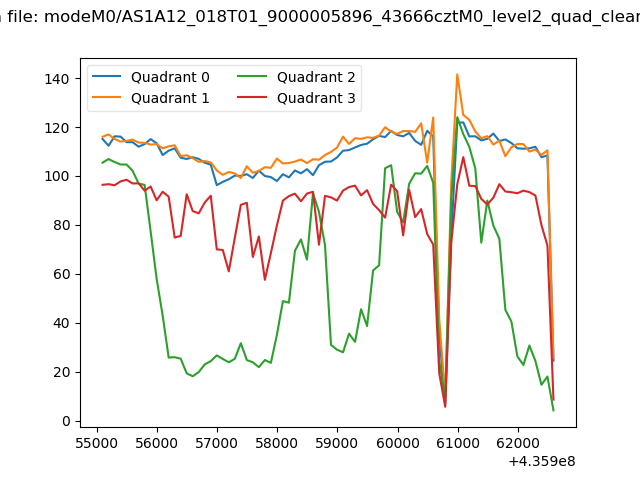 |
|
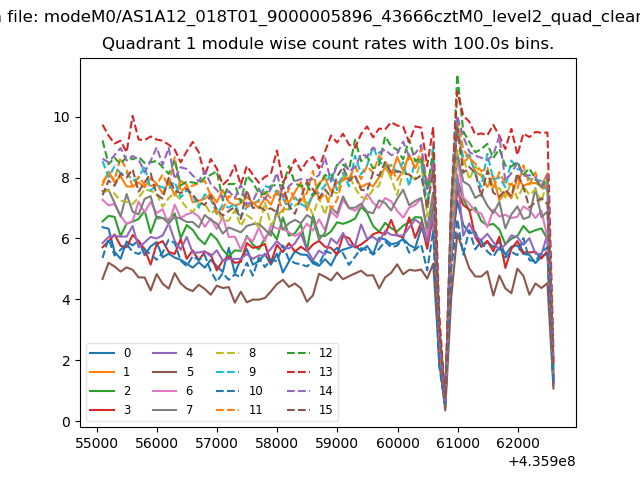
| Module-wise count rates for Quadrant A Data is divided into 100 sec bins |
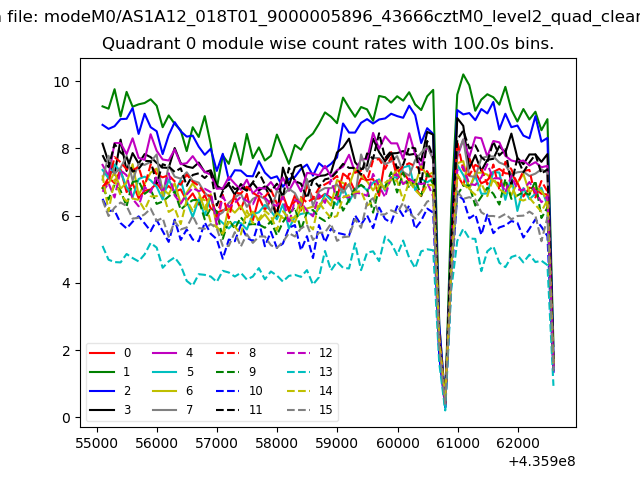 |
 |
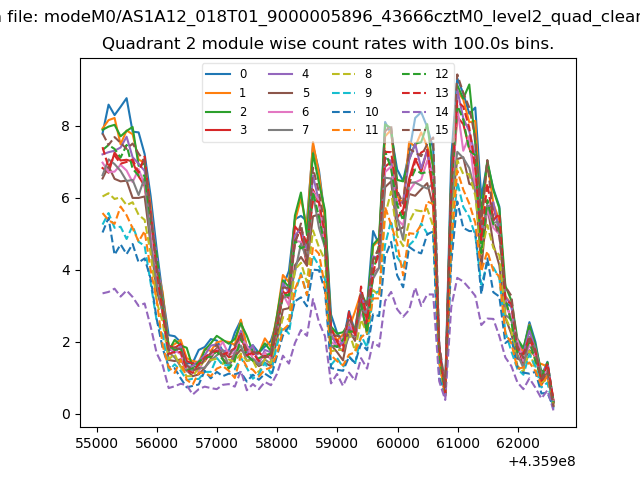
| Module-wise count rates for Quadrant B Data is divided into 100 sec bins |
 |
 |
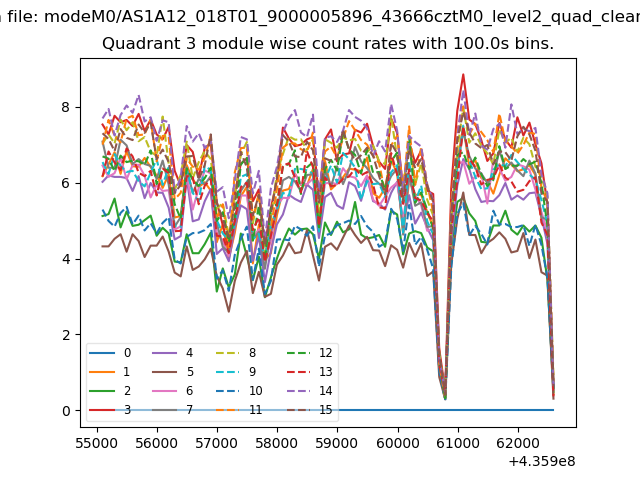
| Module-wise count rates for Quadrant C Data is divided into 100 sec bins |
 |
 |
| Module-wise count rates for Quadrant D Data is divided into 100 sec bins |
 |
 |
| Parameter | Plot |
|---|---|
| CZT HV Monitor |  |
| D_VDD | 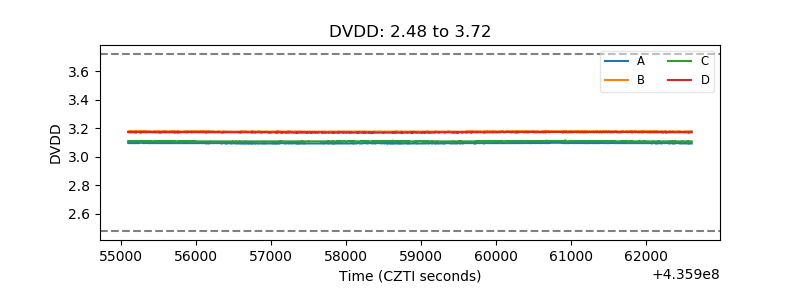 |
| Temperature 1 | 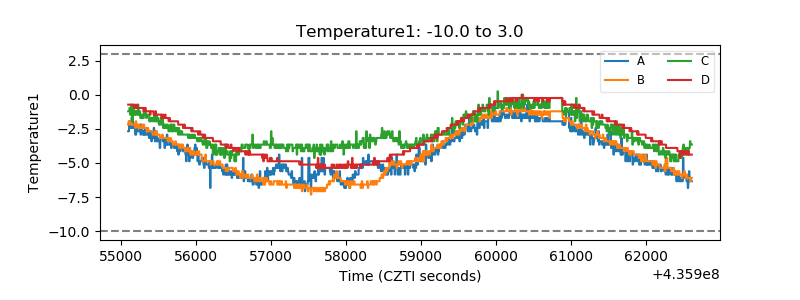 |
| Veto HV Monitor | 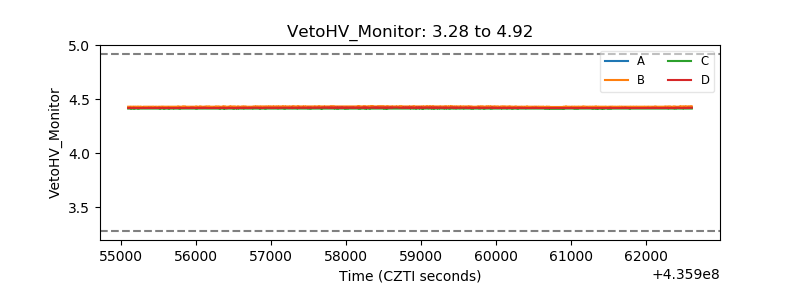 |
| Veto LLD | 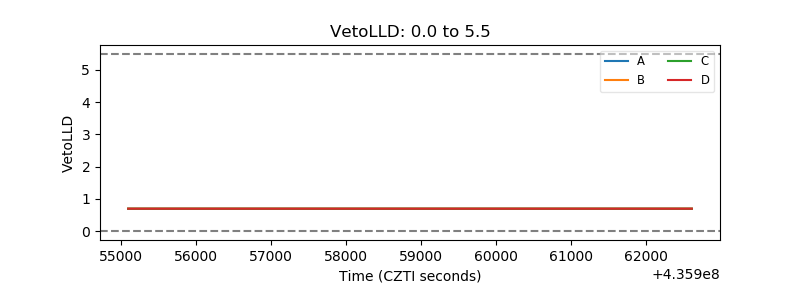 |
| Alpha Counter | 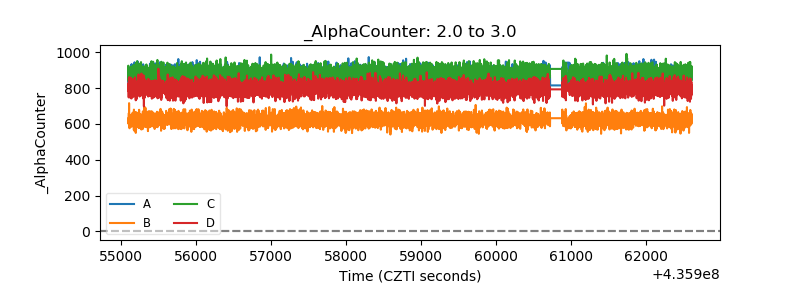 |
| _CPM_Rate | 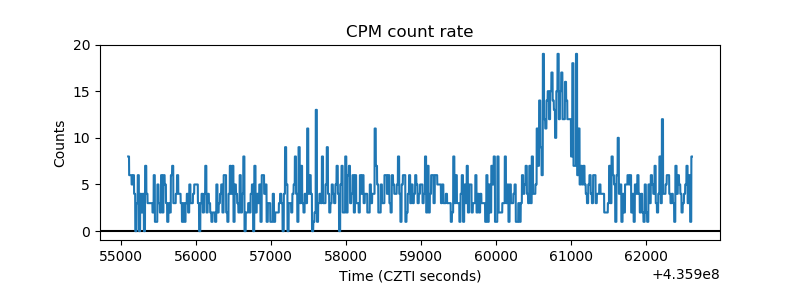 |
| CZT Counter | 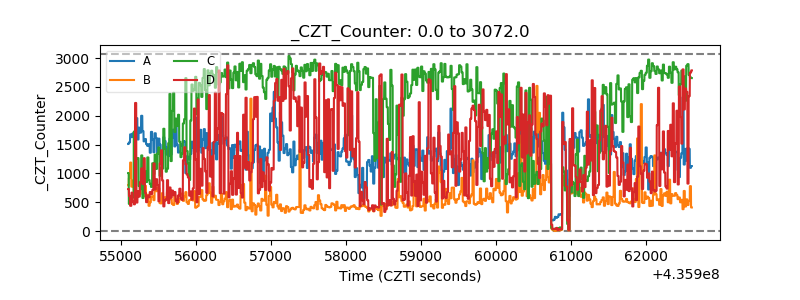 |
| +2.5 Volts monitor | 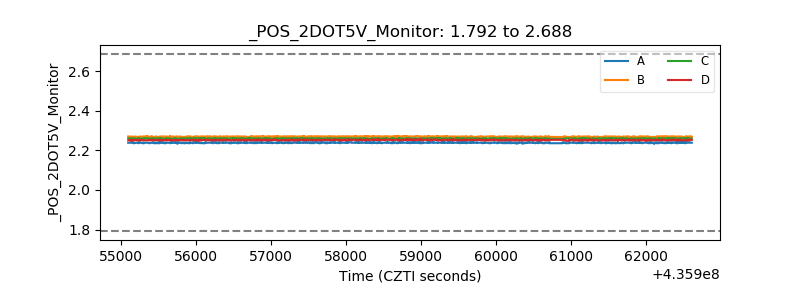 |
| +5 Volts monitor | 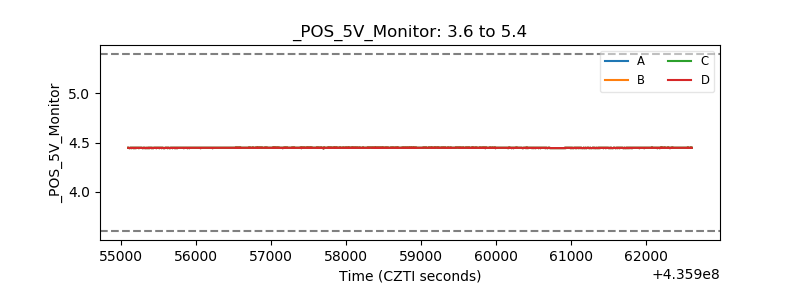 |
| _ROLL_ROT | 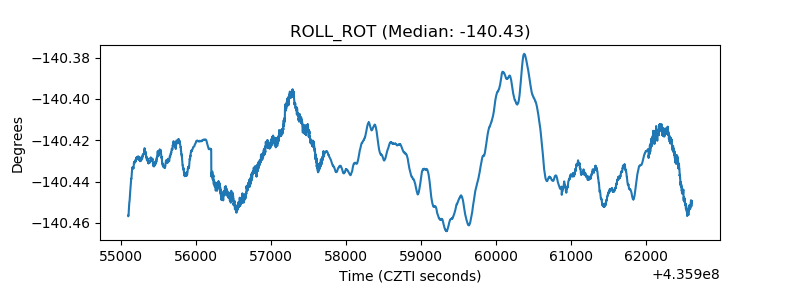 |
| _Roll_DEC | 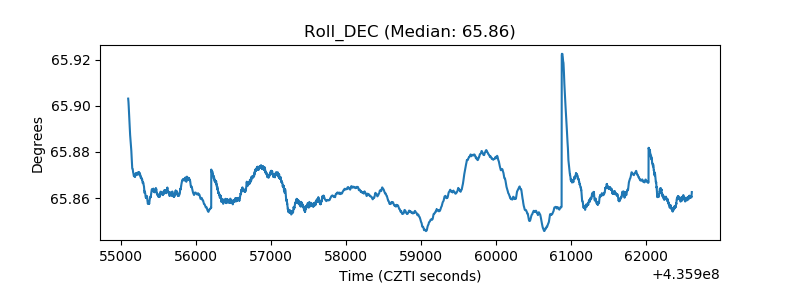 |
| _Roll_RA | 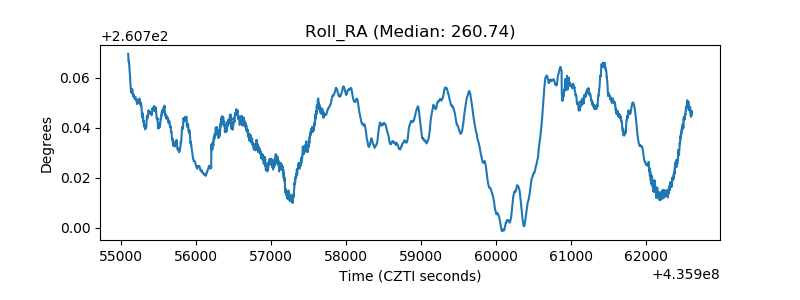 |
| Veto Counter | 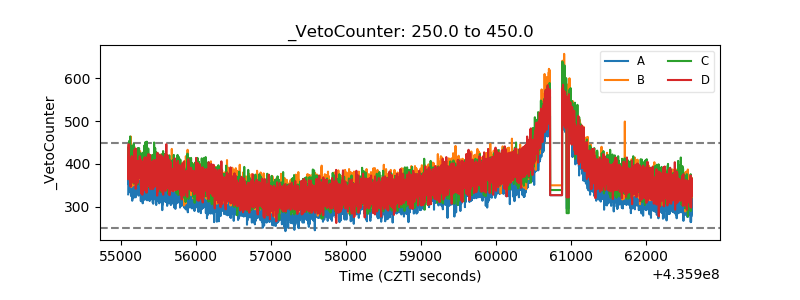 |