| Param | Original file | Final file |
|---|---|---|
| Filename | modeM0/AS1A12_018T01_9000005896_43667cztM0_level2.fits | modeM0/AS1A12_018T01_9000005896_43667cztM0_level2_quad_clean.evt |
| Size (bytes) | 1,224,149,760 | 110,718,720 |
| Size | 1.1 GB | 105.6 MB |
| Events in quadrant A | 10,628,541 | 853,242 |
| Events in quadrant B | 4,367,775 | 885,705 |
| Events in quadrant C | 19,761,081 | 353,710 |
| Events in quadrant D | 9,947,194 | 704,866 |
| Mode SS | |||
|---|---|---|---|
| Quadrant | BADHDUFLAG | Total packets | Discarded packets |
| A | 0 | 158 | 0 |
| B | 0 | 158 | 0 |
| C | 0 | 158 | 0 |
| D | 0 | 158 | 0 |
| Mode M0 | |||
|---|---|---|---|
| Quadrant | BADHDUFLAG | Total packets | Discarded packets |
| A | 0 | 37077 | 1 |
| B | 0 | 18417 | 1 |
| C | 0 | 64020 | 1 |
| D | 0 | 35148 | 2 |
| Quadrant | Total seconds | Saturated seconds | Saturation percentage |
|---|---|---|---|
| A | 7913 | 814 | 10.286870% |
| B | 7914 | 99 | 1.250948% |
| C | 7914 | 7353 | 92.911296% |
| D | 7913 | 1660 | 20.978137% |
Noise dominated data is calculated using 1-second bins in cleaned event files. If a bin has >2000 counts, and if more than 50% of those come from <1% of pixels, then it is considered to be noise-dominated and hence unusable.
| Quadrant | # 1 sec bins | Bins with >0 counts | Bins with >2000 counts | High rate bins dominated by noise | Noise dominated (total time) | Noise dominated (detector-on time) | Marked lightcurve |
|---|---|---|---|---|---|---|---|
| A | 7913 | 7913 | 386 | 386 | 4.88% | 4.88% | 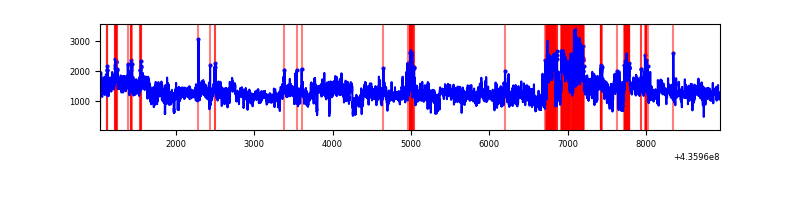 |
| B | 7914 | 7914 | 27 | 27 | 0.34% | 0.34% | 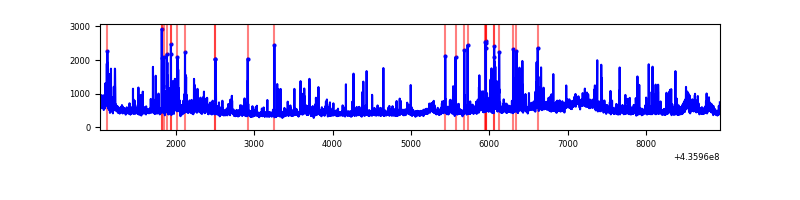 |
| C | 7914 | 7914 | 6494 | 6494 | 82.06% | 82.06% | 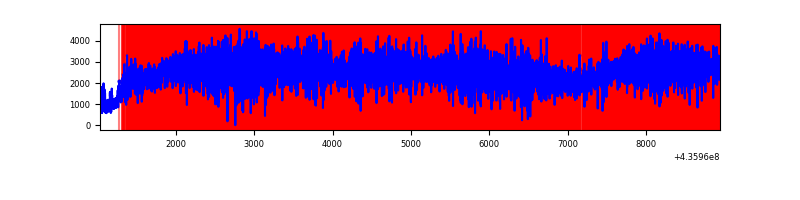 |
| D | 7913 | 7913 | 1271 | 1271 | 16.06% | 16.06% | 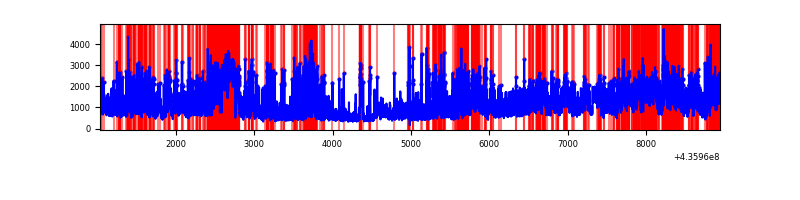 |
Top three noisy pixels from each quadrant. If the there are fewer than three noisy pixels in the level2.evt file, extra rows are filled as -1
| Pixel properties | Quadrant properties | ||||||
|---|---|---|---|---|---|---|---|
| Quadrant | DetID | PixID | Counts | Sigma | Mean | Median | Sigma |
| A | 15 | 222 | 5197501 | 29409.11 | 854 | 836 | 176.7 |
| A | 10 | 83 | 939079 | 5309.73 | 854 | 836 | 176.7 |
| A | 15 | 223 | 849541 | 4803.02 | 854 | 836 | 176.7 |
| B | 4 | 206 | 192286 | 1121.73 | 886 | 860 | 170.7 |
| B | 0 | 230 | 124667 | 725.49 | 886 | 860 | 170.7 |
| B | 5 | 235 | 120835 | 703.04 | 886 | 860 | 170.7 |
| C | 15 | 142 | 15936701 | 173915.42 | 389 | 389 | 91.6 |
| C | 15 | 158 | 1591874 | 17368.12 | 389 | 389 | 91.6 |
| C | 15 | 157 | 319219 | 3479.44 | 389 | 389 | 91.6 |
| D | 12 | 6 | 1034669 | 4685.21 | 805 | 788 | 220.7 |
| D | 4 | 221 | 984356 | 4457.2 | 805 | 788 | 220.7 |
| D | 7 | 80 | 910454 | 4122.31 | 805 | 788 | 220.7 |
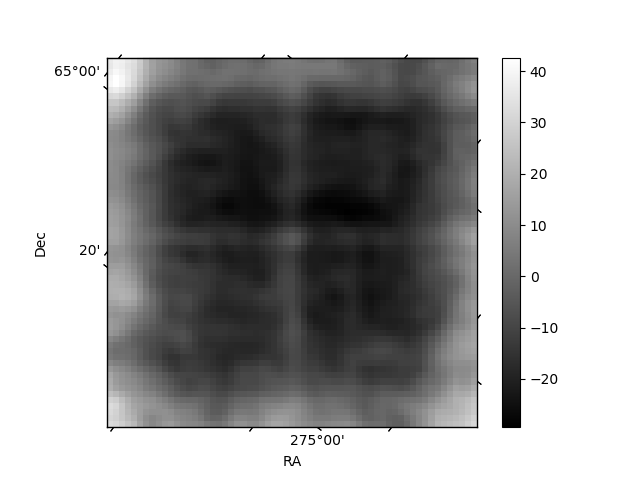
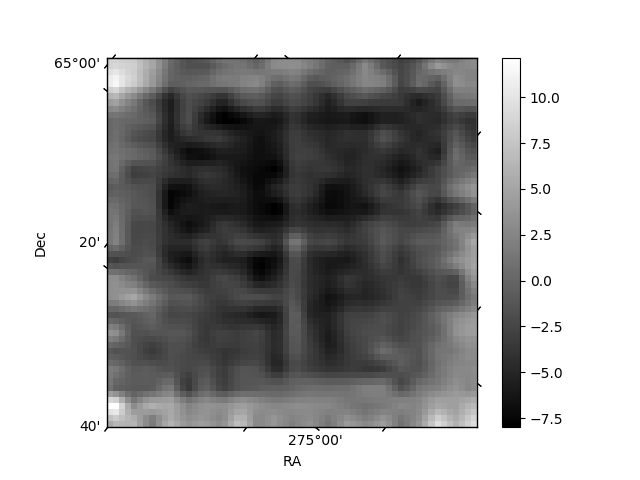
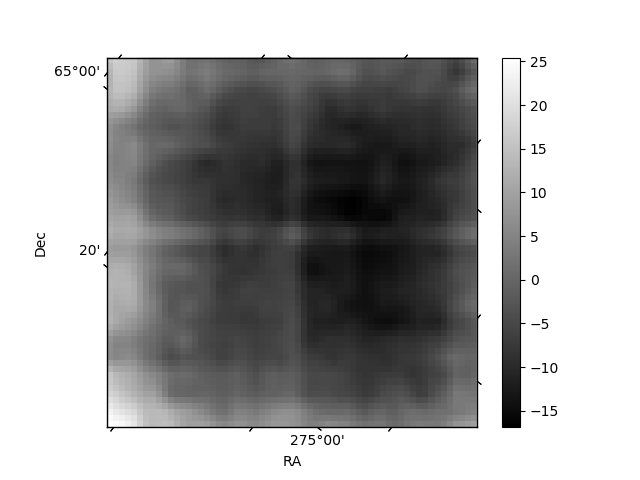
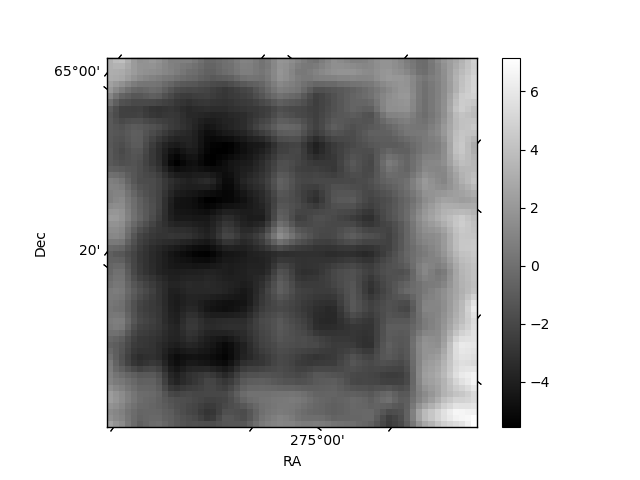
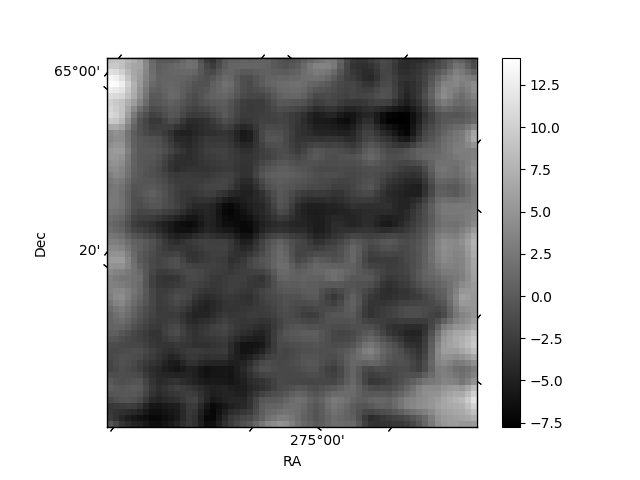
Histogram calculated using DETX and DETY for each event in the final _common_clean file
| Quadrant A | 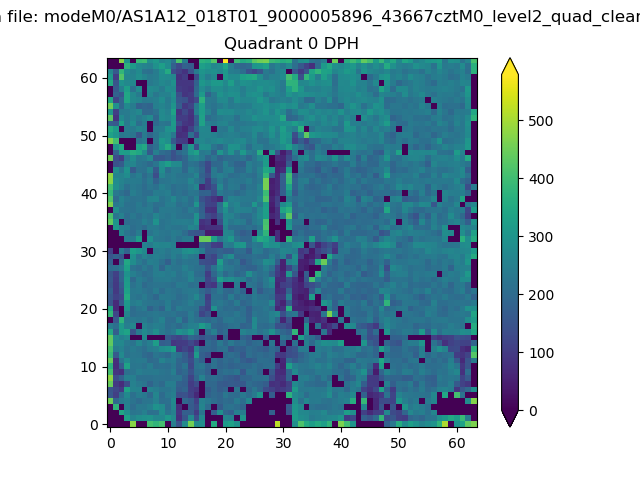 |
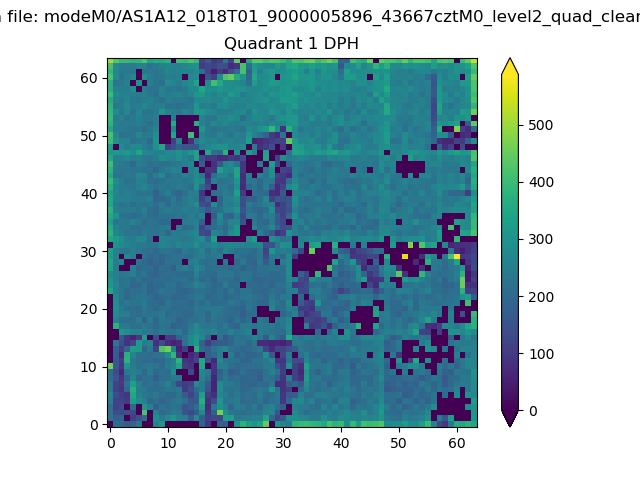 |
Quadrant B |
|---|---|---|---|
| Quadrant D | 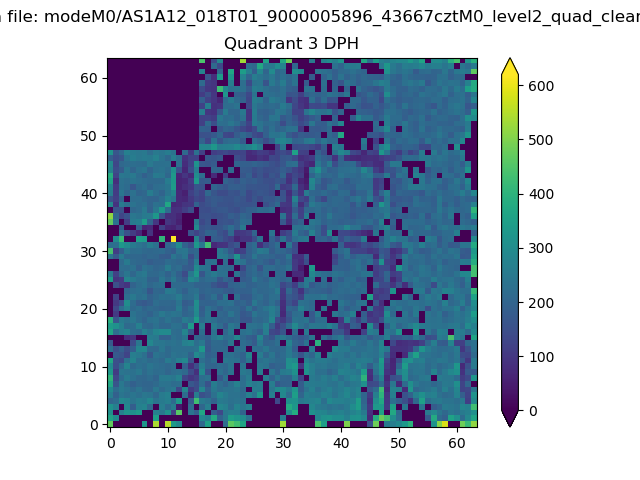 |
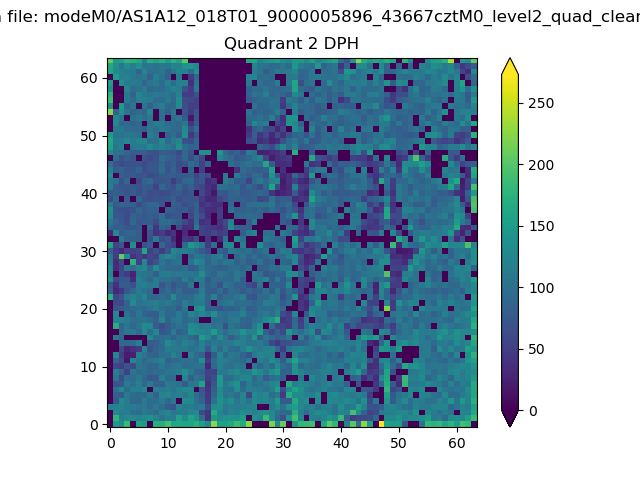 |
Quadrant C |
| Plot type | Count rate plots | Images |
|---|---|---|
| Comparison with Poisson distribution Blue bars denote a histogram of data divided into 1 sec bins. Red curve is a Poisson curve with rate = median count rate of data. |
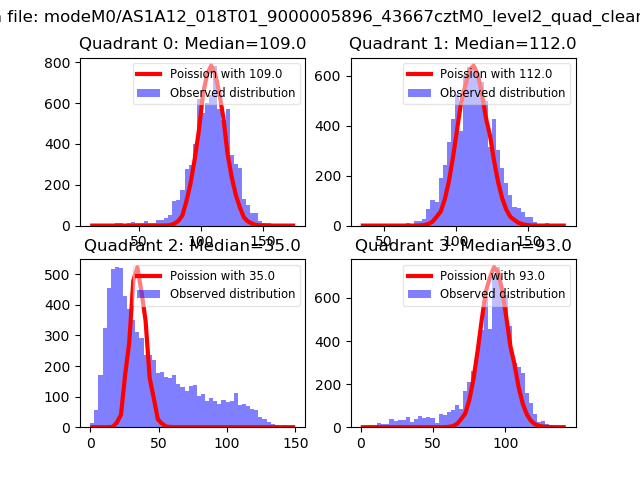 |
 |
| Quadrant-wise count rates Data is divided into 100 sec bins |
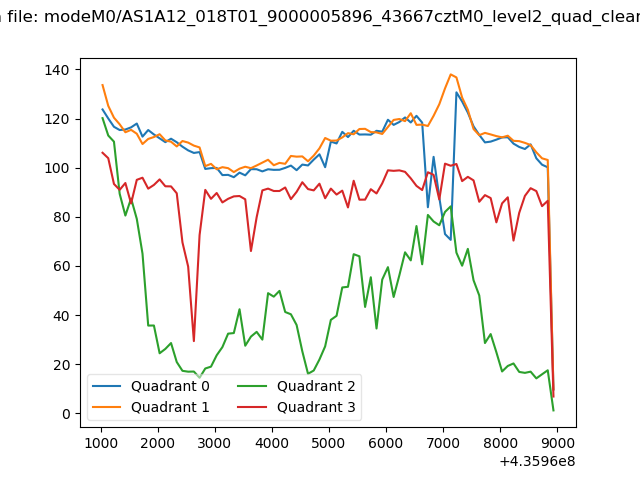 |
|
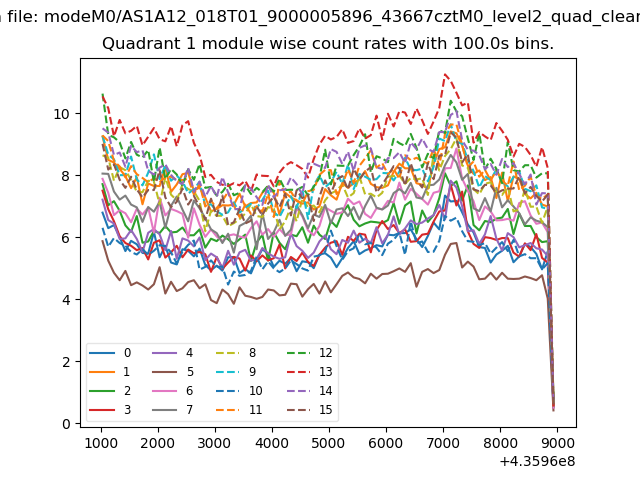
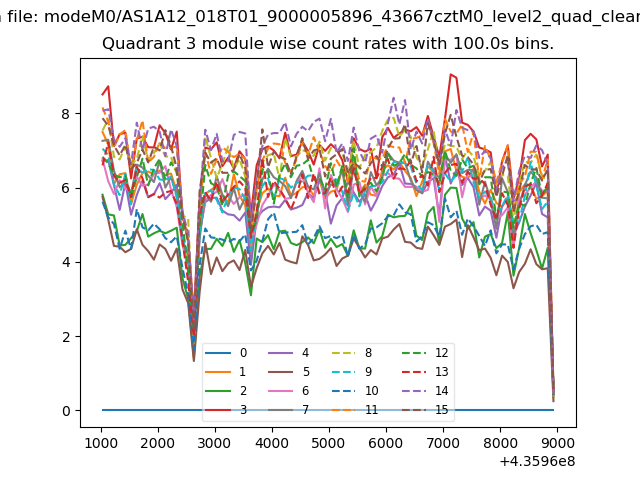
| Module-wise count rates for Quadrant A Data is divided into 100 sec bins |
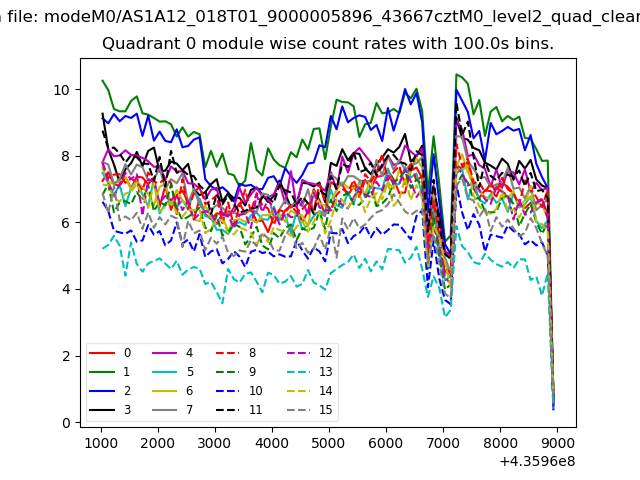 |
 |
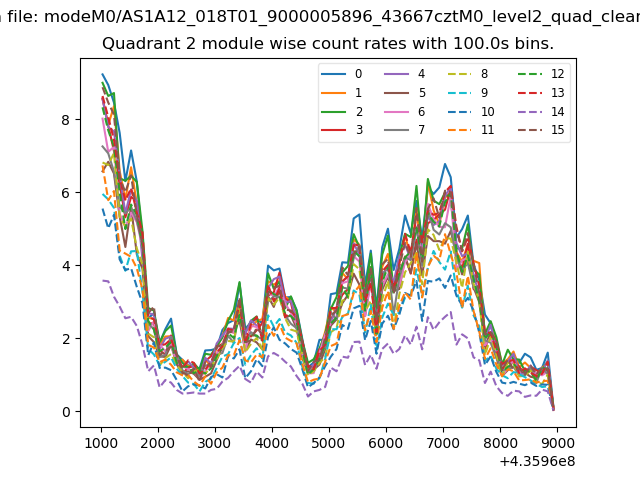
| Module-wise count rates for Quadrant B Data is divided into 100 sec bins |
 |
 |
| Module-wise count rates for Quadrant C Data is divided into 100 sec bins |
 |
 |
| Module-wise count rates for Quadrant D Data is divided into 100 sec bins |
 |
 |
| Parameter | Plot |
|---|---|
| CZT HV Monitor | 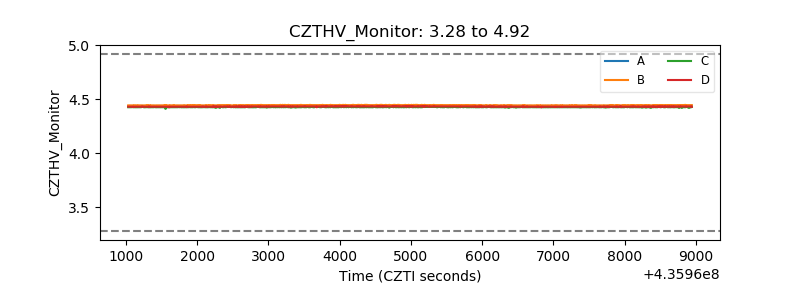 |
| D_VDD | 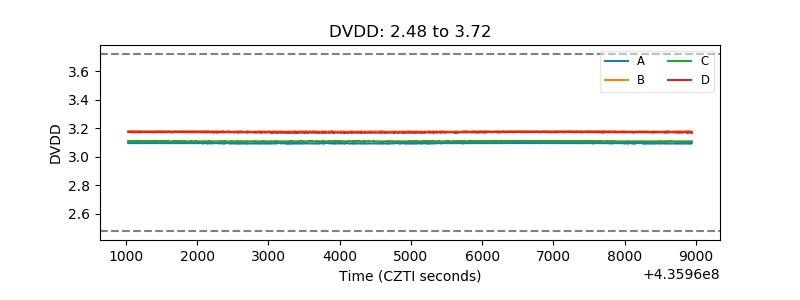 |
| Temperature 1 | 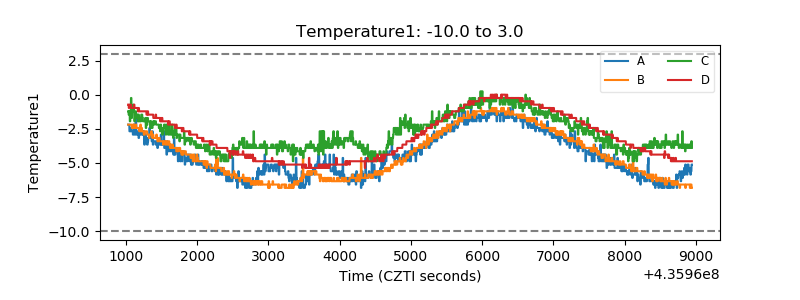 |
| Veto HV Monitor | 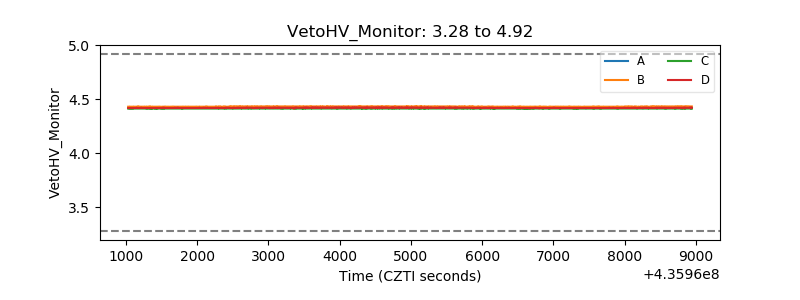 |
| Veto LLD | 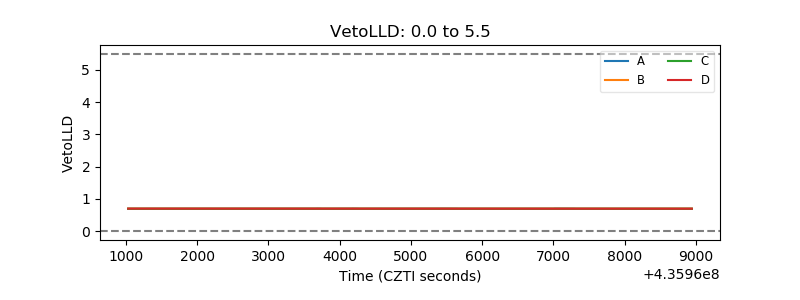 |
| Alpha Counter | 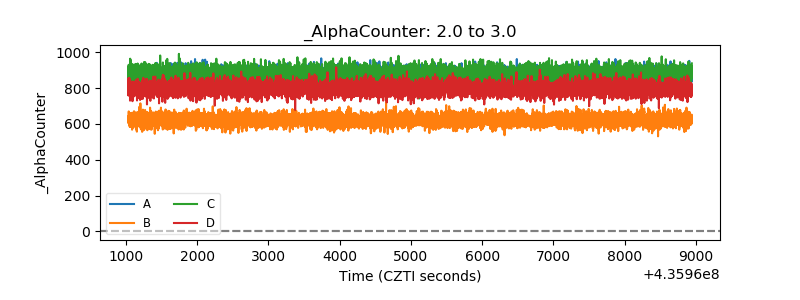 |
| _CPM_Rate | 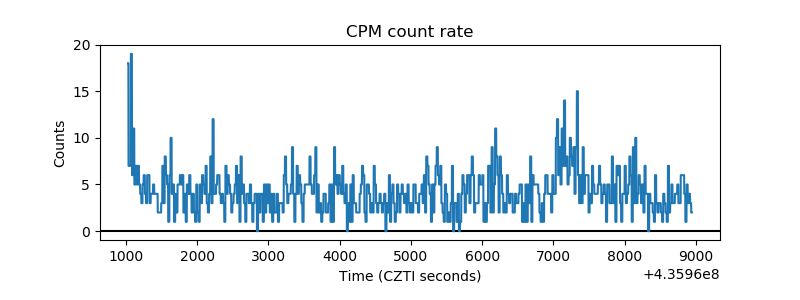 |
| CZT Counter | 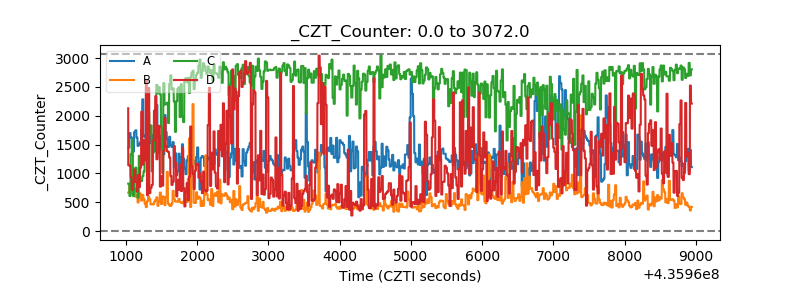 |
| +2.5 Volts monitor | 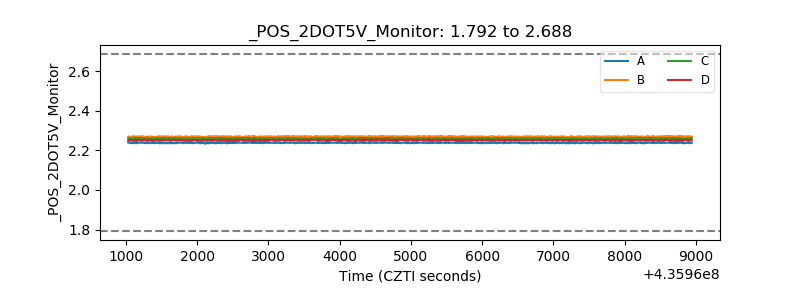 |
| +5 Volts monitor | 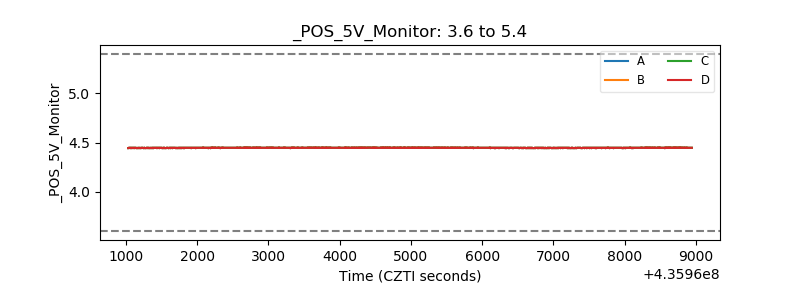 |
| _ROLL_ROT | 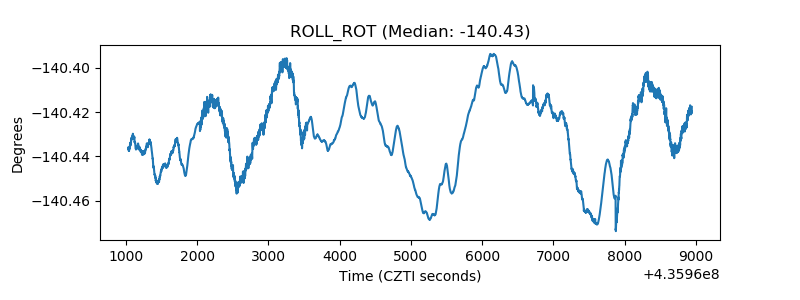 |
| _Roll_DEC | 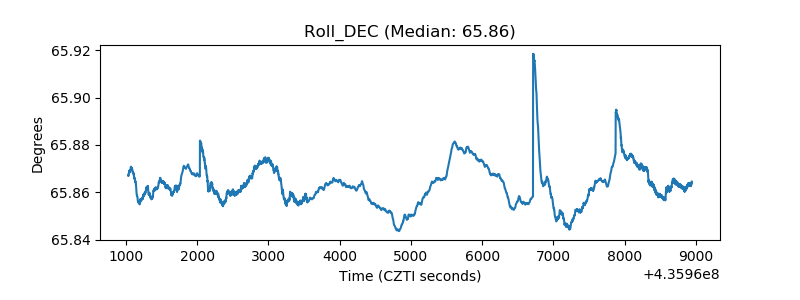 |
| _Roll_RA | 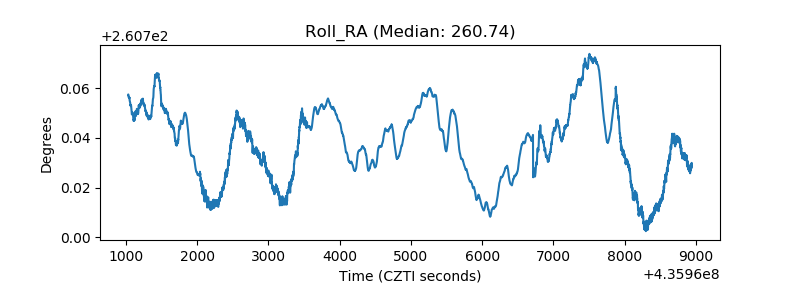 |
| Veto Counter | 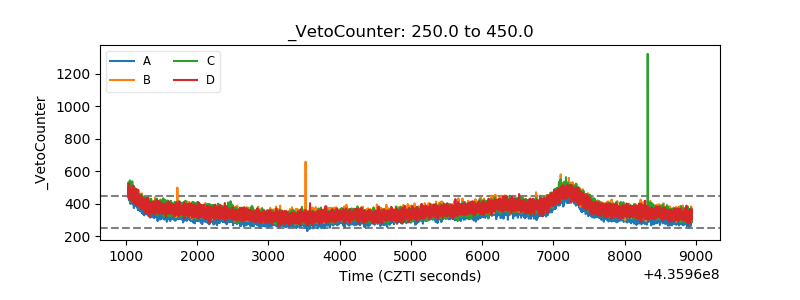 |