| Param | Original file | Final file |
|---|---|---|
| Filename | modeM0/AS1A12_018T01_9000005896_43668cztM0_level2.fits | modeM0/AS1A12_018T01_9000005896_43668cztM0_level2_quad_clean.evt |
| Size (bytes) | 1,202,477,760 | 99,771,840 |
| Size | 1.1 GB | 95.1 MB |
| Events in quadrant A | 9,354,317 | 809,485 |
| Events in quadrant B | 4,397,500 | 820,299 |
| Events in quadrant C | 19,220,008 | 239,741 |
| Events in quadrant D | 10,961,428 | 624,139 |
| Mode SS | |||
|---|---|---|---|
| Quadrant | BADHDUFLAG | Total packets | Discarded packets |
| A | 0 | 150 | 0 |
| B | 0 | 150 | 0 |
| C | 0 | 150 | 0 |
| D | 0 | 150 | 0 |
| Mode M0 | |||
|---|---|---|---|
| Quadrant | BADHDUFLAG | Total packets | Discarded packets |
| A | 0 | 33092 | 1 |
| B | 0 | 18338 | 1 |
| C | 0 | 62158 | 1 |
| D | 0 | 37833 | 1 |
| Mode M9 | |||
|---|---|---|---|
| Quadrant | BADHDUFLAG | Total packets | Discarded packets |
| A | 0 | 1 | 0 |
| B | 0 | 1 | 0 |
| C | 0 | 1 | 0 |
| D | 0 | 1 | 0 |
| Quadrant | Total seconds | Saturated seconds | Saturation percentage |
|---|---|---|---|
| A | 7514 | 421 | 5.602875% |
| B | 7513 | 261 | 3.473978% |
| C | 7514 | 7153 | 95.195635% |
| D | 7514 | 2397 | 31.900452% |
Noise dominated data is calculated using 1-second bins in cleaned event files. If a bin has >2000 counts, and if more than 50% of those come from <1% of pixels, then it is considered to be noise-dominated and hence unusable.
| Quadrant | # 1 sec bins | Bins with >0 counts | Bins with >2000 counts | High rate bins dominated by noise | Noise dominated (total time) | Noise dominated (detector-on time) | Marked lightcurve |
|---|---|---|---|---|---|---|---|
| A | 7544 | 7515 | 78 | 78 | 1.03% | 1.04% | 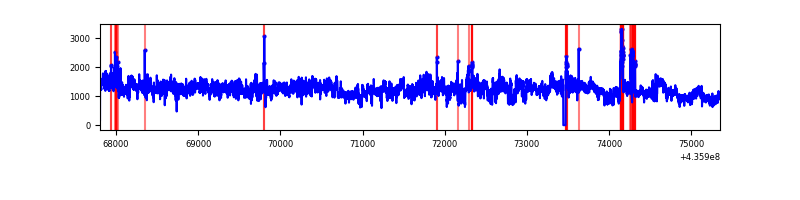 |
| B | 7543 | 7514 | 144 | 144 | 1.91% | 1.92% | 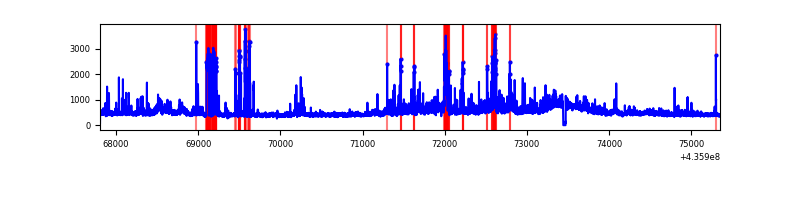 |
| C | 7544 | 7515 | 6426 | 6426 | 85.18% | 85.51% | 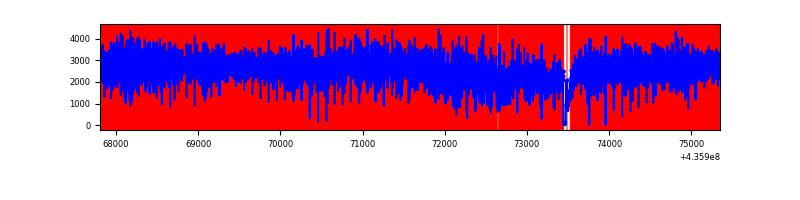 |
| D | 7544 | 7515 | 1969 | 1969 | 26.10% | 26.20% | 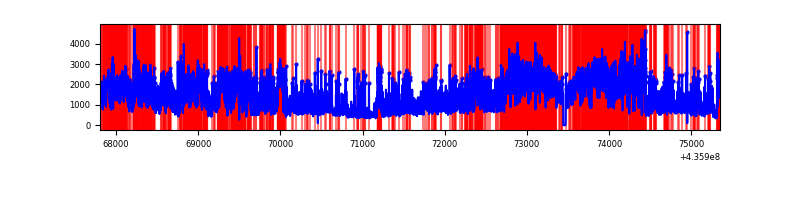 |
Top three noisy pixels from each quadrant. If the there are fewer than three noisy pixels in the level2.evt file, extra rows are filled as -1
| Pixel properties | Quadrant properties | ||||||
|---|---|---|---|---|---|---|---|
| Quadrant | DetID | PixID | Counts | Sigma | Mean | Median | Sigma |
| A | 15 | 222 | 4948775 | 29263.97 | 820 | 802 | 169.1 |
| A | 10 | 83 | 860723 | 5085.86 | 820 | 802 | 169.1 |
| A | 15 | 223 | 112309 | 659.49 | 820 | 802 | 169.1 |
| B | 0 | 229 | 262282 | 1632.8 | 827 | 804 | 160.1 |
| B | 4 | 206 | 255710 | 1591.76 | 827 | 804 | 160.1 |
| B | 5 | 235 | 209975 | 1306.17 | 827 | 804 | 160.1 |
| C | 15 | 142 | 16697875 | 257894.59 | 270 | 271 | 64.7 |
| C | 15 | 158 | 990081 | 15287.62 | 270 | 271 | 64.7 |
| C | 15 | 126 | 138611 | 2136.66 | 270 | 271 | 64.7 |
| D | 12 | 6 | 1914248 | 9510.26 | 708 | 692 | 201.2 |
| D | 4 | 221 | 1389990 | 6904.73 | 708 | 692 | 201.2 |
| D | 7 | 80 | 1319139 | 6552.6 | 708 | 692 | 201.2 |
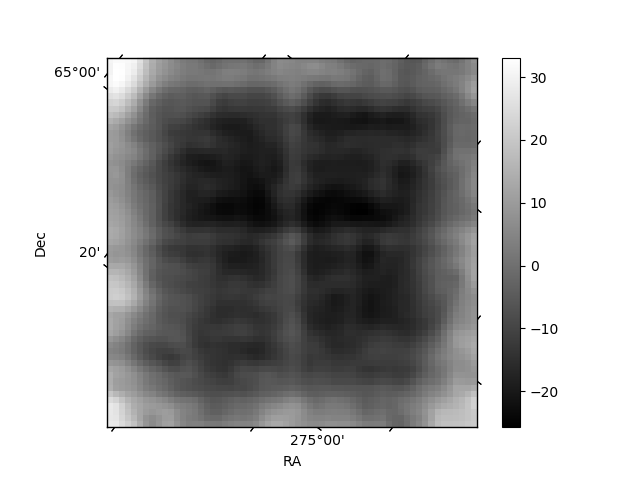
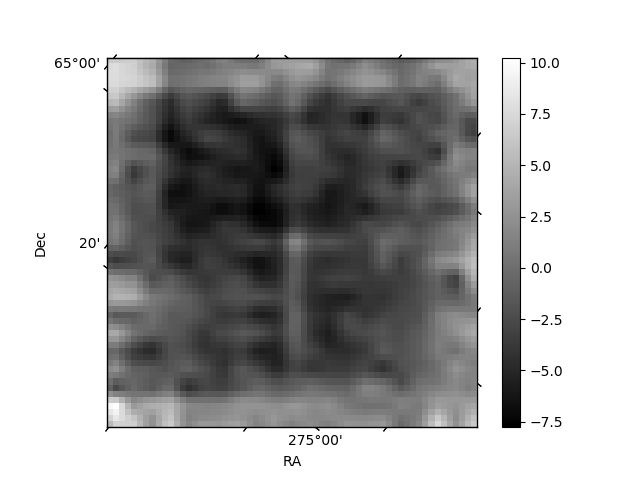
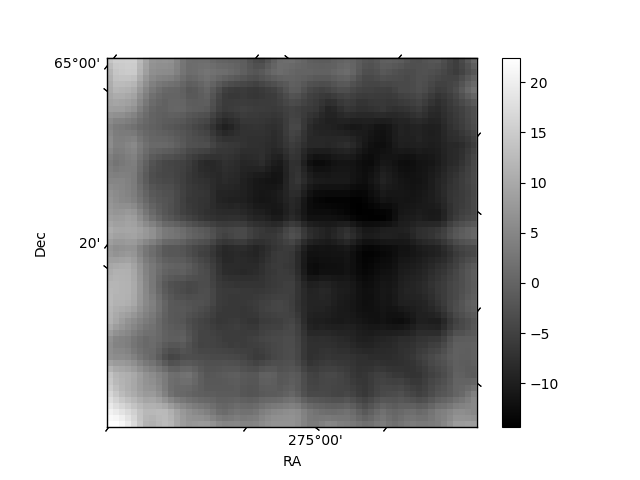
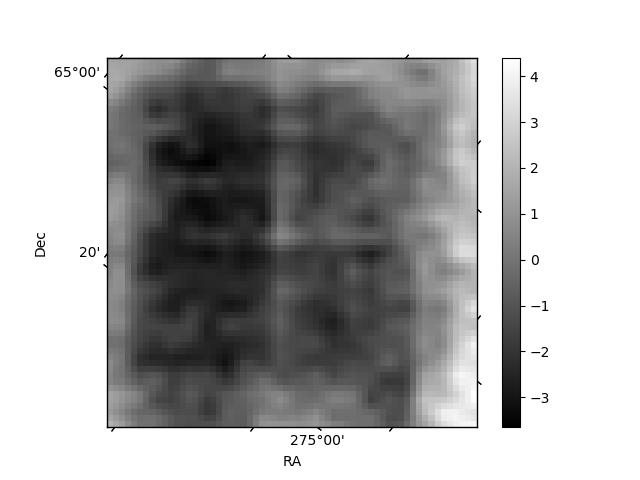
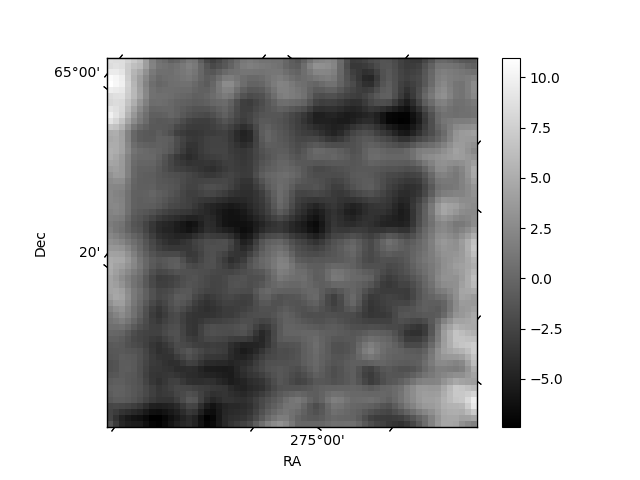
Histogram calculated using DETX and DETY for each event in the final _common_clean file
| Quadrant A | 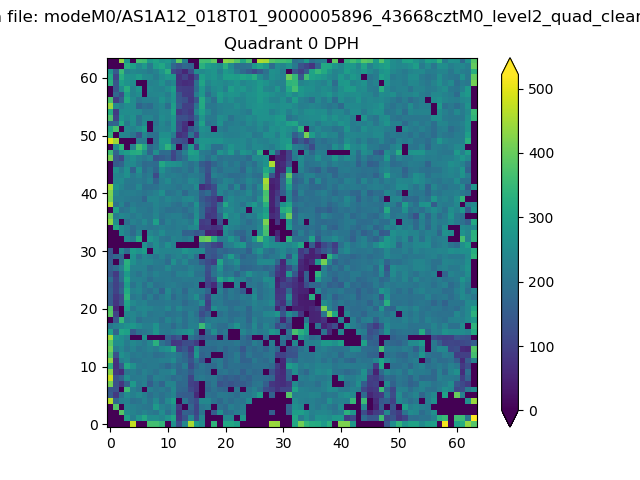 |
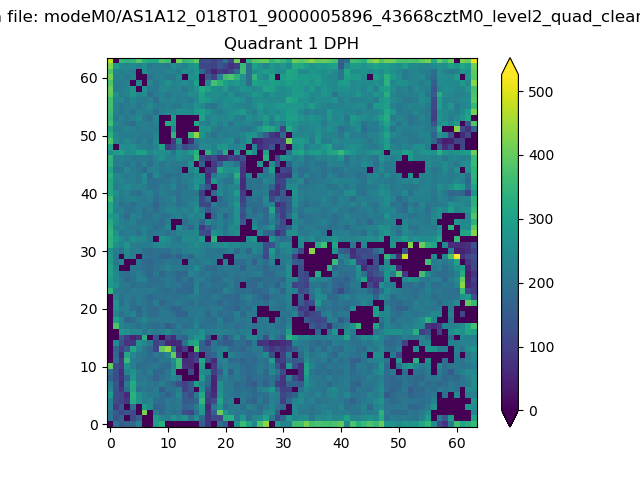 |
Quadrant B |
|---|---|---|---|
| Quadrant D | 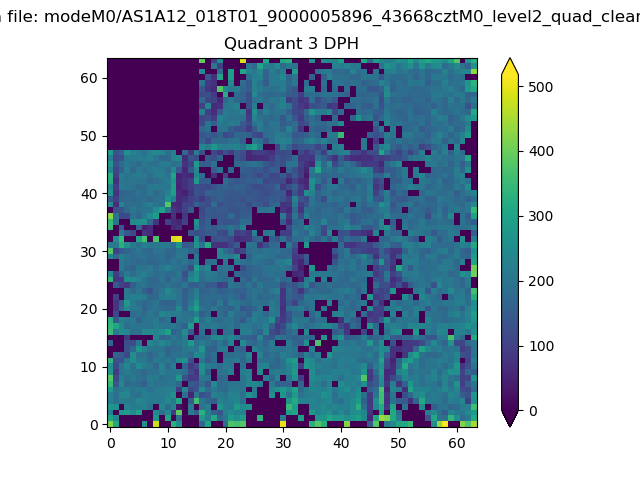 |
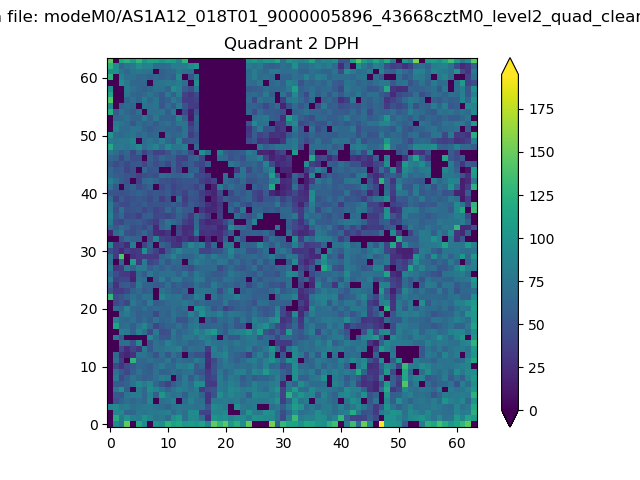 |
Quadrant C |
| Plot type | Count rate plots | Images |
|---|---|---|
| Comparison with Poisson distribution Blue bars denote a histogram of data divided into 1 sec bins. Red curve is a Poisson curve with rate = median count rate of data. |
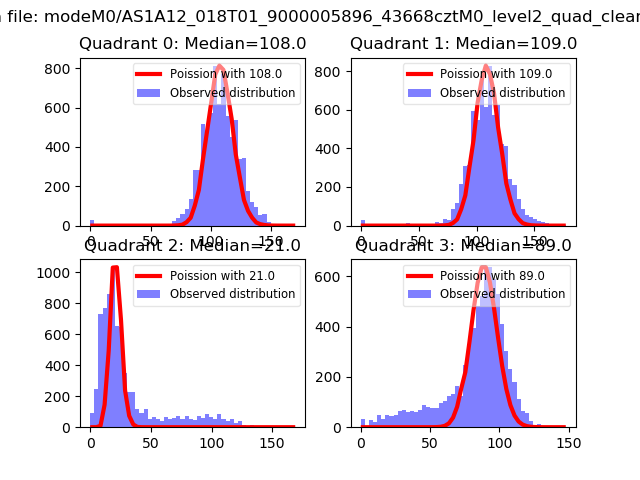 |
 |
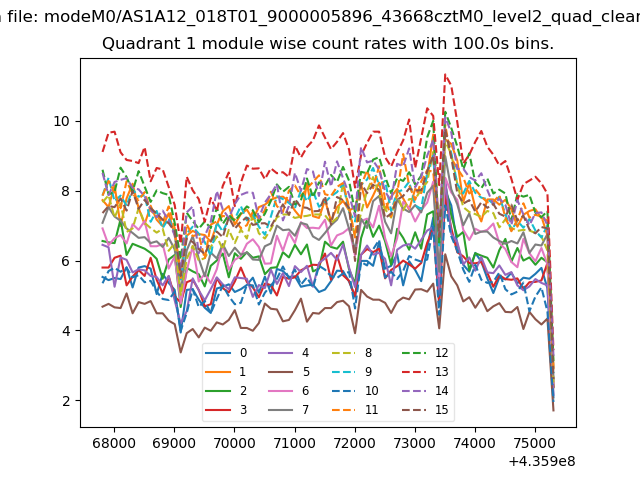
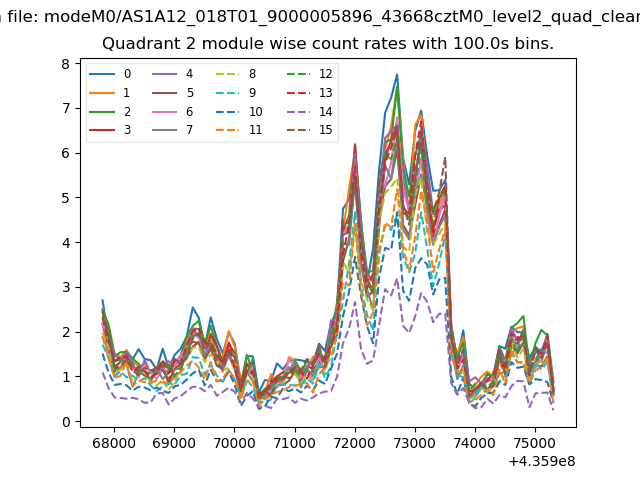
| Quadrant-wise count rates Data is divided into 100 sec bins |
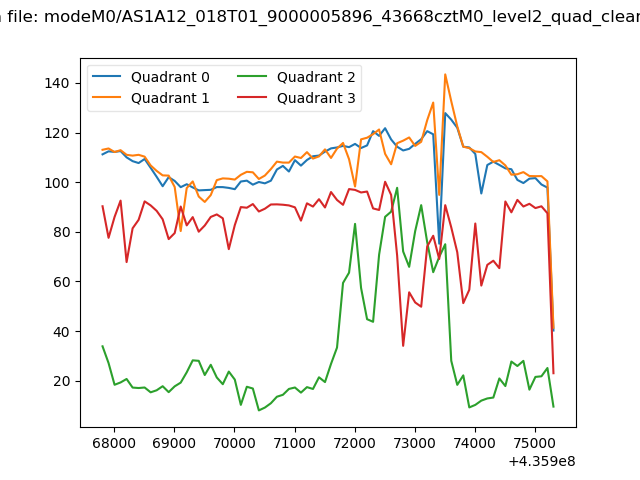 |
|
| Module-wise count rates for Quadrant A Data is divided into 100 sec bins |
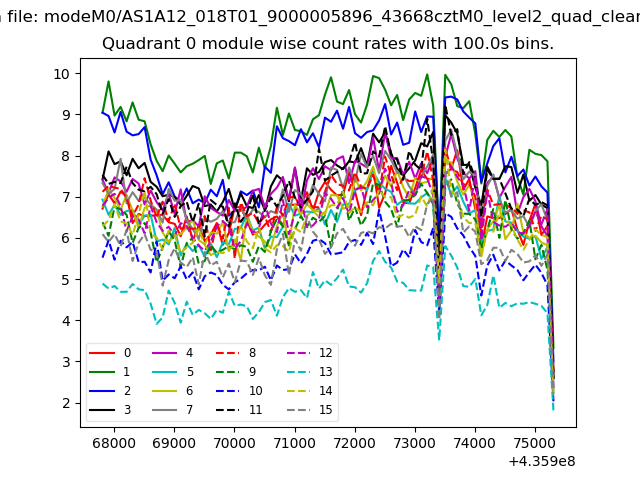 |
 |
| Module-wise count rates for Quadrant B Data is divided into 100 sec bins |
 |
 |
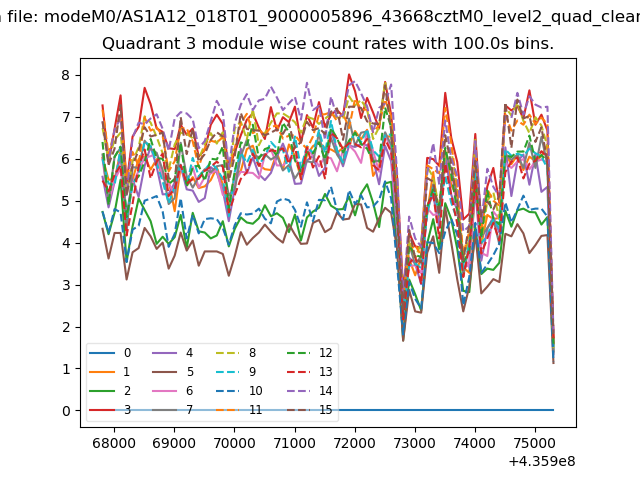
| Module-wise count rates for Quadrant C Data is divided into 100 sec bins |
 |
 |
| Module-wise count rates for Quadrant D Data is divided into 100 sec bins |
 |
 |
| Parameter | Plot |
|---|---|
| CZT HV Monitor | 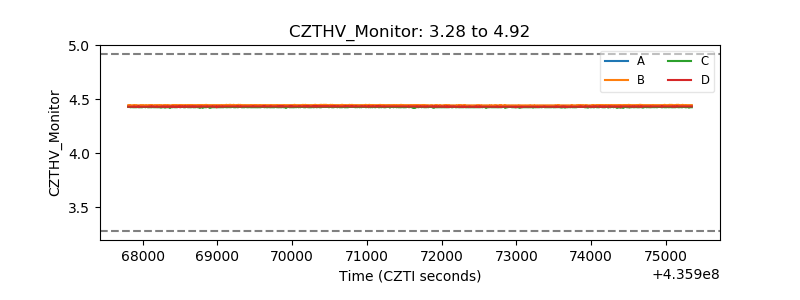 |
| D_VDD | 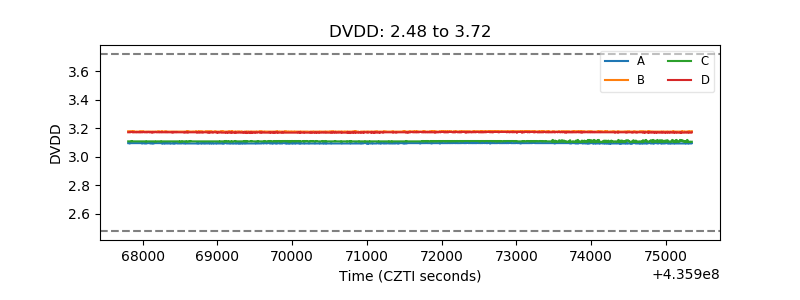 |
| Temperature 1 | 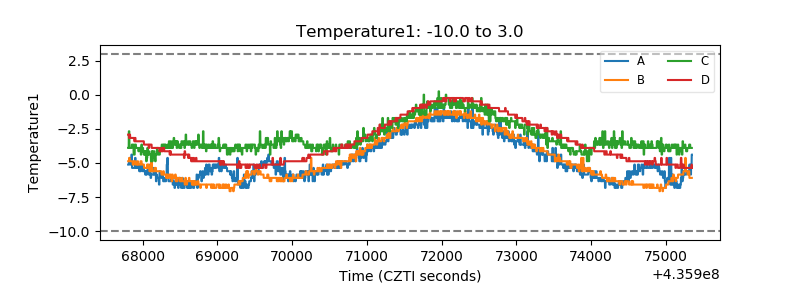 |
| Veto HV Monitor | 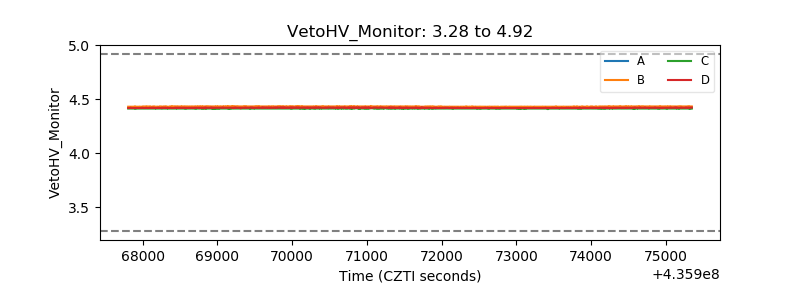 |
| Veto LLD | 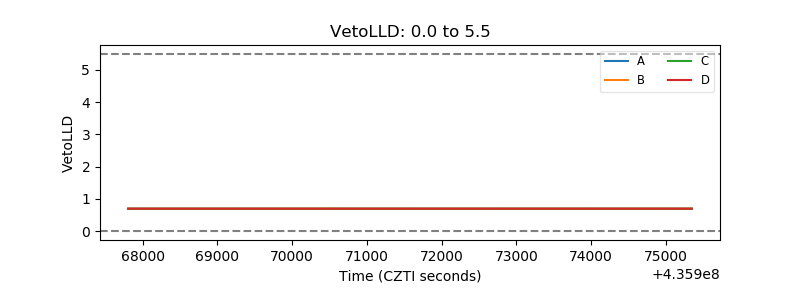 |
| Alpha Counter | 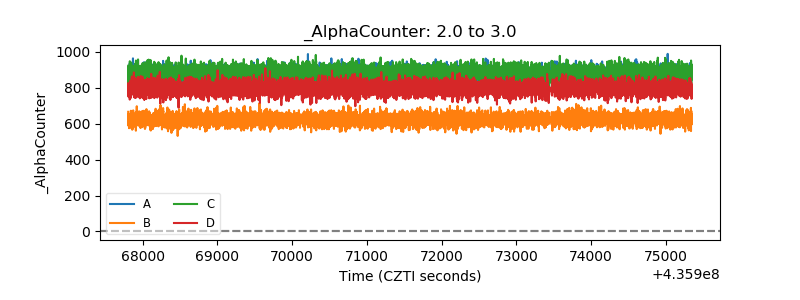 |
| _CPM_Rate | 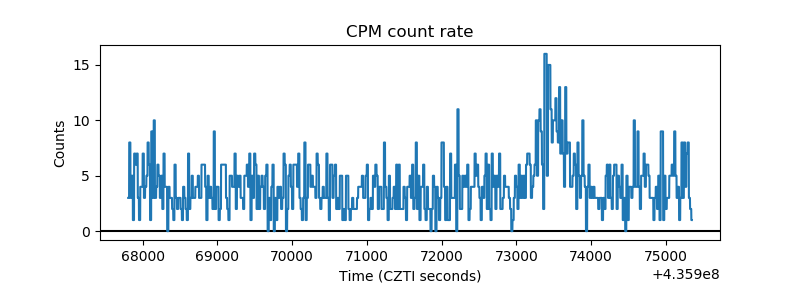 |
| CZT Counter | 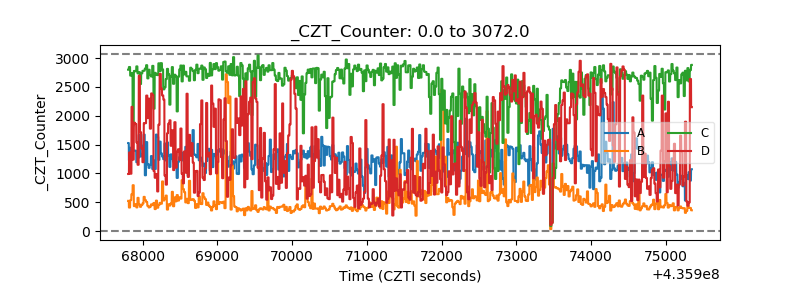 |
| +2.5 Volts monitor | 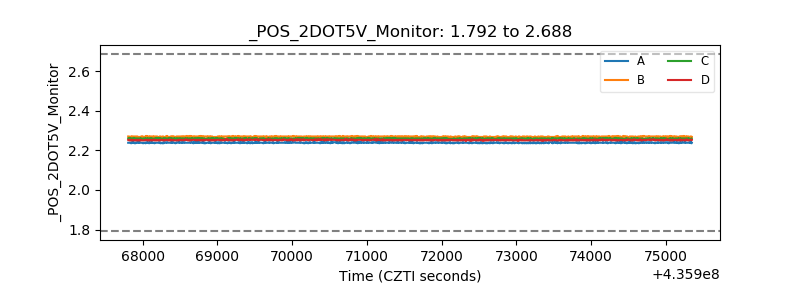 |
| +5 Volts monitor | 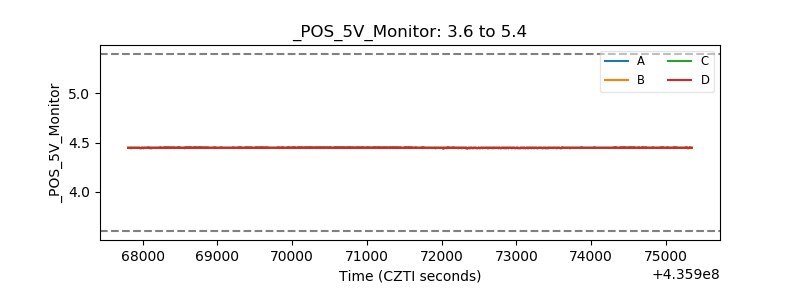 |
| _ROLL_ROT | 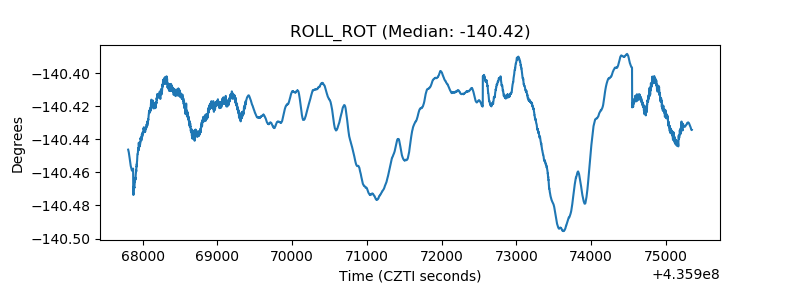 |
| _Roll_DEC | 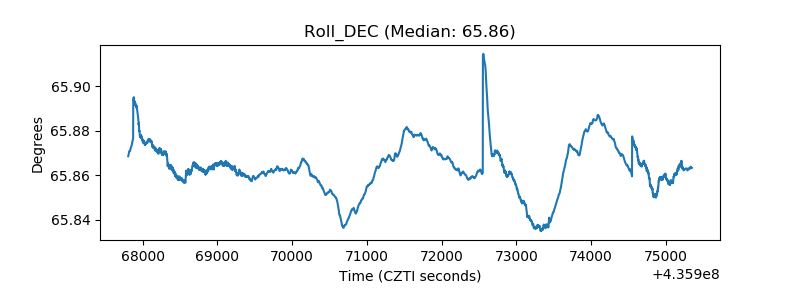 |
| _Roll_RA | 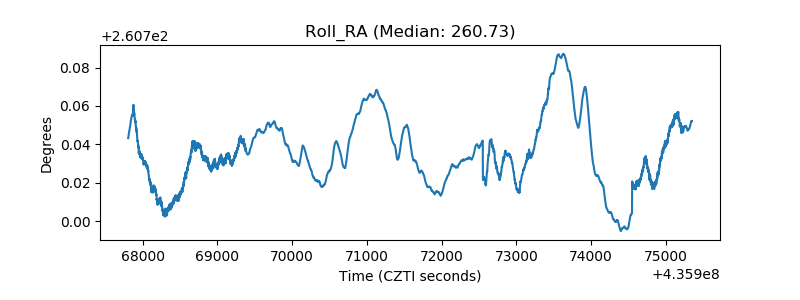 |
| Veto Counter | 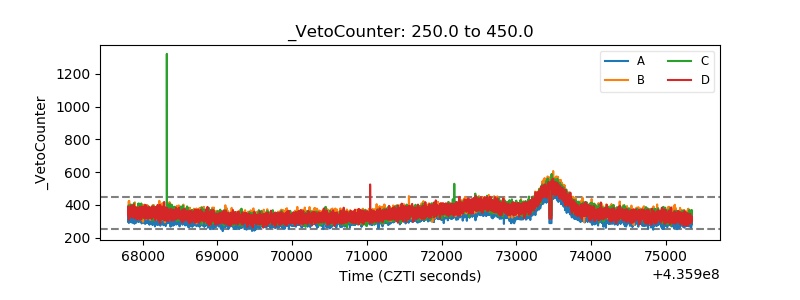 |