| Param | Original file | Final file |
|---|---|---|
| Filename | modeM0/AS1A12_018T01_9000005896_43671cztM0_level2.fits | modeM0/AS1A12_018T01_9000005896_43671cztM0_level2_quad_clean.evt |
| Size (bytes) | 2,757,536,640 | 213,143,040 |
| Size | 2.6 GB | 203.3 MB |
| Events in quadrant A | 22,002,676 | 1,850,006 |
| Events in quadrant B | 9,579,850 | 1,930,029 |
| Events in quadrant C | 42,930,058 | 370,234 |
| Events in quadrant D | 26,183,559 | 1,063,436 |
| Mode SS | |||
|---|---|---|---|
| Quadrant | BADHDUFLAG | Total packets | Discarded packets |
| A | 0 | 366 | 0 |
| B | 0 | 366 | 0 |
| C | 0 | 366 | 0 |
| D | 0 | 366 | 0 |
| Mode M0 | |||
|---|---|---|---|
| Quadrant | BADHDUFLAG | Total packets | Discarded packets |
| A | 0 | 78063 | 3 |
| B | 0 | 40821 | 3 |
| C | 0 | 139761 | 3 |
| D | 0 | 90245 | 4 |
| Mode M9 | |||
|---|---|---|---|
| Quadrant | BADHDUFLAG | Total packets | Discarded packets |
| A | 0 | 17 | 0 |
| B | 0 | 17 | 0 |
| C | 0 | 17 | 0 |
| D | 0 | 17 | 0 |
| Quadrant | Total seconds | Saturated seconds | Saturation percentage |
|---|---|---|---|
| A | 17960 | 909 | 5.061247% |
| B | 17961 | 279 | 1.553366% |
| C | 17961 | 15055 | 83.820500% |
| D | 17960 | 7031 | 39.148107% |
Noise dominated data is calculated using 1-second bins in cleaned event files. If a bin has >2000 counts, and if more than 50% of those come from <1% of pixels, then it is considered to be noise-dominated and hence unusable.
| Quadrant | # 1 sec bins | Bins with >0 counts | Bins with >2000 counts | High rate bins dominated by noise | Noise dominated (total time) | Noise dominated (detector-on time) | Marked lightcurve |
|---|---|---|---|---|---|---|---|
| A | 19710 | 17963 | 198 | 198 | 1.00% | 1.10% | 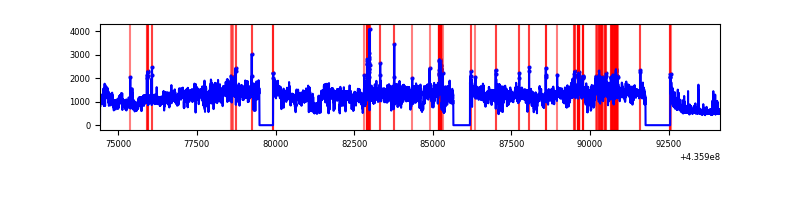 |
| B | 19711 | 17964 | 75 | 75 | 0.38% | 0.42% | 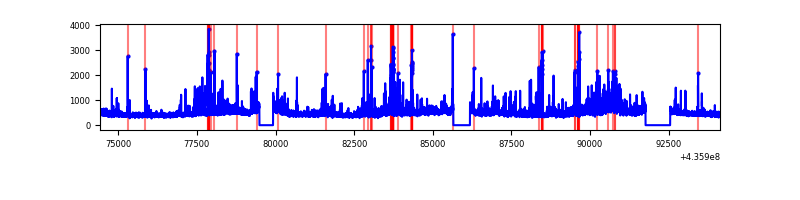 |
| C | 19711 | 17964 | 14109 | 14109 | 71.58% | 78.54% | 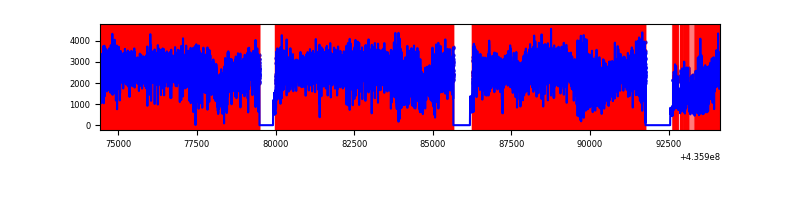 |
| D | 19710 | 17963 | 4984 | 4984 | 25.29% | 27.75% | 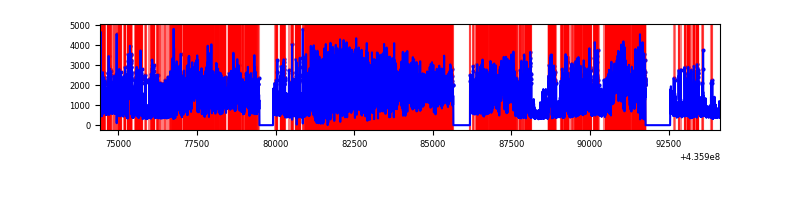 |
Top three noisy pixels from each quadrant. If the there are fewer than three noisy pixels in the level2.evt file, extra rows are filled as -1
| Pixel properties | Quadrant properties | ||||||
|---|---|---|---|---|---|---|---|
| Quadrant | DetID | PixID | Counts | Sigma | Mean | Median | Sigma |
| A | 15 | 222 | 11267323 | 28164.41 | 1952 | 1911 | 400.0 |
| A | 10 | 83 | 2297815 | 5739.94 | 1952 | 1911 | 400.0 |
| A | 15 | 223 | 333134 | 828.08 | 1952 | 1911 | 400.0 |
| B | 4 | 206 | 604525 | 1573.49 | 1977 | 1915 | 383.0 |
| B | 5 | 235 | 368010 | 955.92 | 1977 | 1915 | 383.0 |
| B | 0 | 230 | 200366 | 518.18 | 1977 | 1915 | 383.0 |
| C | 15 | 142 | 33695176 | 145516.84 | 986 | 990 | 231.5 |
| C | 15 | 157 | 2689055 | 11609.09 | 986 | 990 | 231.5 |
| C | 15 | 158 | 1600064 | 6906.0 | 986 | 990 | 231.5 |
| D | 14 | 225 | 6676727 | 16171.77 | 1582 | 1529 | 412.8 |
| D | 7 | 80 | 3014458 | 7299.32 | 1582 | 1529 | 412.8 |
| D | 12 | 6 | 1858694 | 4499.29 | 1582 | 1529 | 412.8 |
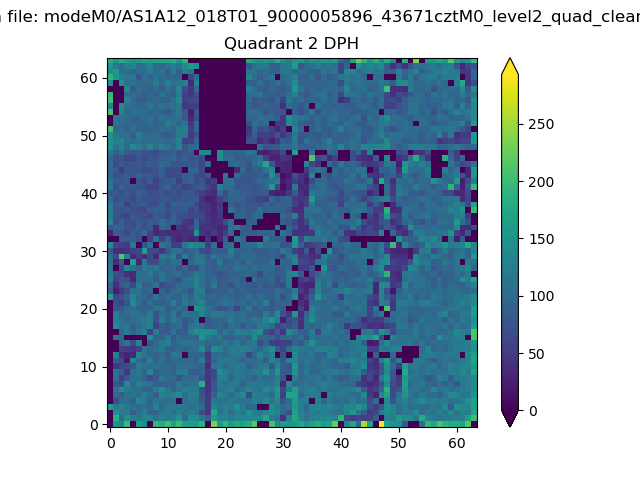
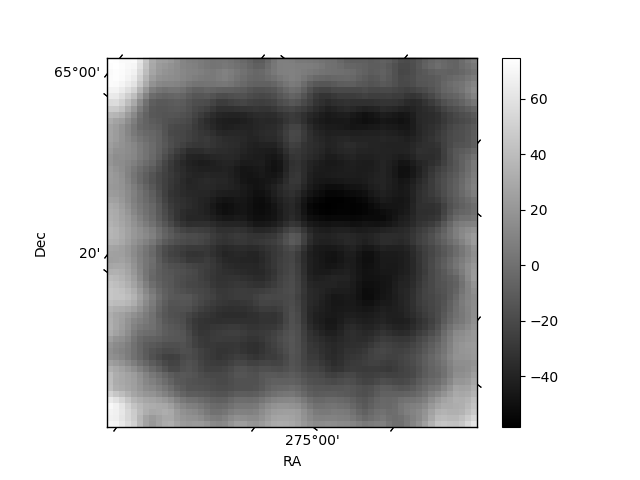
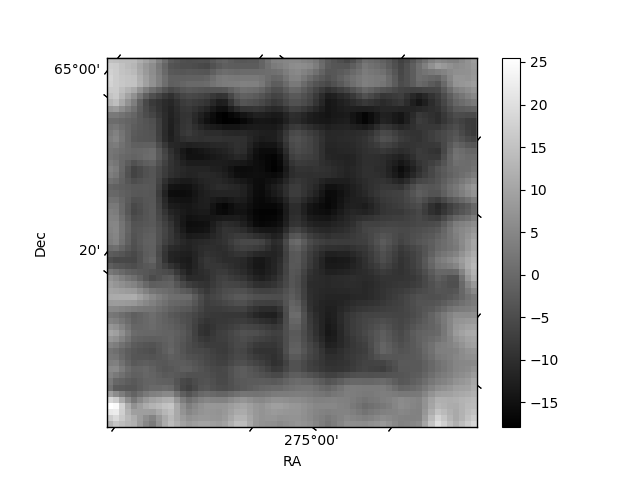
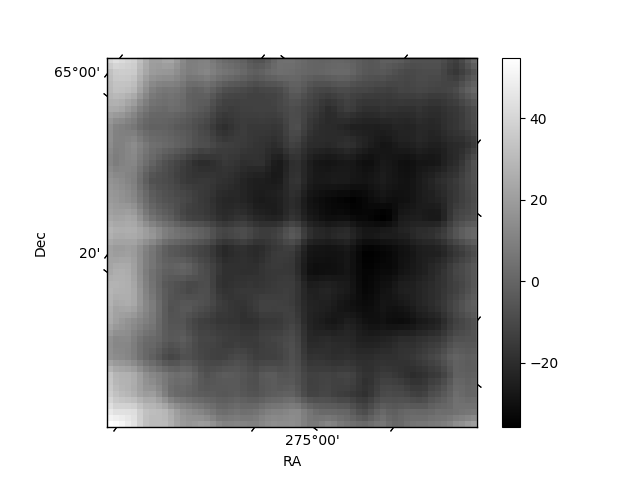
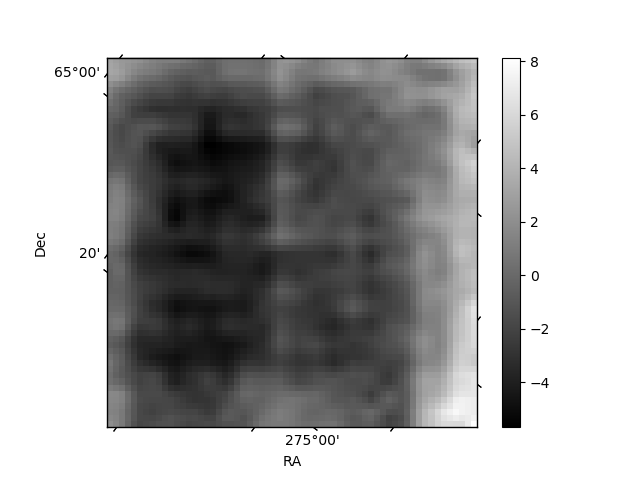
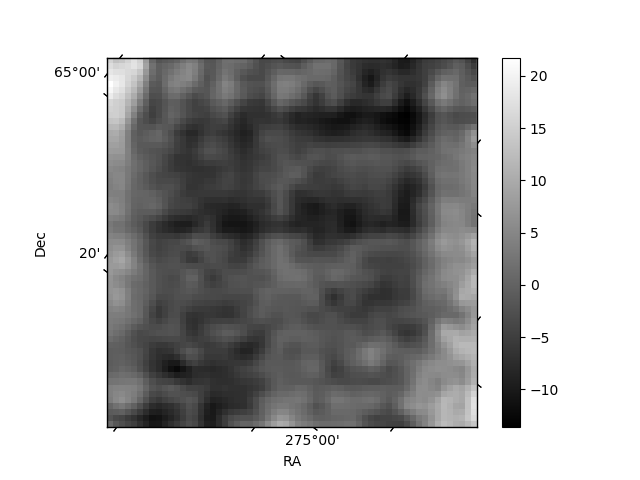
Histogram calculated using DETX and DETY for each event in the final _common_clean file
| Quadrant A | 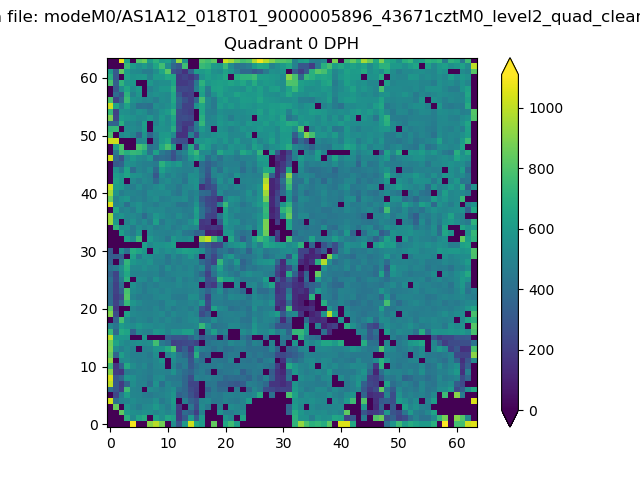 |
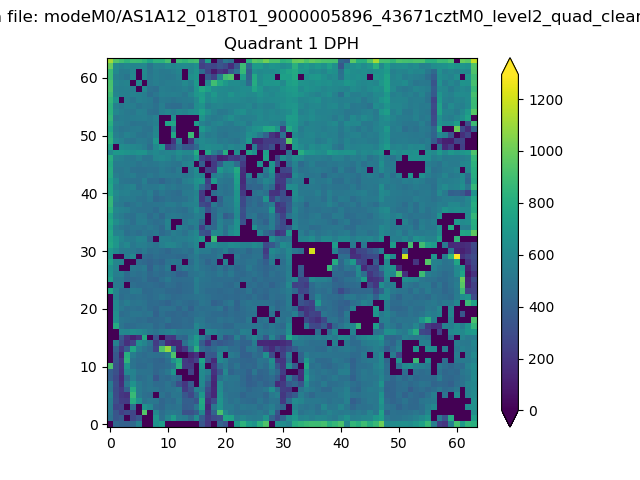 |
Quadrant B |
|---|---|---|---|
| Quadrant D | 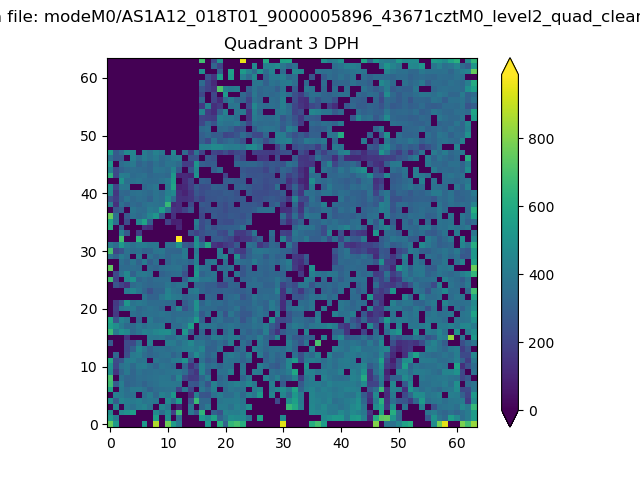 |
 |
Quadrant C |
| Plot type | Count rate plots | Images |
|---|---|---|
| Comparison with Poisson distribution Blue bars denote a histogram of data divided into 1 sec bins. Red curve is a Poisson curve with rate = median count rate of data. |
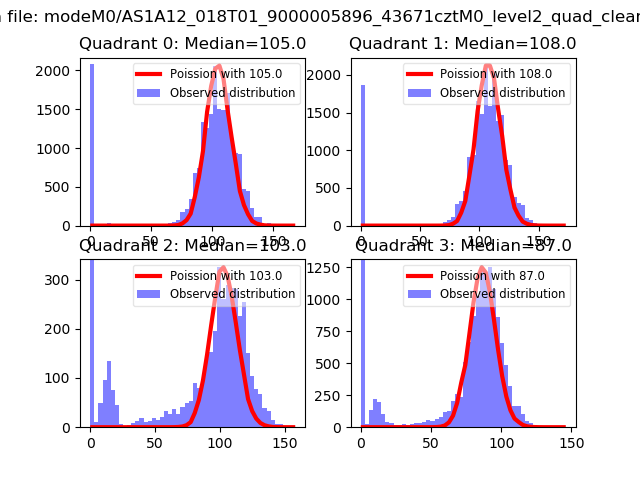 |
 |
| Quadrant-wise count rates Data is divided into 100 sec bins |
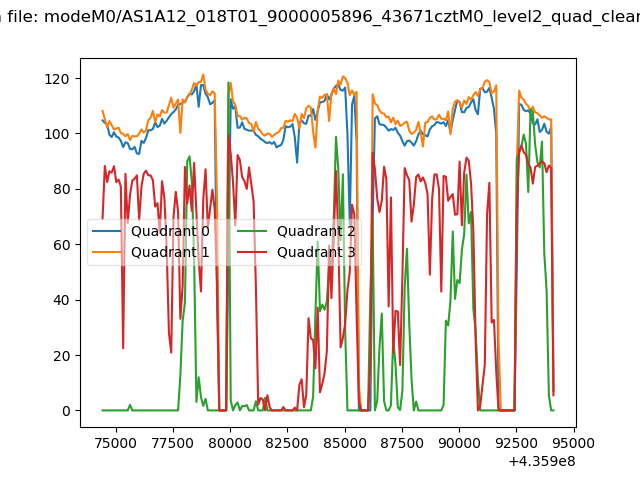 |
|
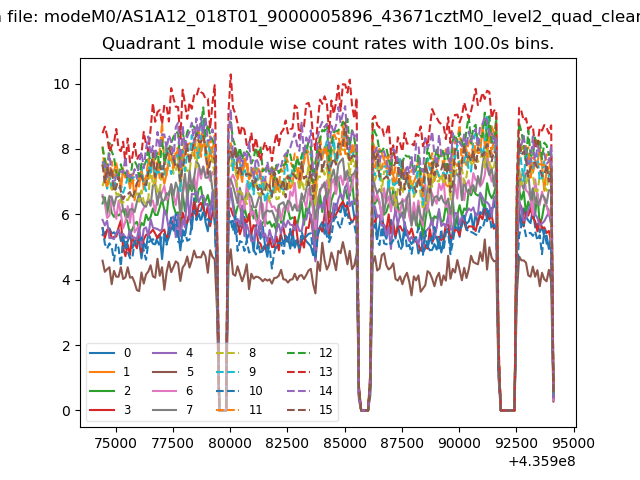
| Module-wise count rates for Quadrant A Data is divided into 100 sec bins |
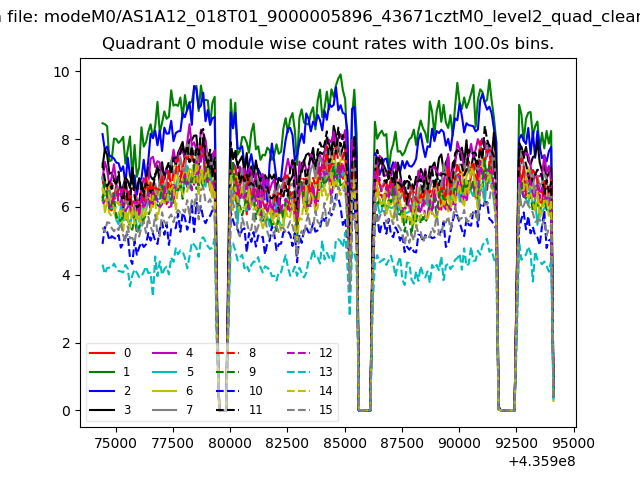 |
 |
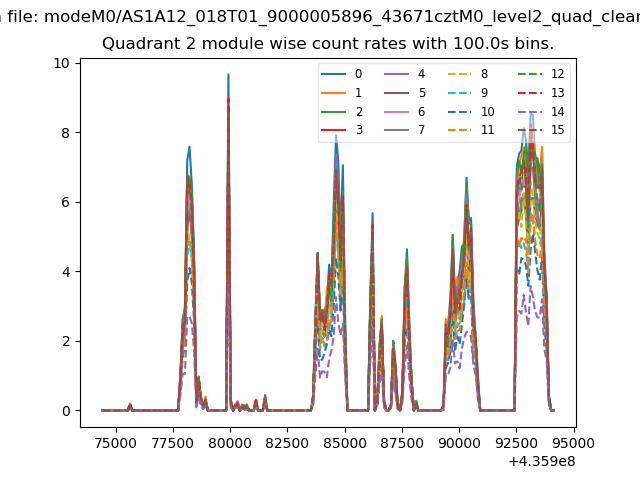
| Module-wise count rates for Quadrant B Data is divided into 100 sec bins |
 |
 |
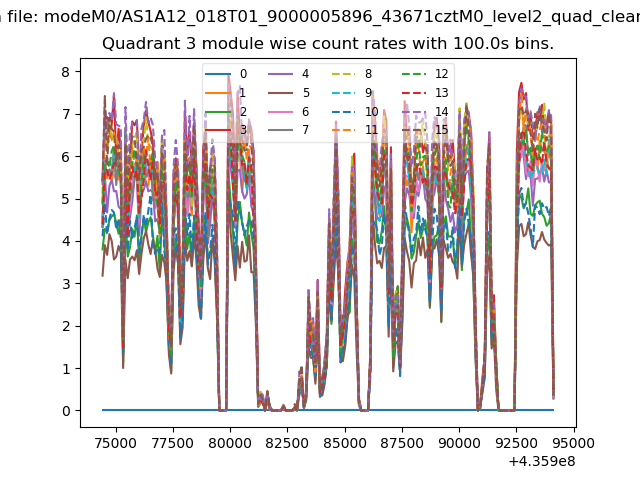
| Module-wise count rates for Quadrant C Data is divided into 100 sec bins |
 |
 |
| Module-wise count rates for Quadrant D Data is divided into 100 sec bins |
 |
 |
| Parameter | Plot |
|---|---|
| CZT HV Monitor | 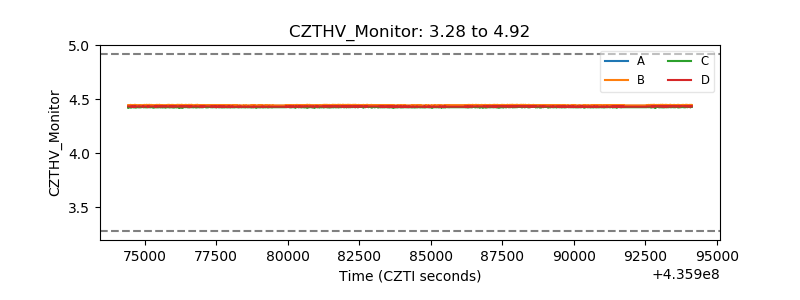 |
| D_VDD | 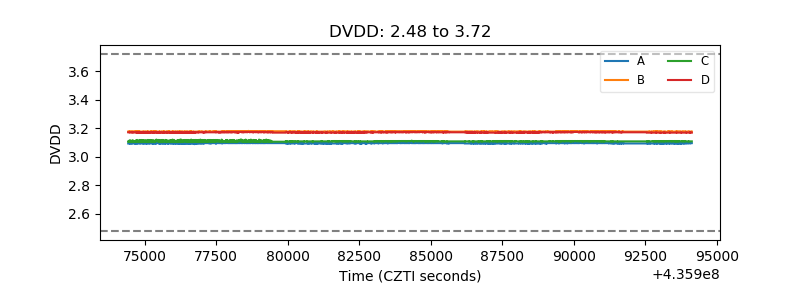 |
| Temperature 1 | 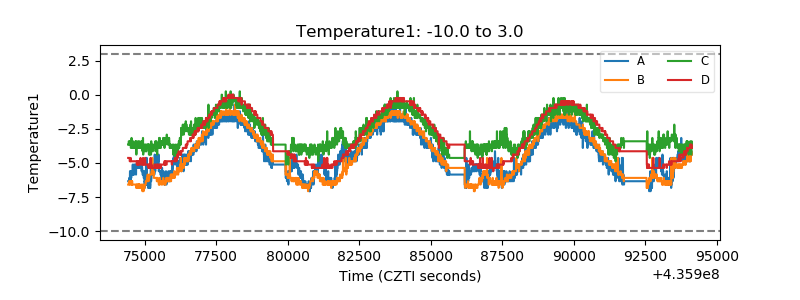 |
| Veto HV Monitor |  |
| Veto LLD | 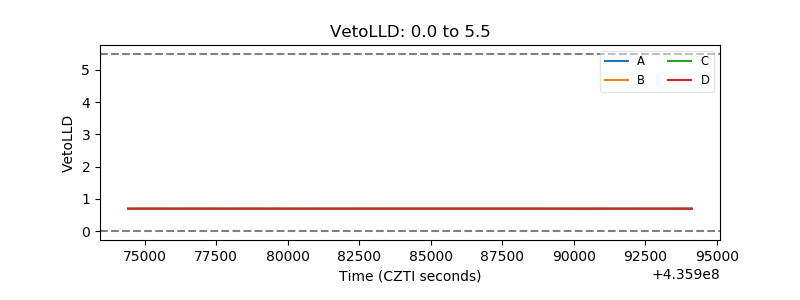 |
| Alpha Counter | 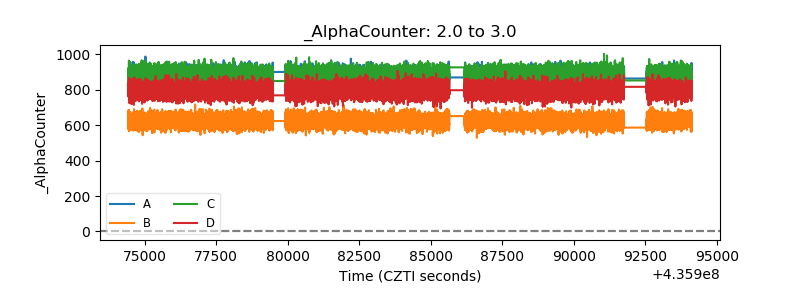 |
| _CPM_Rate | 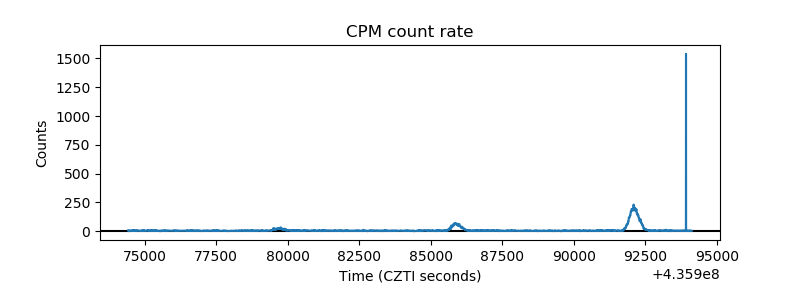 |
| CZT Counter | 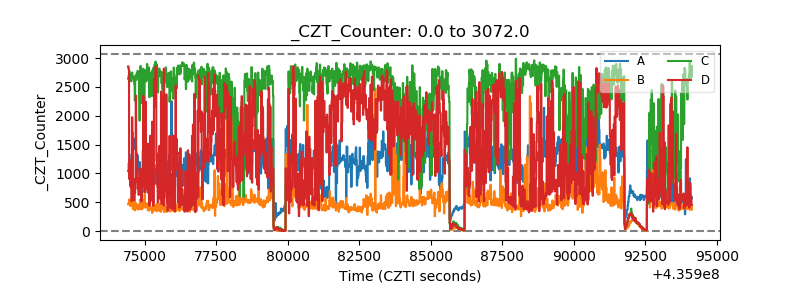 |
| +2.5 Volts monitor | 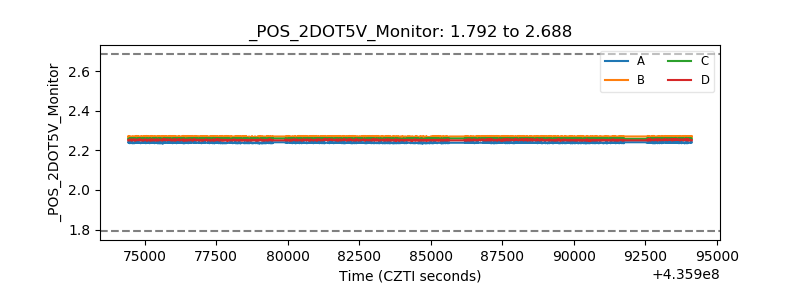 |
| +5 Volts monitor | 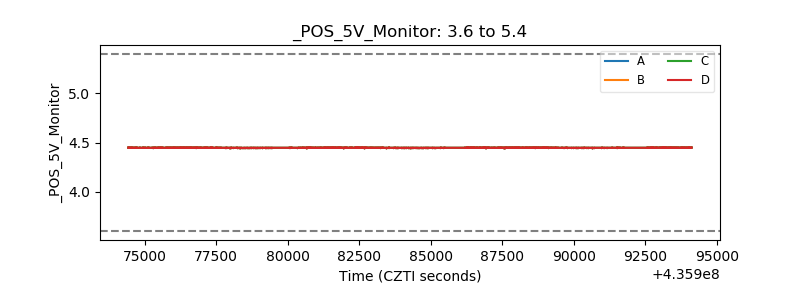 |
| _ROLL_ROT | 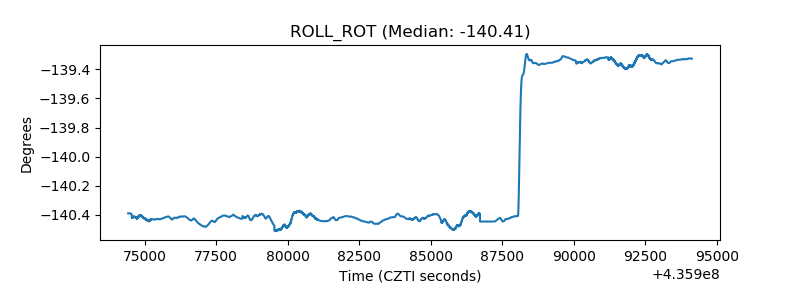 |
| _Roll_DEC | 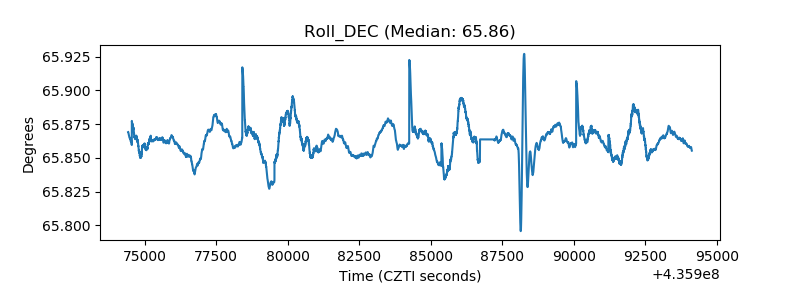 |
| _Roll_RA | 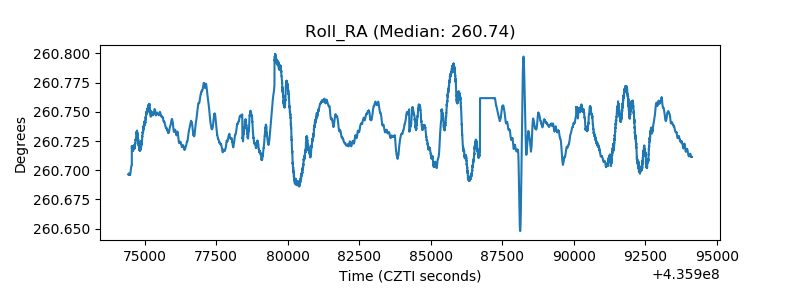 |
| Veto Counter | 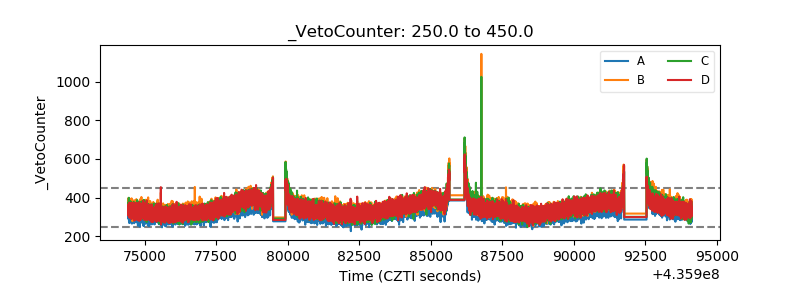 |