| Param | Original file | Final file |
|---|---|---|
| Filename | modeM0/AS1A12_018T01_9000005896_43672cztM0_level2.fits | modeM0/AS1A12_018T01_9000005896_43672cztM0_level2_quad_clean.evt |
| Size (bytes) | 815,630,400 | 90,889,920 |
| Size | 777.8 MB | 86.7 MB |
| Events in quadrant A | 4,853,711 | 677,459 |
| Events in quadrant B | 3,278,655 | 694,894 |
| Events in quadrant C | 12,709,910 | 420,918 |
| Events in quadrant D | 8,868,339 | 521,536 |
| Mode SS | |||
|---|---|---|---|
| Quadrant | BADHDUFLAG | Total packets | Discarded packets |
| A | 0 | 126 | 0 |
| B | 0 | 126 | 0 |
| C | 0 | 126 | 0 |
| D | 0 | 126 | 0 |
| Mode M0 | |||
|---|---|---|---|
| Quadrant | BADHDUFLAG | Total packets | Discarded packets |
| A | 0 | 18704 | 1 |
| B | 0 | 13852 | 1 |
| C | 0 | 42025 | 1 |
| D | 0 | 30618 | 1 |
| Mode M9 | |||
|---|---|---|---|
| Quadrant | BADHDUFLAG | Total packets | Discarded packets |
| A | 0 | 9 | 0 |
| B | 0 | 9 | 0 |
| C | 0 | 9 | 0 |
| D | 0 | 9 | 0 |
| Quadrant | Total seconds | Saturated seconds | Saturation percentage |
|---|---|---|---|
| A | 6225 | 131 | 2.104418% |
| B | 6226 | 90 | 1.445551% |
| C | 6225 | 3689 | 59.261044% |
| D | 6225 | 2046 | 32.867470% |
Noise dominated data is calculated using 1-second bins in cleaned event files. If a bin has >2000 counts, and if more than 50% of those come from <1% of pixels, then it is considered to be noise-dominated and hence unusable.
| Quadrant | # 1 sec bins | Bins with >0 counts | Bins with >2000 counts | High rate bins dominated by noise | Noise dominated (total time) | Noise dominated (detector-on time) | Marked lightcurve |
|---|---|---|---|---|---|---|---|
| A | 7120 | 6226 | 13 | 13 | 0.18% | 0.21% | 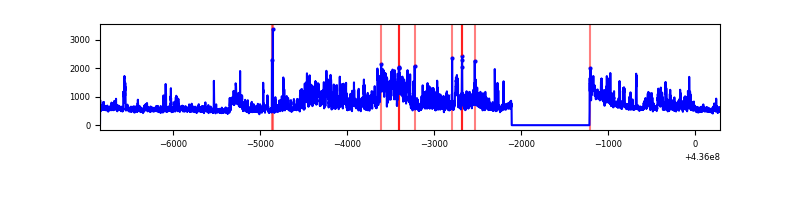 |
| B | 7121 | 6227 | 22 | 22 | 0.31% | 0.35% | 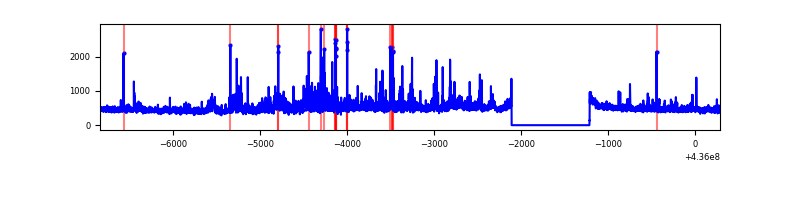 |
| C | 7120 | 6226 | 3479 | 3479 | 48.86% | 55.88% | 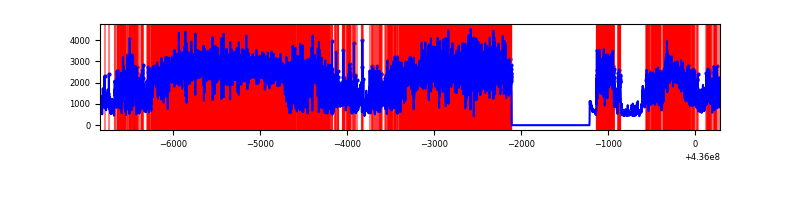 |
| D | 7120 | 6226 | 1666 | 1666 | 23.40% | 26.76% | 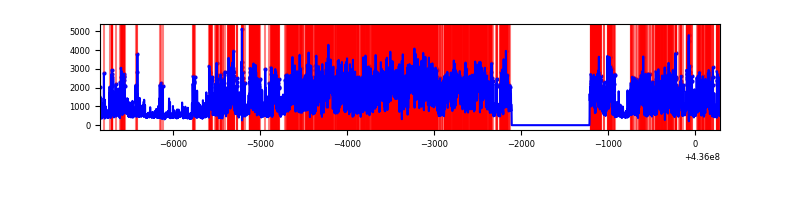 |
Top three noisy pixels from each quadrant. If the there are fewer than three noisy pixels in the level2.evt file, extra rows are filled as -1
| Pixel properties | Quadrant properties | ||||||
|---|---|---|---|---|---|---|---|
| Quadrant | DetID | PixID | Counts | Sigma | Mean | Median | Sigma |
| A | 15 | 222 | 1227524 | 8530.82 | 690 | 677 | 143.8 |
| A | 10 | 83 | 827833 | 5751.59 | 690 | 677 | 143.8 |
| A | 15 | 223 | 19833 | 133.2 | 690 | 677 | 143.8 |
| B | 4 | 206 | 201202 | 1485.34 | 691 | 671 | 135.0 |
| B | 5 | 235 | 119269 | 878.46 | 691 | 671 | 135.0 |
| B | 15 | 35 | 73339 | 538.25 | 691 | 671 | 135.0 |
| C | 15 | 142 | 8710387 | 83114.63 | 445 | 446 | 104.8 |
| C | 15 | 157 | 1255703 | 11978.29 | 445 | 446 | 104.8 |
| C | 15 | 158 | 810962 | 7734.35 | 445 | 446 | 104.8 |
| D | 12 | 6 | 2037260 | 13314.28 | 588 | 568 | 153.0 |
| D | 14 | 225 | 1375643 | 8989.15 | 588 | 568 | 153.0 |
| D | 1 | 52 | 581735 | 3799.21 | 588 | 568 | 153.0 |
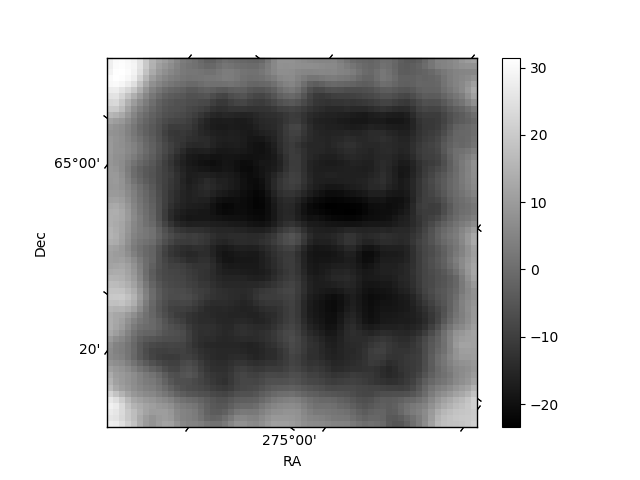
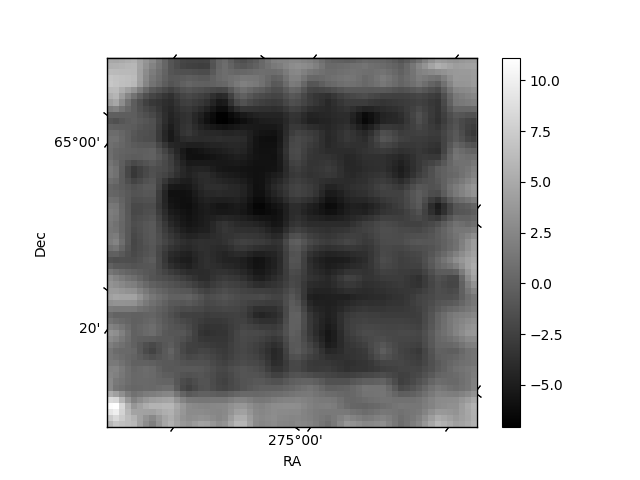
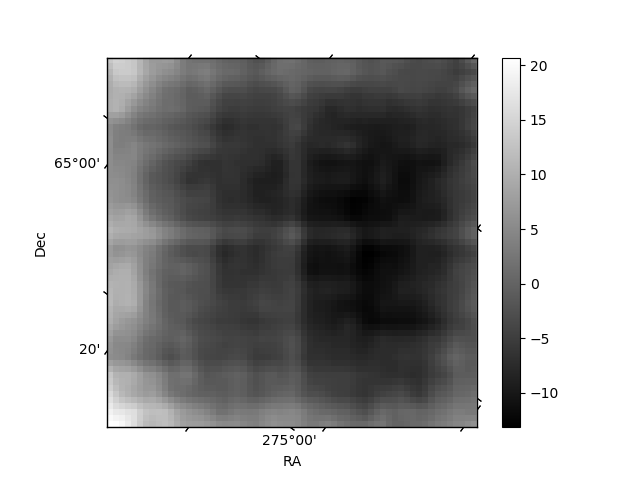
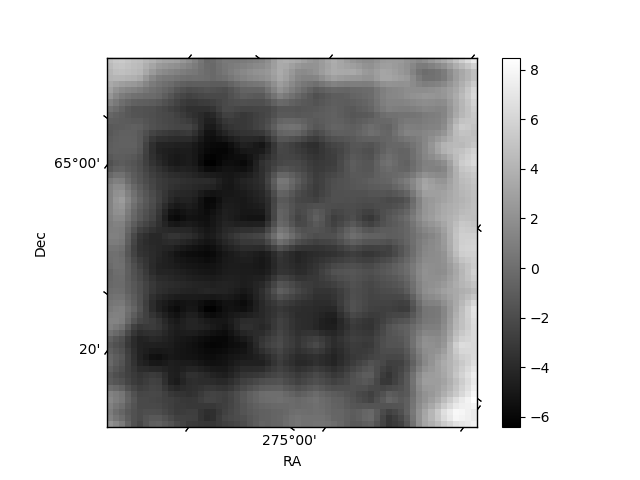
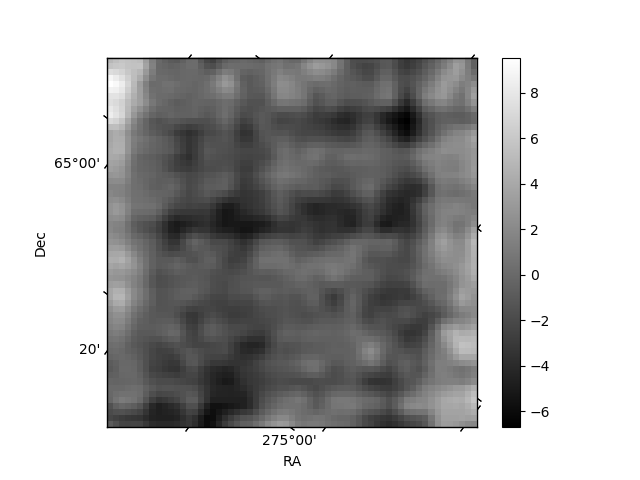
Histogram calculated using DETX and DETY for each event in the final _common_clean file
| Quadrant A | 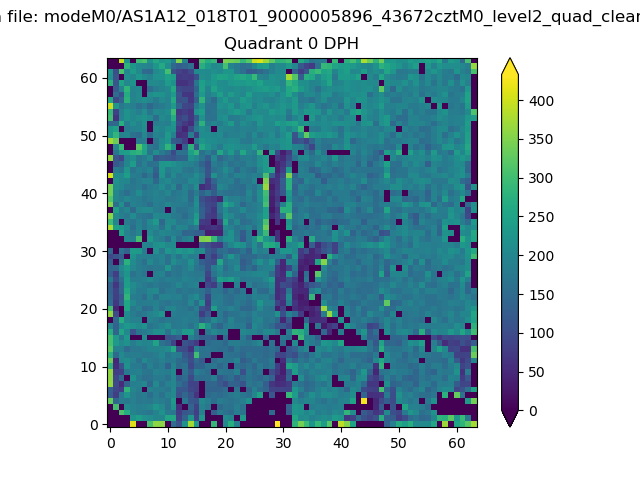 |
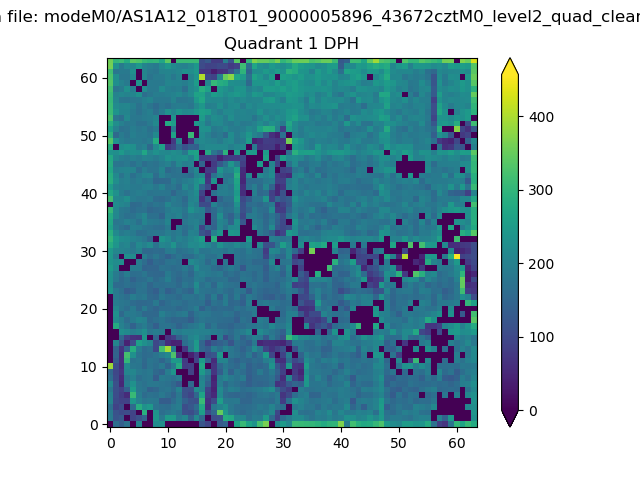 |
Quadrant B |
|---|---|---|---|
| Quadrant D | 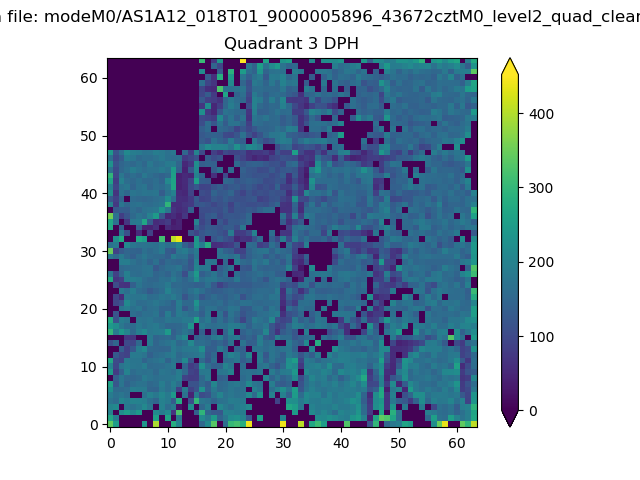 |
 |
Quadrant C |
| Plot type | Count rate plots | Images |
|---|---|---|
| Comparison with Poisson distribution Blue bars denote a histogram of data divided into 1 sec bins. Red curve is a Poisson curve with rate = median count rate of data. |
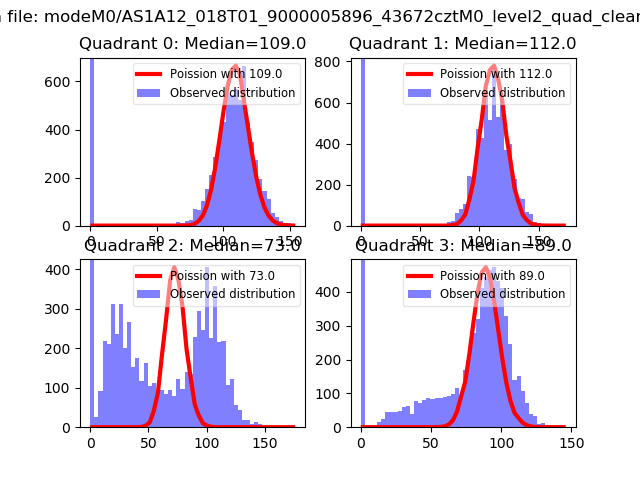 |
 |
| Quadrant-wise count rates Data is divided into 100 sec bins |
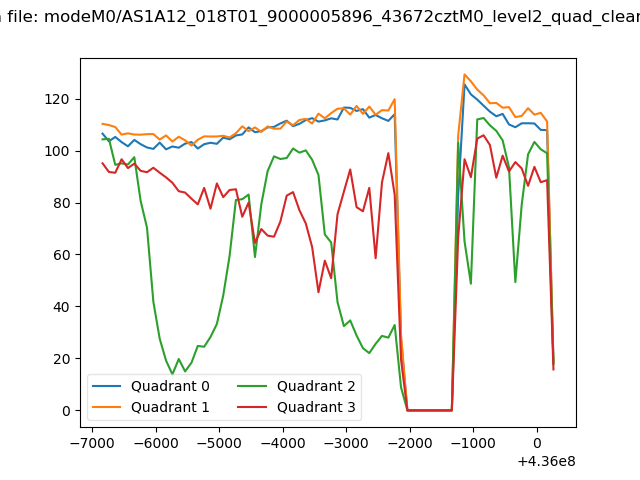 |
|
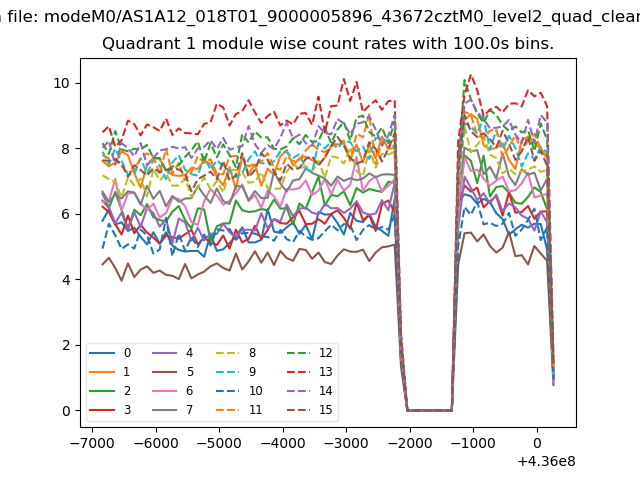
| Module-wise count rates for Quadrant A Data is divided into 100 sec bins |
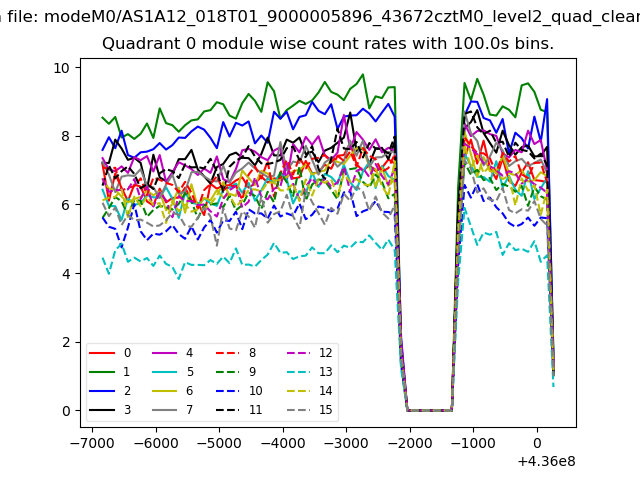 |
 |
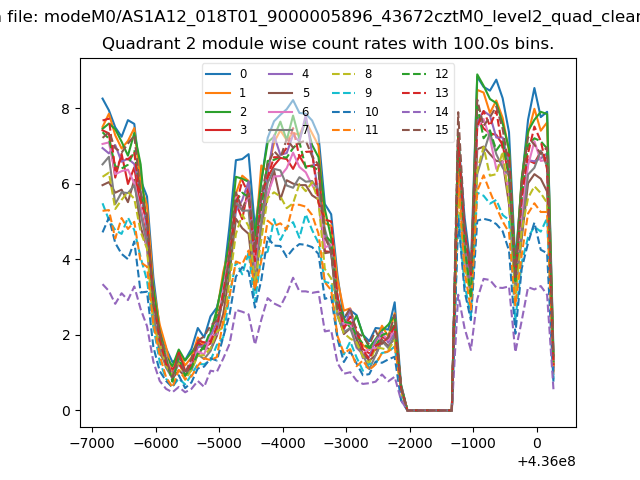
| Module-wise count rates for Quadrant B Data is divided into 100 sec bins |
 |
 |
| Module-wise count rates for Quadrant C Data is divided into 100 sec bins |
 |
 |
| Module-wise count rates for Quadrant D Data is divided into 100 sec bins |
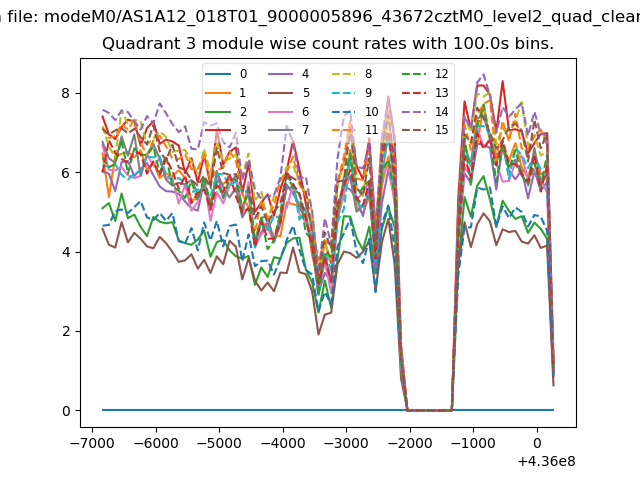 |
 |
| Parameter | Plot |
|---|---|
| CZT HV Monitor | 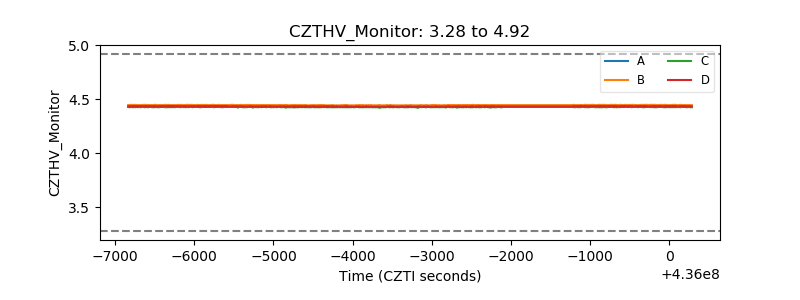 |
| D_VDD | 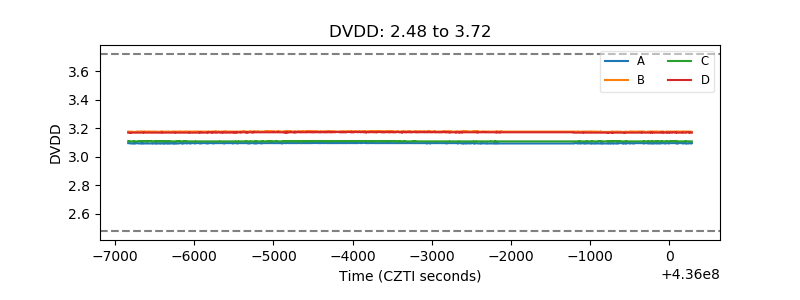 |
| Temperature 1 | 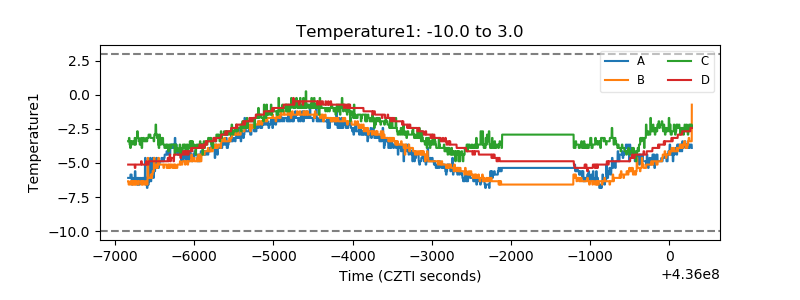 |
| Veto HV Monitor | 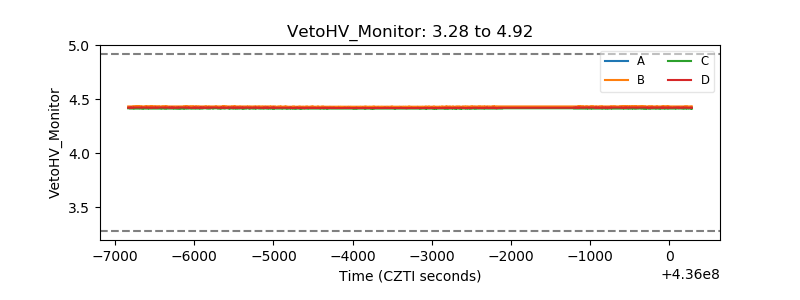 |
| Veto LLD | 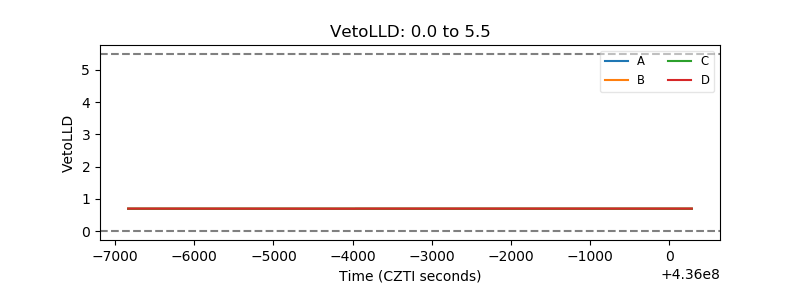 |
| Alpha Counter | 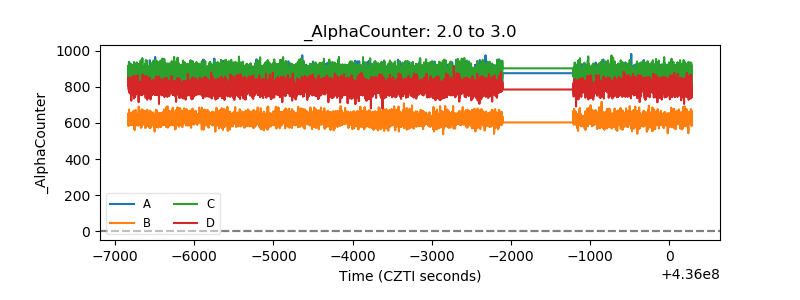 |
| _CPM_Rate | 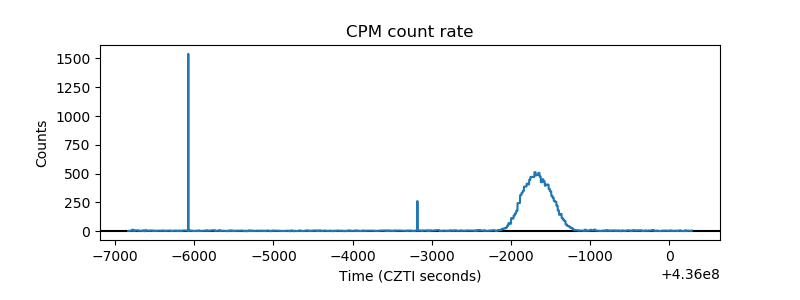 |
| CZT Counter | 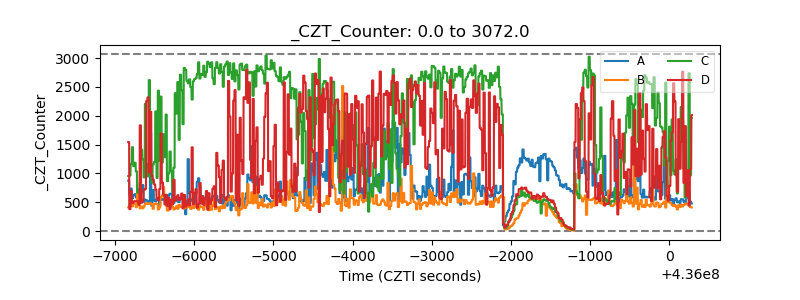 |
| +2.5 Volts monitor | 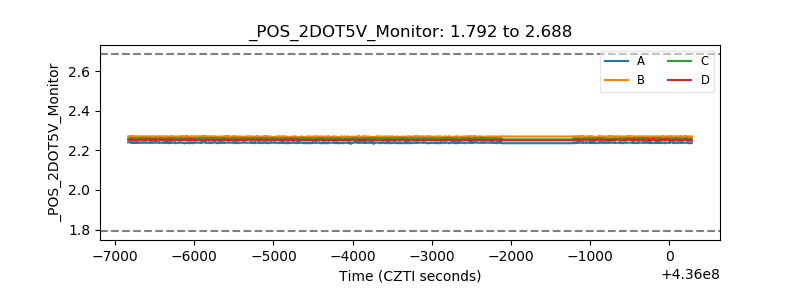 |
| +5 Volts monitor | 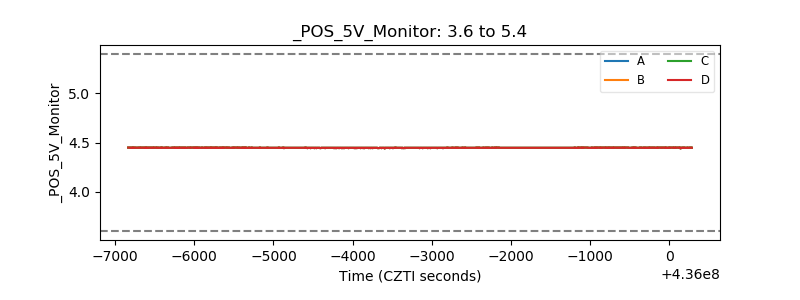 |
| _ROLL_ROT | 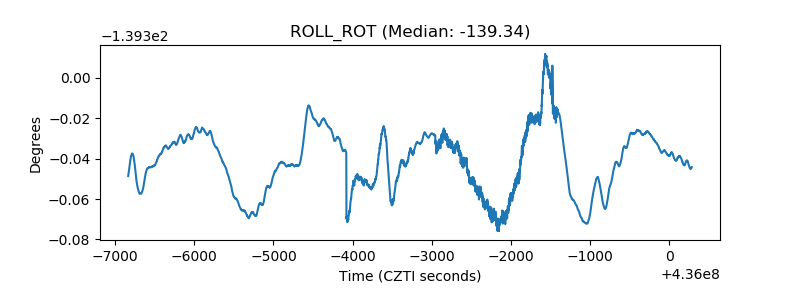 |
| _Roll_DEC | 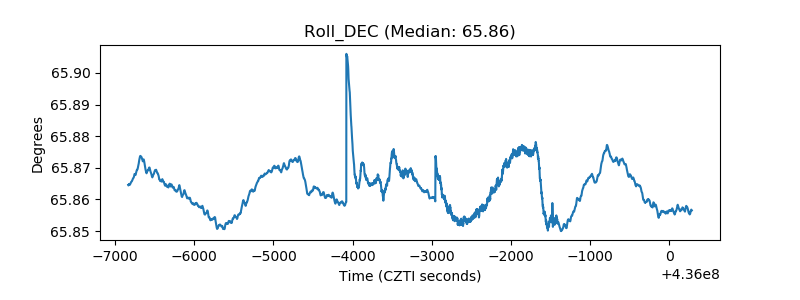 |
| _Roll_RA | 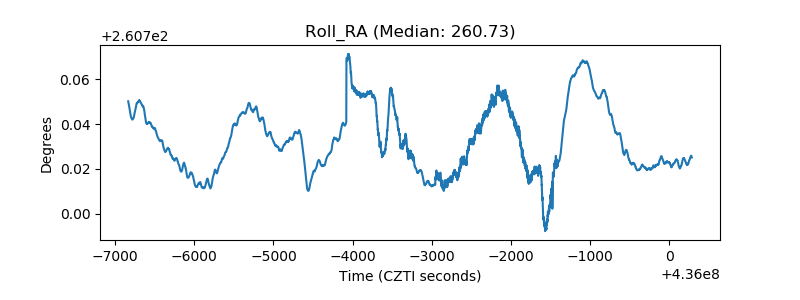 |
| Veto Counter | 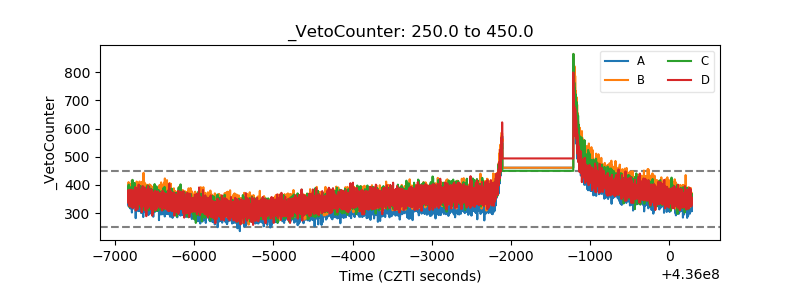 |