| Param | Original file | Final file |
|---|---|---|
| Filename | modeM0/AS1A12_018T01_9000005896_43674cztM0_level2.fits | modeM0/AS1A12_018T01_9000005896_43674cztM0_level2_quad_clean.evt |
| Size (bytes) | 176,045,760 | 24,863,040 |
| Size | 167.9 MB | 23.7 MB |
| Events in quadrant A | 2,108,635 | 172,749 |
| Events in quadrant B | 780,114 | 182,439 |
| Events in quadrant C | 2,469,424 | 140,527 |
| Events in quadrant D | 1,048,090 | 153,025 |
| Mode SS | |||
|---|---|---|---|
| Quadrant | BADHDUFLAG | Total packets | Discarded packets |
| A | 0 | 28 | 0 |
| B | 0 | 28 | 0 |
| C | 0 | 28 | 0 |
| D | 0 | 28 | 0 |
| Mode M0 | |||
|---|---|---|---|
| Quadrant | BADHDUFLAG | Total packets | Discarded packets |
| A | 0 | 7255 | 1 |
| B | 0 | 3180 | 1 |
| C | 0 | 8325 | 1 |
| D | 0 | 4060 | 1 |
| Mode M9 | |||
|---|---|---|---|
| Quadrant | BADHDUFLAG | Total packets | Discarded packets |
| A | 0 | 8 | 0 |
| B | 0 | 8 | 0 |
| C | 0 | 8 | 0 |
| D | 0 | 8 | 0 |
| Quadrant | Total seconds | Saturated seconds | Saturation percentage |
|---|---|---|---|
| A | 1393 | 218 | 15.649677% |
| B | 1393 | 22 | 1.579325% |
| C | 1393 | 636 | 45.656856% |
| D | 1393 | 78 | 5.599426% |
Noise dominated data is calculated using 1-second bins in cleaned event files. If a bin has >2000 counts, and if more than 50% of those come from <1% of pixels, then it is considered to be noise-dominated and hence unusable.
| Quadrant | # 1 sec bins | Bins with >0 counts | Bins with >2000 counts | High rate bins dominated by noise | Noise dominated (total time) | Noise dominated (detector-on time) | Marked lightcurve |
|---|---|---|---|---|---|---|---|
| A | 1393 | 1393 | 40 | 40 | 2.87% | 2.87% | 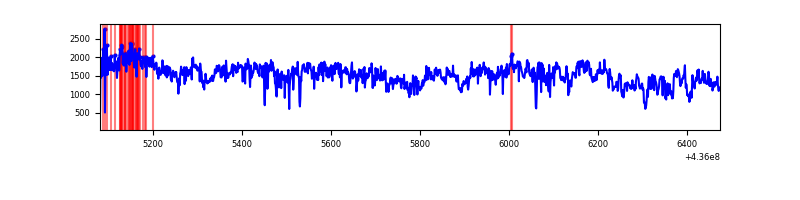 |
| B | 1393 | 1393 | 0 | 0 | 0.00% | 0.00% | 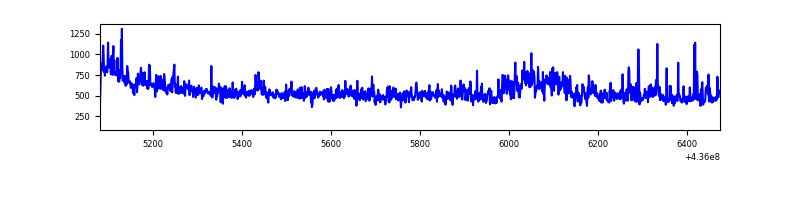 |
| C | 1393 | 1393 | 630 | 630 | 45.23% | 45.23% | 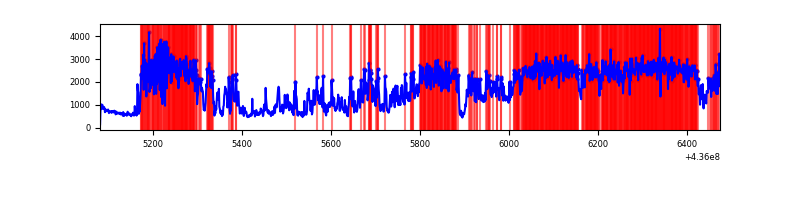 |
| D | 1393 | 1393 | 47 | 47 | 3.37% | 3.37% | 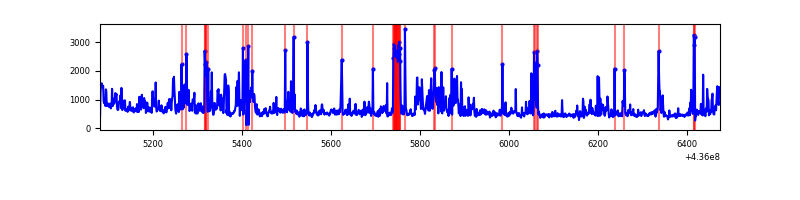 |
Top three noisy pixels from each quadrant. If the there are fewer than three noisy pixels in the level2.evt file, extra rows are filled as -1
| Pixel properties | Quadrant properties | ||||||
|---|---|---|---|---|---|---|---|
| Quadrant | DetID | PixID | Counts | Sigma | Mean | Median | Sigma |
| A | 15 | 222 | 1139443 | 31340.33 | 170 | 166 | 36.4 |
| A | 10 | 83 | 242986 | 6679.73 | 170 | 166 | 36.4 |
| A | 0 | 50 | 19287 | 526.0 | 170 | 166 | 36.4 |
| B | 0 | 230 | 28231 | 774.65 | 175 | 170 | 36.2 |
| B | 4 | 171 | 24129 | 661.41 | 175 | 170 | 36.2 |
| B | 4 | 206 | 20436 | 559.46 | 175 | 170 | 36.2 |
| C | 15 | 157 | 1009001 | 29680.51 | 138 | 138 | 34.0 |
| C | 15 | 142 | 873675 | 25699.25 | 138 | 138 | 34.0 |
| C | 15 | 173 | 14018 | 408.35 | 138 | 138 | 34.0 |
| D | 2 | 136 | 155120 | 3670.33 | 165 | 160 | 42.2 |
| D | 13 | 249 | 67613 | 1597.67 | 165 | 160 | 42.2 |
| D | 14 | 226 | 44667 | 1054.18 | 165 | 160 | 42.2 |
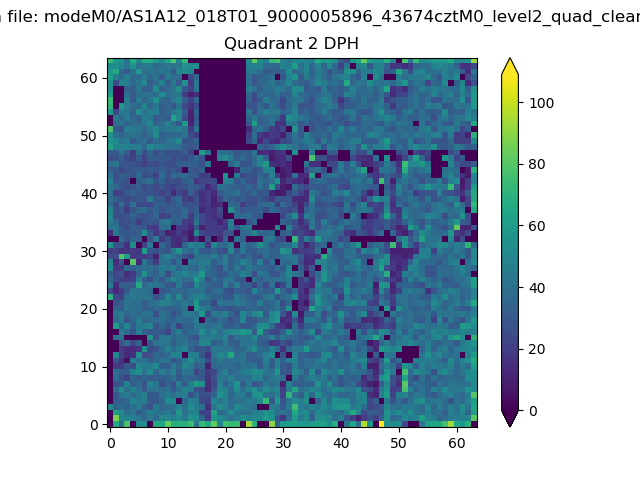
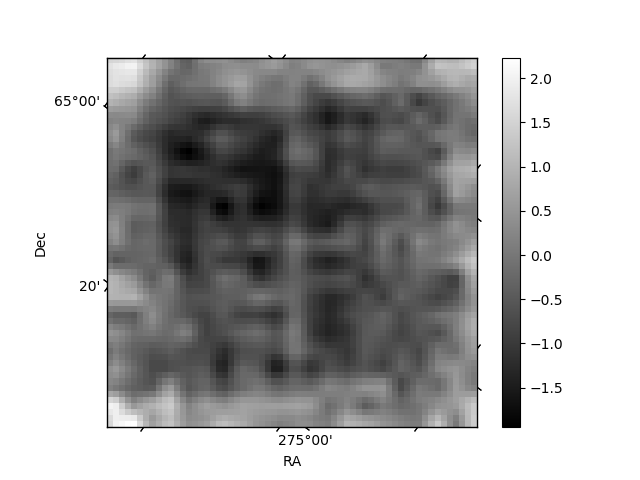
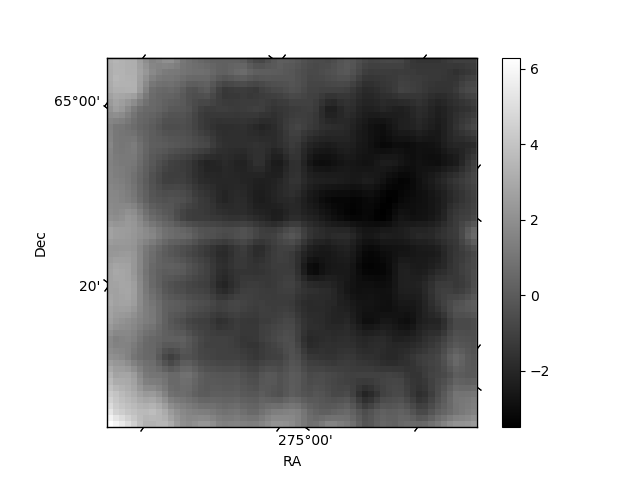
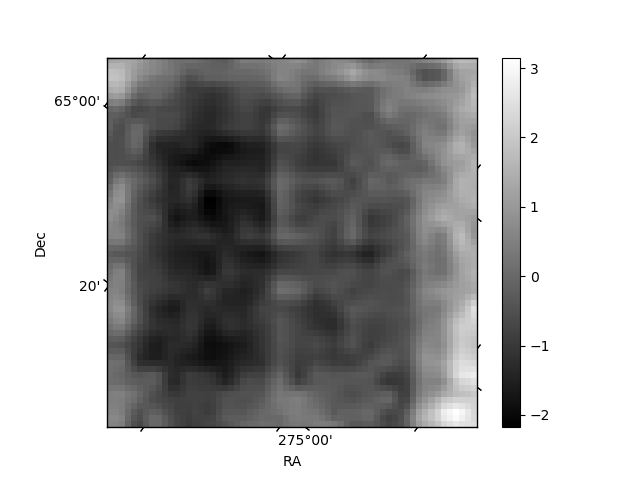
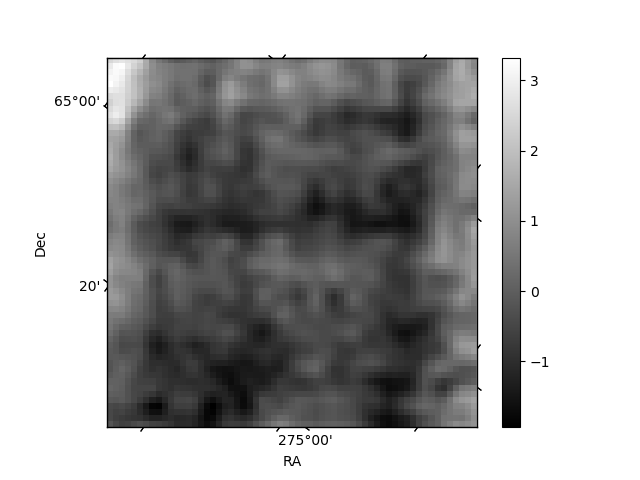
Histogram calculated using DETX and DETY for each event in the final _common_clean file
| Quadrant A | 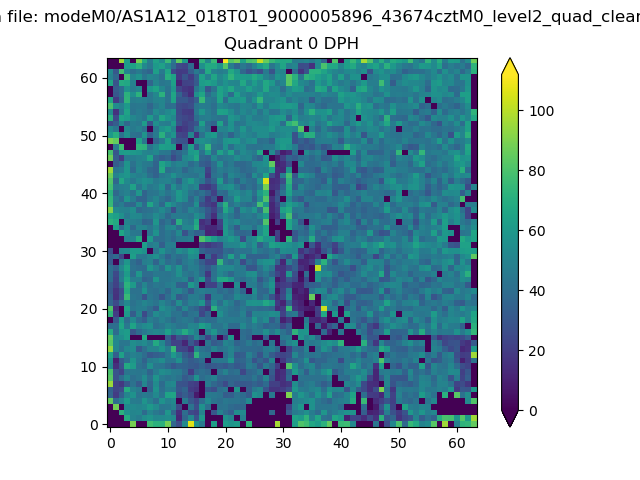 |
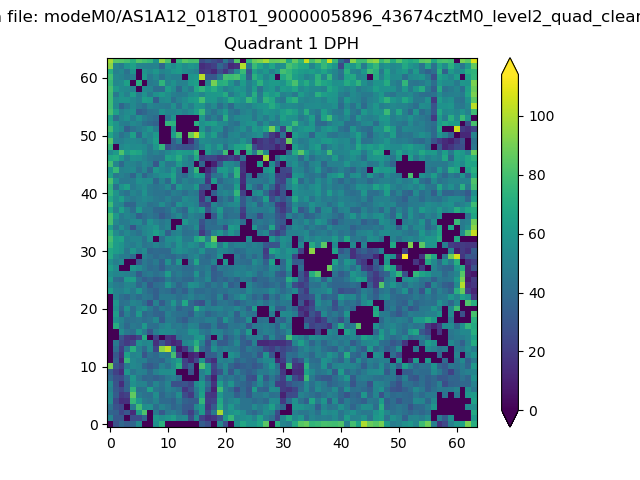 |
Quadrant B |
|---|---|---|---|
| Quadrant D | 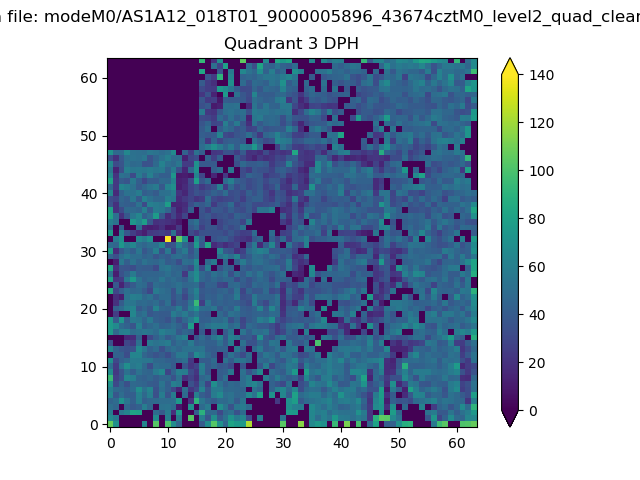 |
 |
Quadrant C |
| Plot type | Count rate plots | Images |
|---|---|---|
| Comparison with Poisson distribution Blue bars denote a histogram of data divided into 1 sec bins. Red curve is a Poisson curve with rate = median count rate of data. |
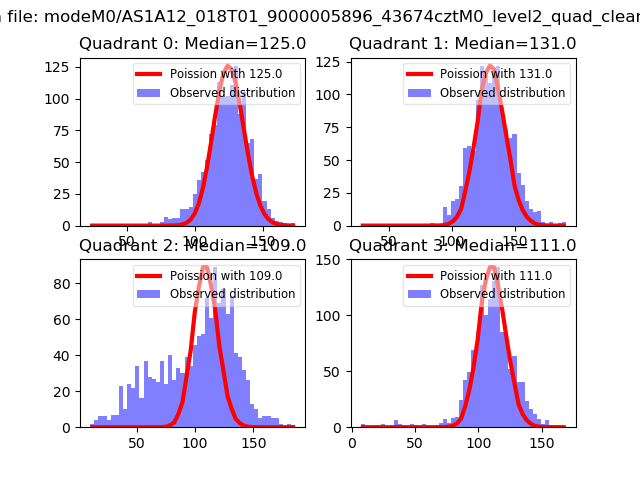 |
 |
| Quadrant-wise count rates Data is divided into 100 sec bins |
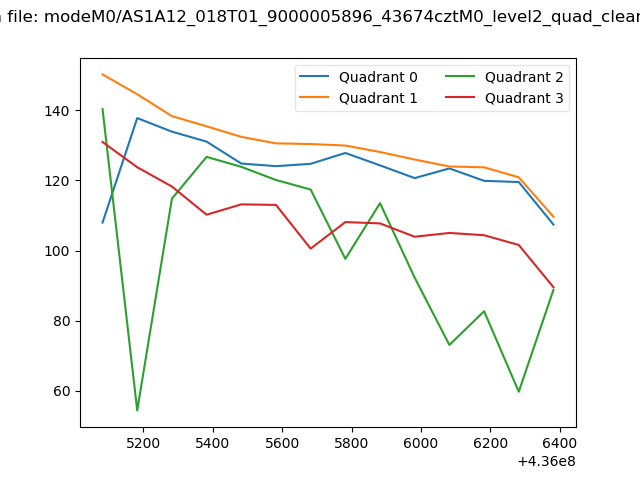 |
|
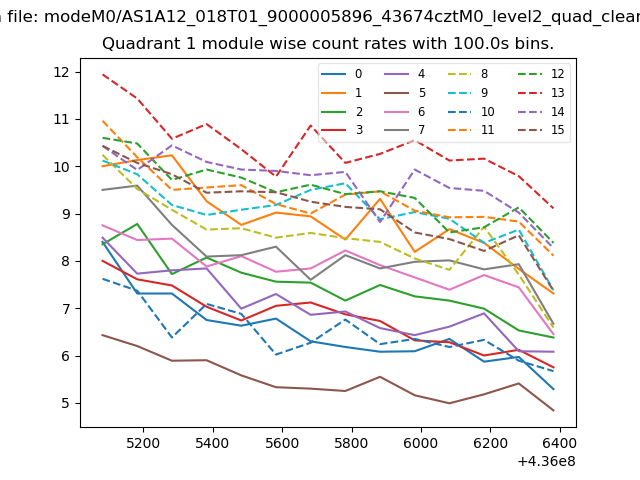
| Module-wise count rates for Quadrant A Data is divided into 100 sec bins |
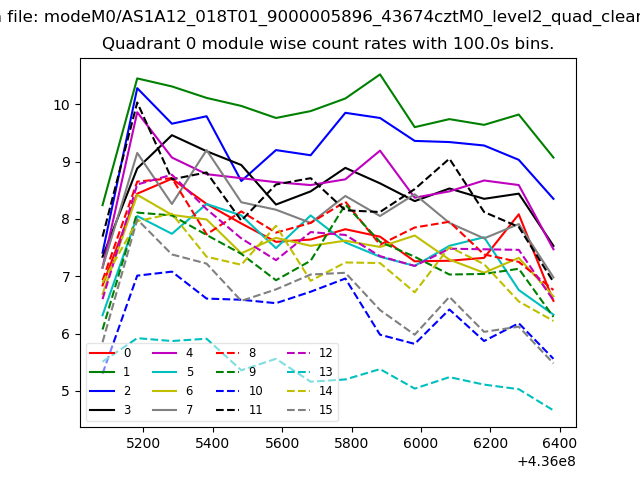 |
 |
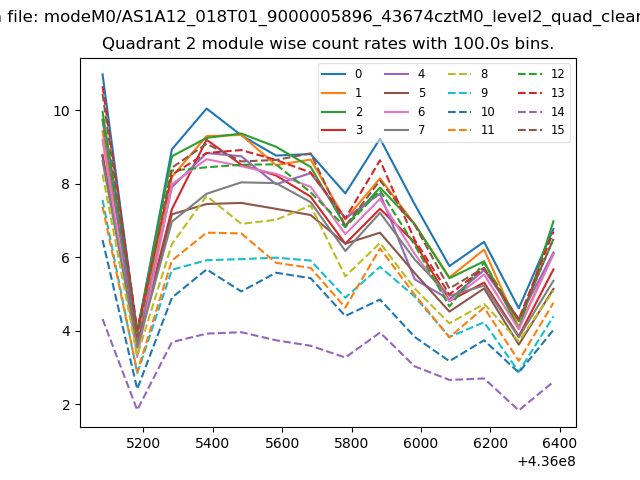
| Module-wise count rates for Quadrant B Data is divided into 100 sec bins |
 |
 |
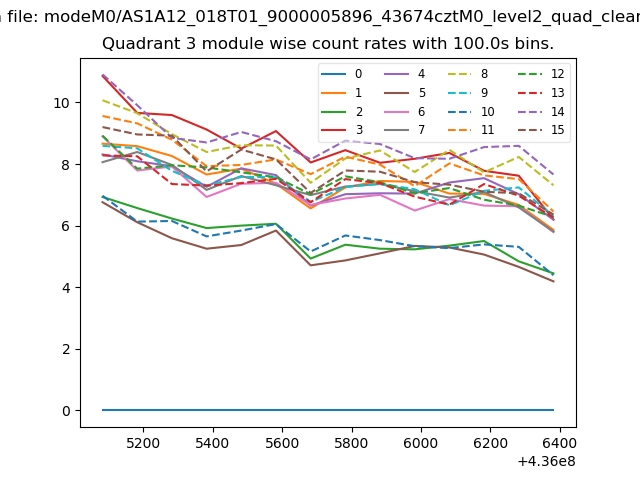
| Module-wise count rates for Quadrant C Data is divided into 100 sec bins |
 |
 |
| Module-wise count rates for Quadrant D Data is divided into 100 sec bins |
 |
 |
| Parameter | Plot |
|---|---|
| CZT HV Monitor |  |
| D_VDD | 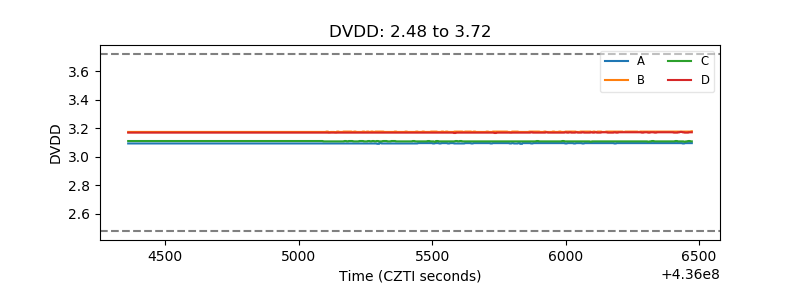 |
| Temperature 1 | 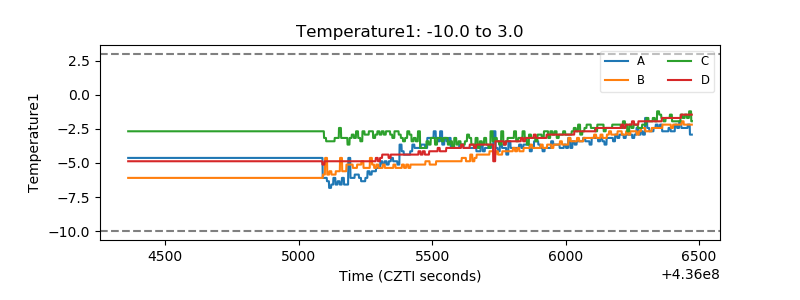 |
| Veto HV Monitor | 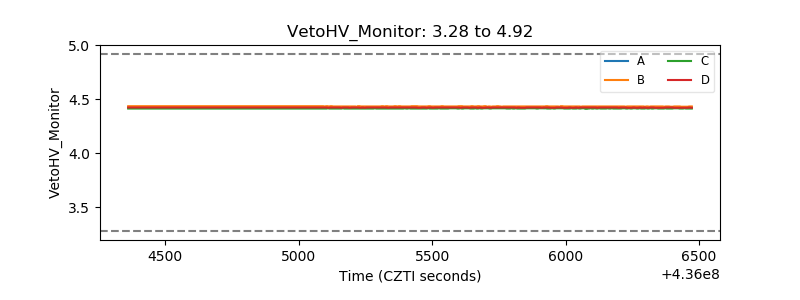 |
| Veto LLD | 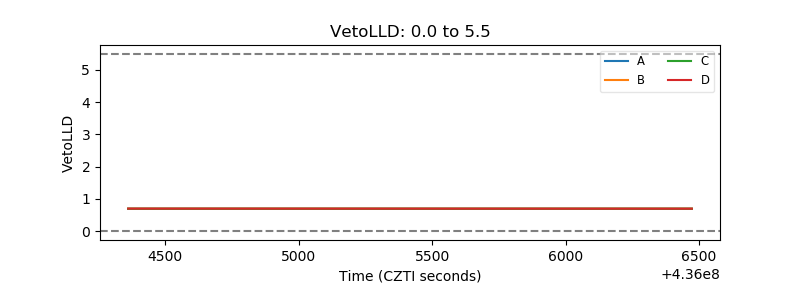 |
| Alpha Counter | 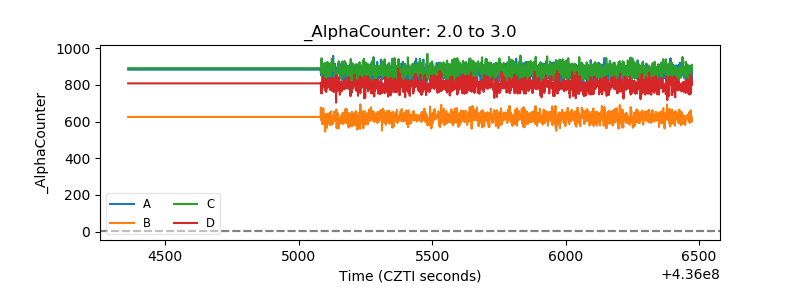 |
| _CPM_Rate | 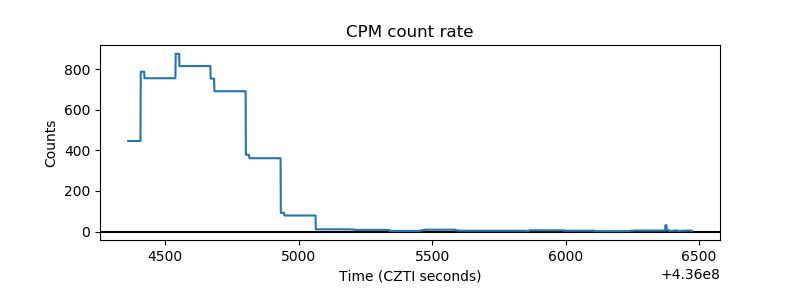 |
| CZT Counter | 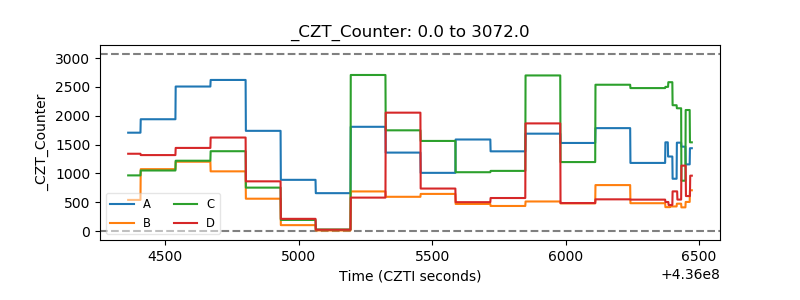 |
| +2.5 Volts monitor | 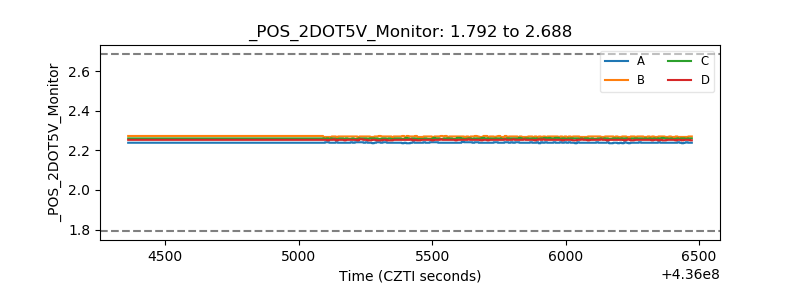 |
| +5 Volts monitor | 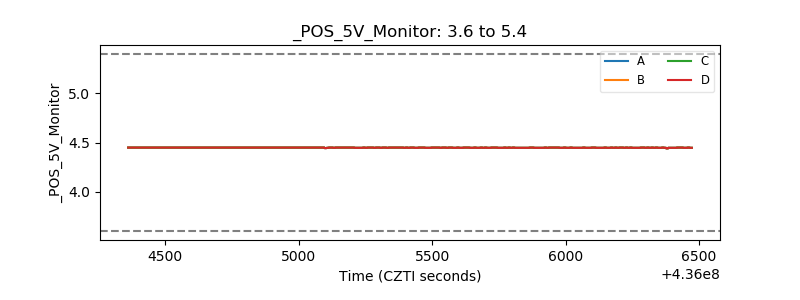 |
| _ROLL_ROT | 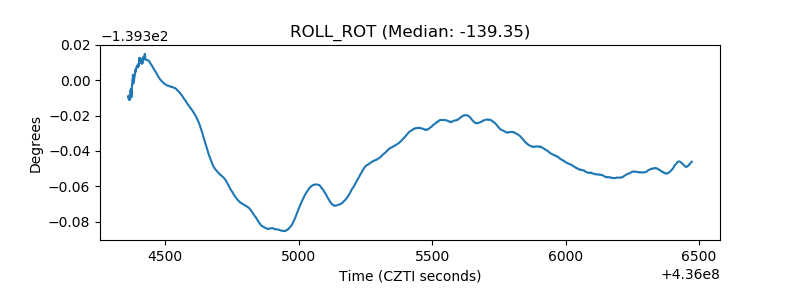 |
| _Roll_DEC | 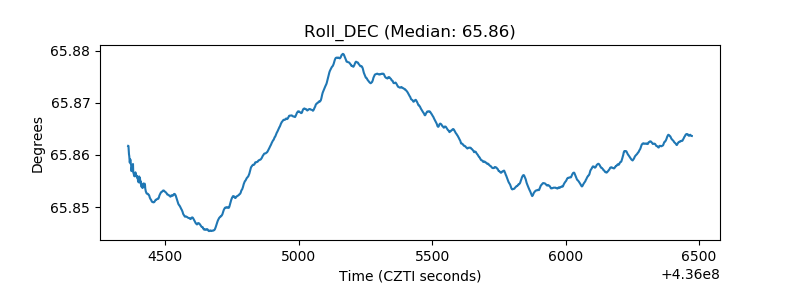 |
| _Roll_RA |  |
| Veto Counter | 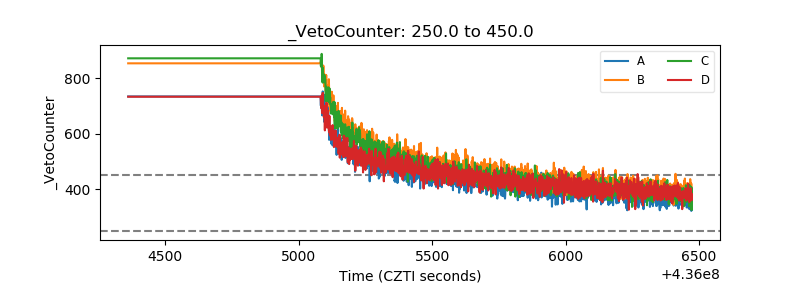 |