| Param | Original file | Final file |
|---|---|---|
| Filename | modeM0/AS1A12_018T01_9000005896_43675cztM0_level2.fits | modeM0/AS1A12_018T01_9000005896_43675cztM0_level2_quad_clean.evt |
| Size (bytes) | 887,584,320 | 92,419,200 |
| Size | 846.5 MB | 88.1 MB |
| Events in quadrant A | 9,042,642 | 700,709 |
| Events in quadrant B | 3,539,282 | 719,420 |
| Events in quadrant C | 13,103,051 | 382,425 |
| Events in quadrant D | 6,716,581 | 581,403 |
| Mode SS | |||
|---|---|---|---|
| Quadrant | BADHDUFLAG | Total packets | Discarded packets |
| A | 0 | 120 | 0 |
| B | 0 | 120 | 0 |
| C | 0 | 120 | 0 |
| D | 0 | 120 | 0 |
| Mode M0 | |||
|---|---|---|---|
| Quadrant | BADHDUFLAG | Total packets | Discarded packets |
| A | 0 | 31047 | 1 |
| B | 0 | 14360 | 1 |
| C | 0 | 42985 | 4 |
| D | 0 | 24036 | 1 |
| Mode M9 | |||
|---|---|---|---|
| Quadrant | BADHDUFLAG | Total packets | Discarded packets |
| A | 0 | 11 | 0 |
| B | 0 | 11 | 0 |
| C | 0 | 11 | 0 |
| D | 0 | 11 | 0 |
| Quadrant | Total seconds | Saturated seconds | Saturation percentage |
|---|---|---|---|
| A | 5891 | 670 | 11.373281% |
| B | 5892 | 133 | 2.257298% |
| C | 5891 | 4326 | 73.434052% |
| D | 5891 | 964 | 16.363945% |
Noise dominated data is calculated using 1-second bins in cleaned event files. If a bin has >2000 counts, and if more than 50% of those come from <1% of pixels, then it is considered to be noise-dominated and hence unusable.
| Quadrant | # 1 sec bins | Bins with >0 counts | Bins with >2000 counts | High rate bins dominated by noise | Noise dominated (total time) | Noise dominated (detector-on time) | Marked lightcurve |
|---|---|---|---|---|---|---|---|
| A | 6991 | 5892 | 233 | 233 | 3.33% | 3.95% | 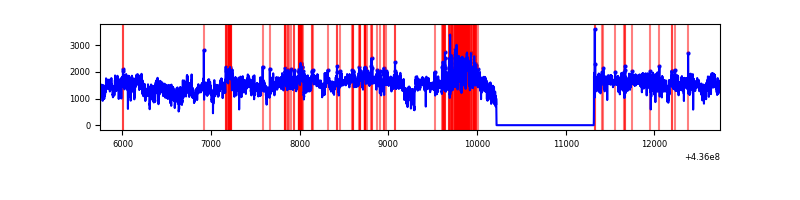 |
| B | 6992 | 5893 | 33 | 33 | 0.47% | 0.56% | 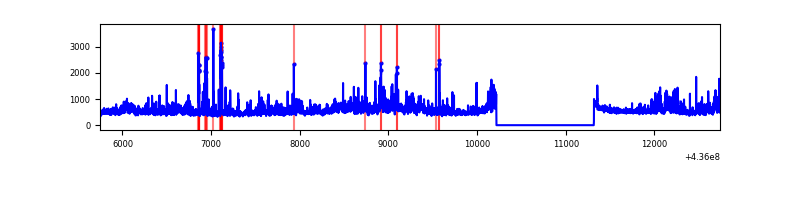 |
| C | 6991 | 5891 | 3962 | 3962 | 56.67% | 67.26% | 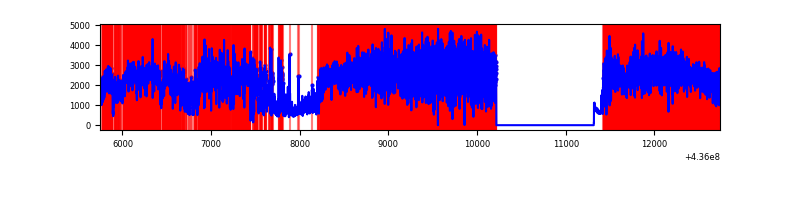 |
| D | 6991 | 5892 | 737 | 737 | 10.54% | 12.51% | 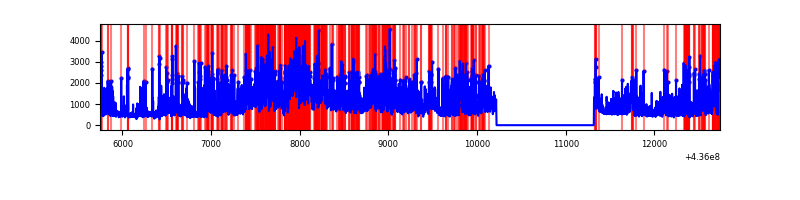 |
Top three noisy pixels from each quadrant. If the there are fewer than three noisy pixels in the level2.evt file, extra rows are filled as -1
| Pixel properties | Quadrant properties | ||||||
|---|---|---|---|---|---|---|---|
| Quadrant | DetID | PixID | Counts | Sigma | Mean | Median | Sigma |
| A | 15 | 222 | 5084900 | 37530.01 | 668 | 657 | 135.5 |
| A | 10 | 83 | 791377 | 5836.8 | 668 | 657 | 135.5 |
| A | 0 | 50 | 232688 | 1712.77 | 668 | 657 | 135.5 |
| B | 0 | 230 | 202808 | 1561.5 | 674 | 654 | 129.5 |
| B | 4 | 206 | 197575 | 1521.08 | 674 | 654 | 129.5 |
| B | 4 | 171 | 176856 | 1361.04 | 674 | 654 | 129.5 |
| C | 15 | 142 | 7999719 | 88590.72 | 381 | 382 | 90.3 |
| C | 15 | 157 | 2384645 | 26405.13 | 381 | 382 | 90.3 |
| C | 15 | 158 | 1085328 | 12015.51 | 381 | 382 | 90.3 |
| D | 12 | 6 | 537437 | 3371.1 | 632 | 613 | 159.2 |
| D | 5 | 235 | 451778 | 2833.18 | 632 | 613 | 159.2 |
| D | 12 | 33 | 350726 | 2198.61 | 632 | 613 | 159.2 |
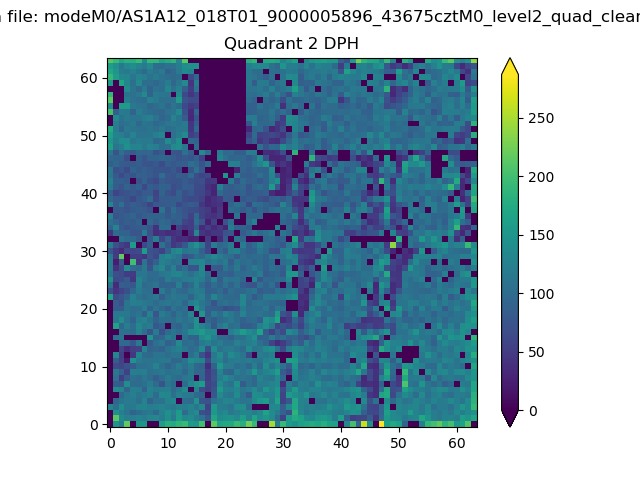
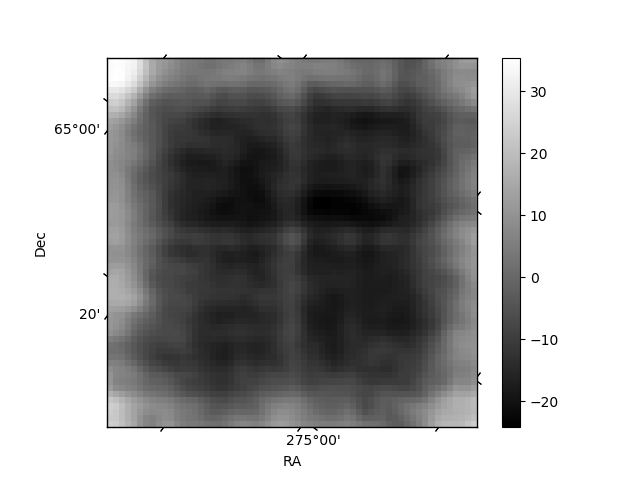
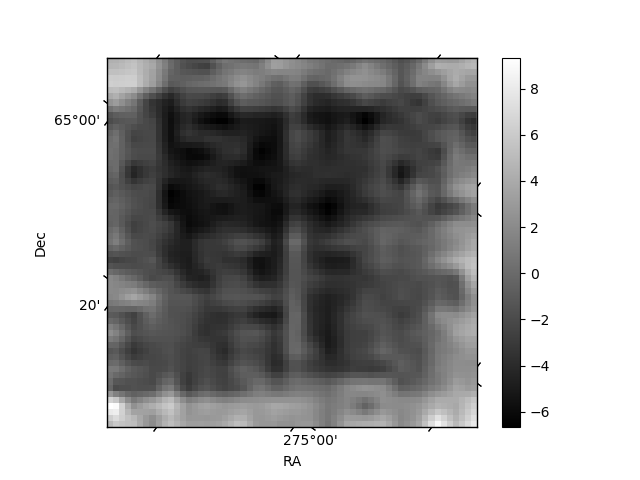
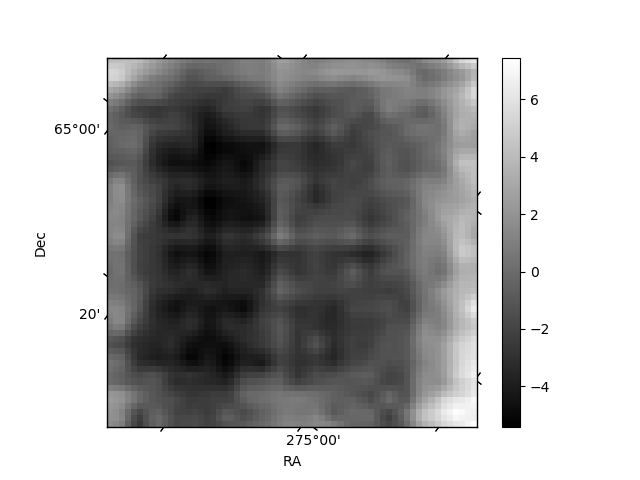
Histogram calculated using DETX and DETY for each event in the final _common_clean file
| Quadrant A | 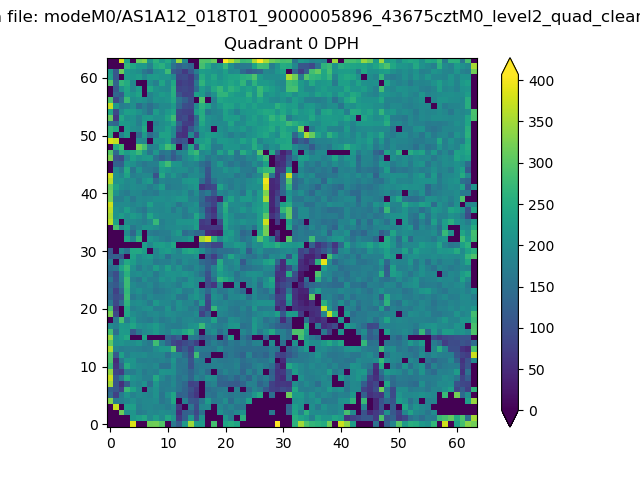 |
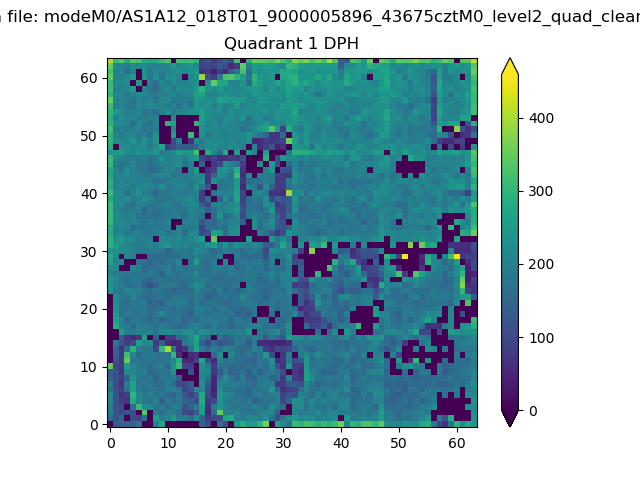 |
Quadrant B |
|---|---|---|---|
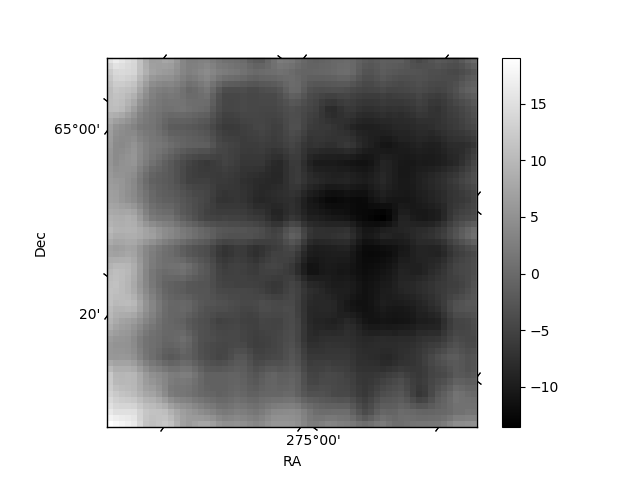
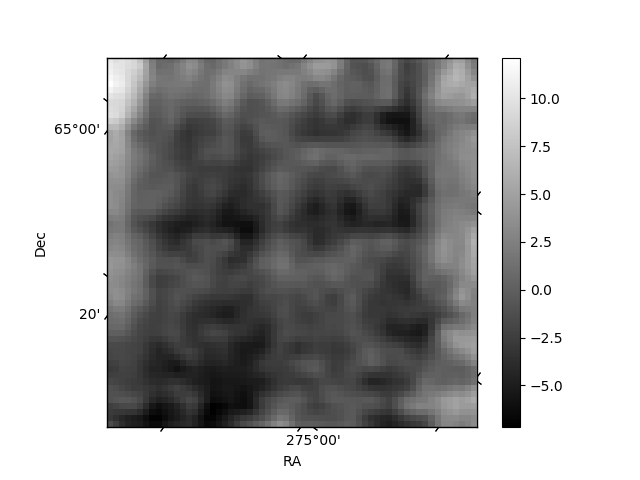
| Quadrant D | 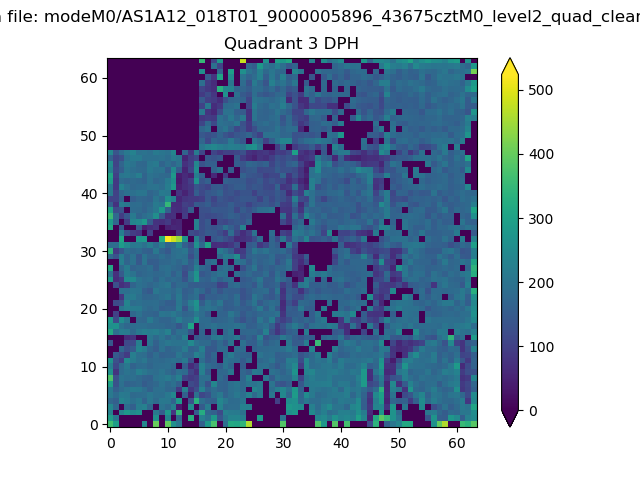 |
 |
Quadrant C |
| Plot type | Count rate plots | Images |
|---|---|---|
| Comparison with Poisson distribution Blue bars denote a histogram of data divided into 1 sec bins. Red curve is a Poisson curve with rate = median count rate of data. |
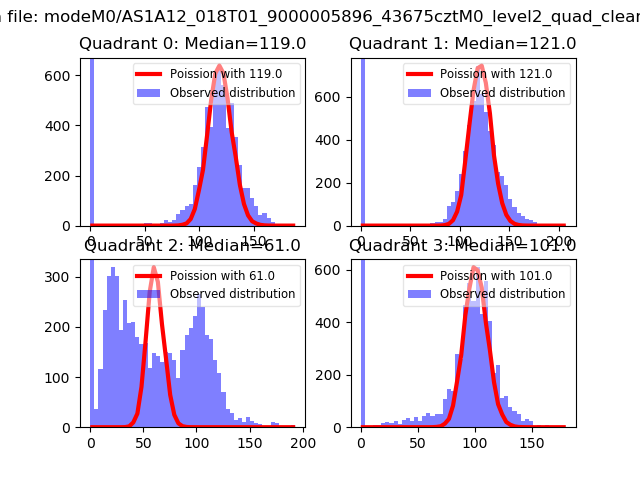 |
 |
| Quadrant-wise count rates Data is divided into 100 sec bins |
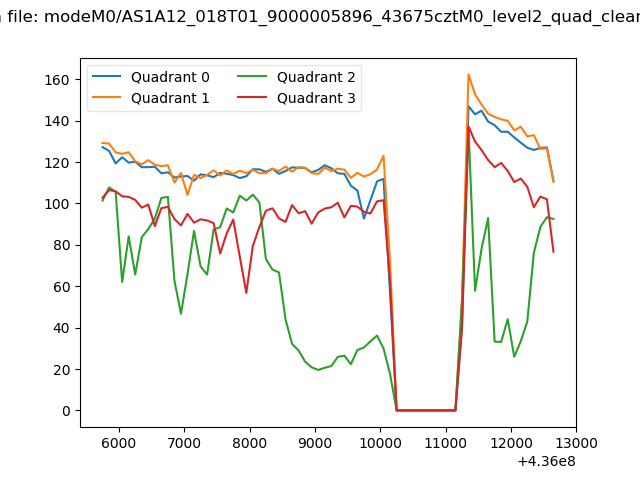 |
|
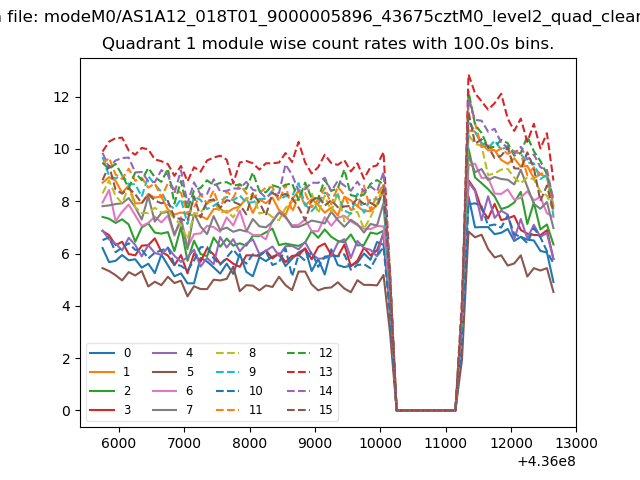
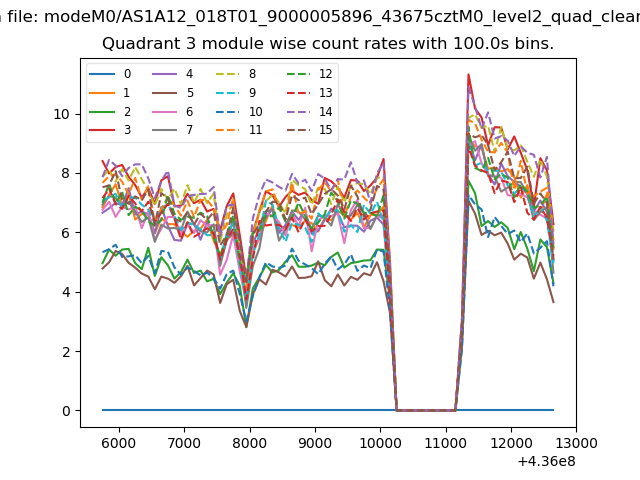
| Module-wise count rates for Quadrant A Data is divided into 100 sec bins |
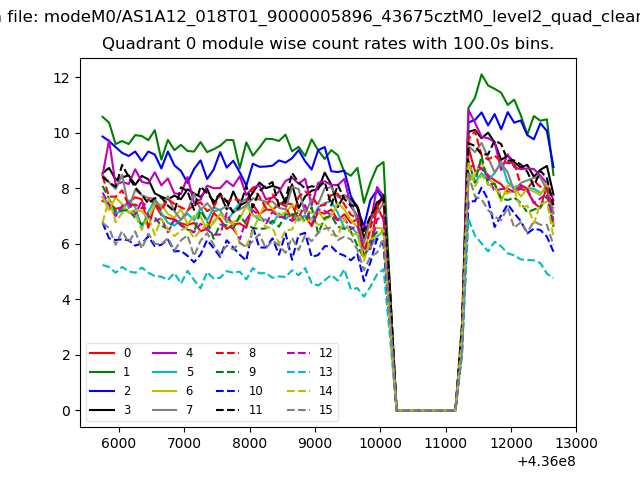 |
 |
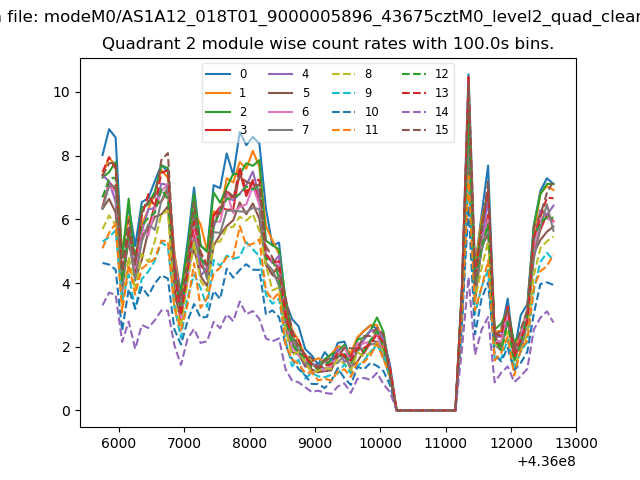
| Module-wise count rates for Quadrant B Data is divided into 100 sec bins |
 |
 |
| Module-wise count rates for Quadrant C Data is divided into 100 sec bins |
 |
 |
| Module-wise count rates for Quadrant D Data is divided into 100 sec bins |
 |
 |
| Parameter | Plot |
|---|---|
| CZT HV Monitor | 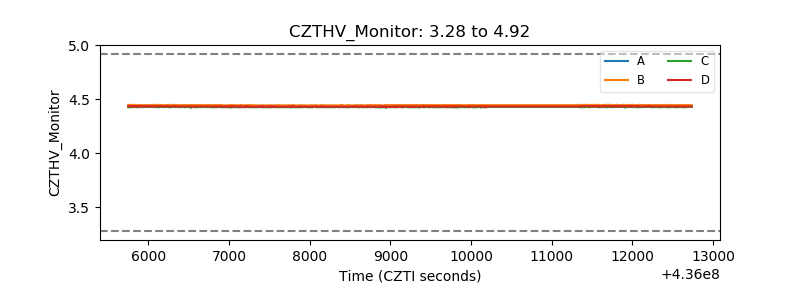 |
| D_VDD | 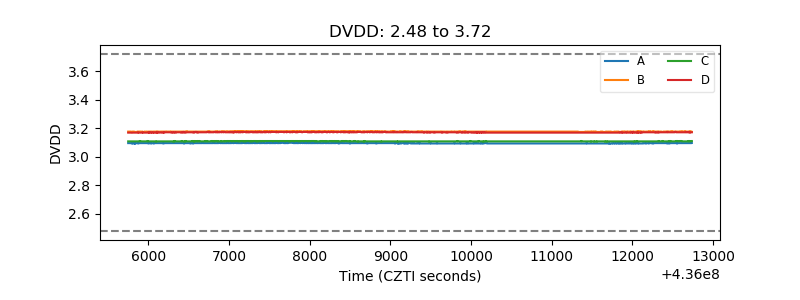 |
| Temperature 1 | 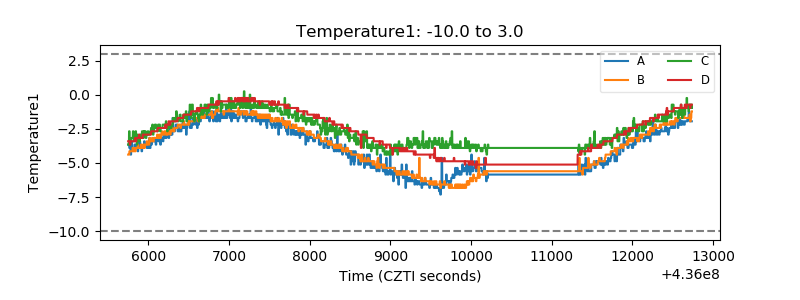 |
| Veto HV Monitor | 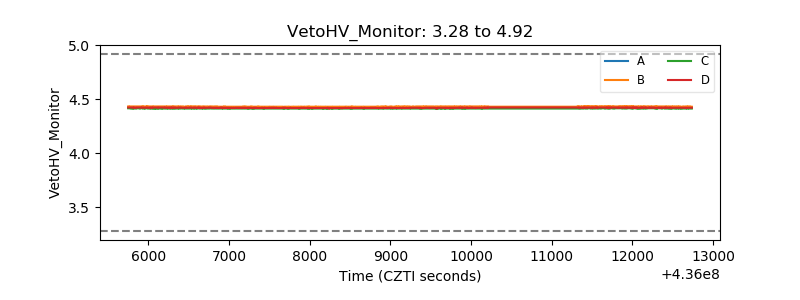 |
| Veto LLD | 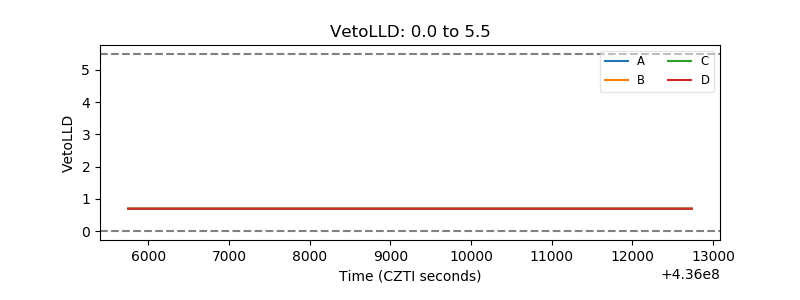 |
| Alpha Counter | 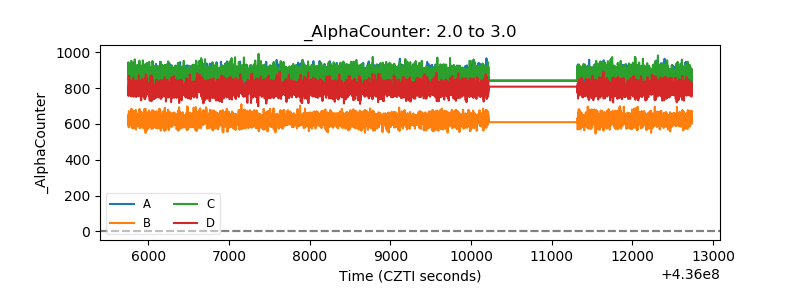 |
| _CPM_Rate | 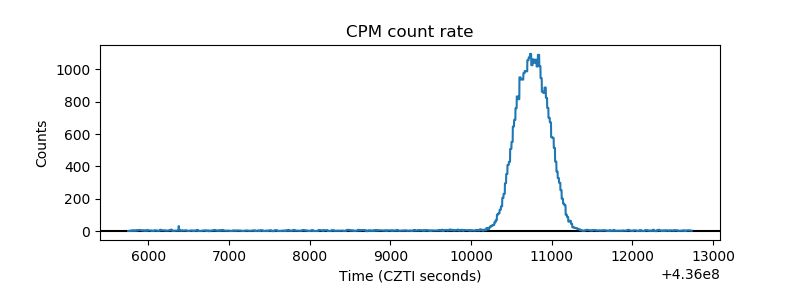 |
| CZT Counter | 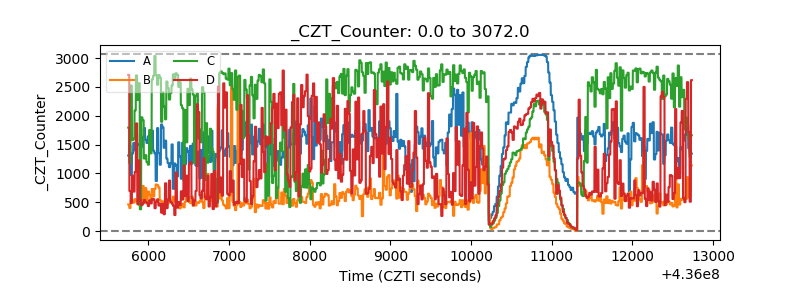 |
| +2.5 Volts monitor | 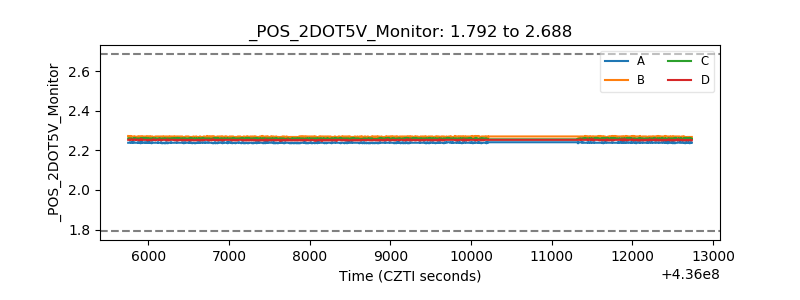 |
| +5 Volts monitor | 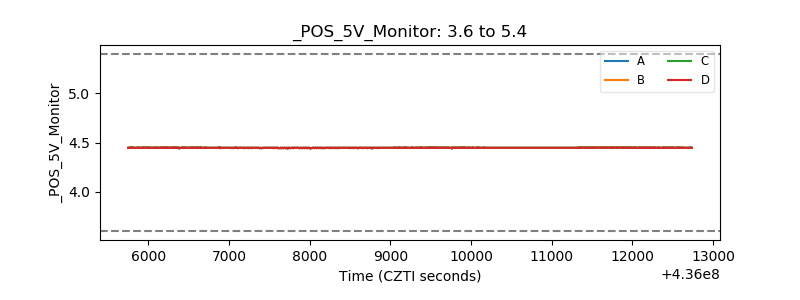 |
| _ROLL_ROT | 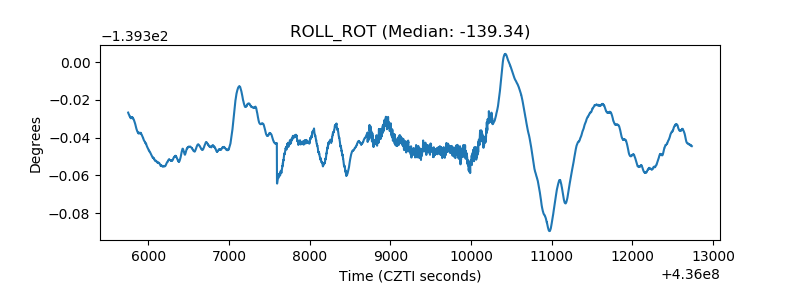 |
| _Roll_DEC | 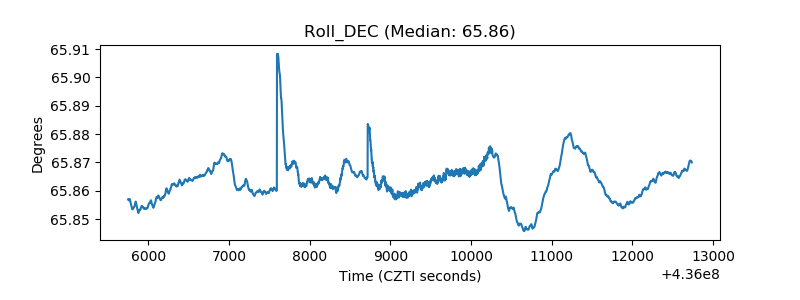 |
| _Roll_RA | 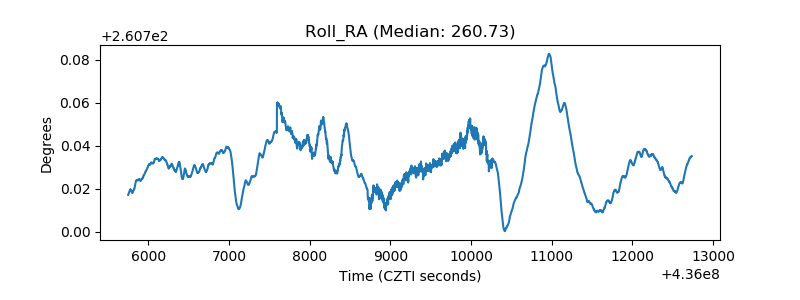 |
| Veto Counter | 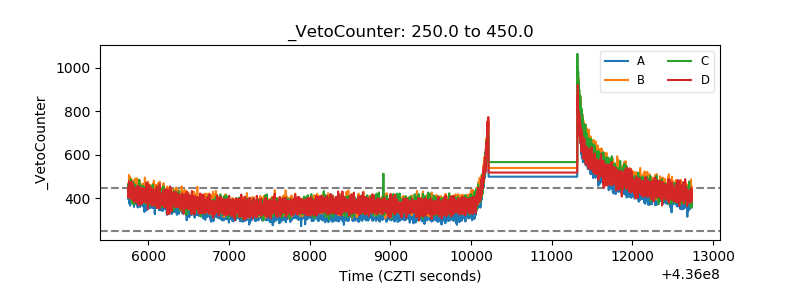 |