| Param | Original file | Final file |
|---|---|---|
| Filename | modeM0/AS1A12_018T01_9000005896_43676cztM0_level2.fits | modeM0/AS1A12_018T01_9000005896_43676cztM0_level2_quad_clean.evt |
| Size (bytes) | 876,006,720 | 91,831,680 |
| Size | 835.4 MB | 87.6 MB |
| Events in quadrant A | 9,100,865 | 703,767 |
| Events in quadrant B | 3,352,762 | 723,024 |
| Events in quadrant C | 11,546,655 | 421,399 |
| Events in quadrant D | 7,980,438 | 524,547 |
| Mode SS | |||
|---|---|---|---|
| Quadrant | BADHDUFLAG | Total packets | Discarded packets |
| A | 0 | 120 | 0 |
| B | 0 | 120 | 0 |
| C | 0 | 120 | 0 |
| D | 0 | 120 | 0 |
| Mode M0 | |||
|---|---|---|---|
| Quadrant | BADHDUFLAG | Total packets | Discarded packets |
| A | 0 | 31031 | 1 |
| B | 0 | 13714 | 1 |
| C | 0 | 38287 | 1 |
| D | 0 | 27721 | 1 |
| Mode M9 | |||
|---|---|---|---|
| Quadrant | BADHDUFLAG | Total packets | Discarded packets |
| A | 0 | 11 | 0 |
| B | 0 | 11 | 0 |
| C | 0 | 11 | 0 |
| D | 0 | 11 | 0 |
| Quadrant | Total seconds | Saturated seconds | Saturation percentage |
|---|---|---|---|
| A | 5790 | 617 | 10.656304% |
| B | 5791 | 134 | 2.313935% |
| C | 5791 | 3540 | 61.129339% |
| D | 5791 | 1621 | 27.991711% |
Noise dominated data is calculated using 1-second bins in cleaned event files. If a bin has >2000 counts, and if more than 50% of those come from <1% of pixels, then it is considered to be noise-dominated and hence unusable.
| Quadrant | # 1 sec bins | Bins with >0 counts | Bins with >2000 counts | High rate bins dominated by noise | Noise dominated (total time) | Noise dominated (detector-on time) | Marked lightcurve |
|---|---|---|---|---|---|---|---|
| A | 6925 | 5791 | 230 | 230 | 3.32% | 3.97% | 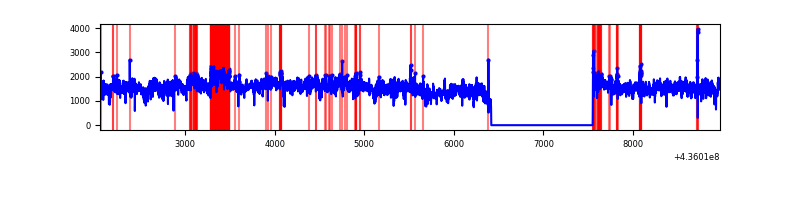 |
| B | 6926 | 5792 | 26 | 26 | 0.38% | 0.45% | 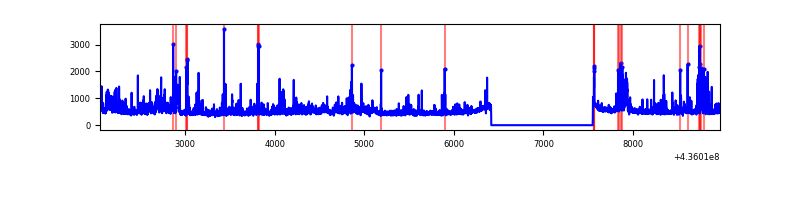 |
| C | 6926 | 5792 | 3284 | 3284 | 47.42% | 56.70% | 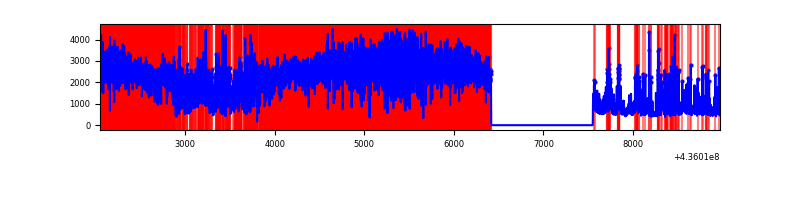 |
| D | 6926 | 5792 | 1393 | 1393 | 20.11% | 24.05% | 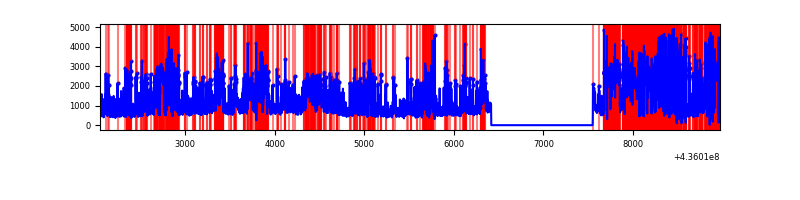 |
Top three noisy pixels from each quadrant. If the there are fewer than three noisy pixels in the level2.evt file, extra rows are filled as -1
| Pixel properties | Quadrant properties | ||||||
|---|---|---|---|---|---|---|---|
| Quadrant | DetID | PixID | Counts | Sigma | Mean | Median | Sigma |
| A | 15 | 222 | 5116942 | 37836.23 | 664 | 652 | 135.2 |
| A | 10 | 83 | 768435 | 5677.95 | 664 | 652 | 135.2 |
| A | 14 | 63 | 419569 | 3098.0 | 664 | 652 | 135.2 |
| B | 5 | 235 | 150121 | 1165.86 | 673 | 655 | 128.2 |
| B | 4 | 171 | 143987 | 1118.01 | 673 | 655 | 128.2 |
| B | 0 | 230 | 118211 | 916.96 | 673 | 655 | 128.2 |
| C | 15 | 142 | 7945179 | 81172.43 | 420 | 423 | 97.9 |
| C | 15 | 157 | 927400 | 9471.02 | 420 | 423 | 97.9 |
| C | 15 | 158 | 761460 | 7775.6 | 420 | 423 | 97.9 |
| D | 13 | 187 | 2557478 | 15967.45 | 566 | 554 | 160.1 |
| D | 5 | 235 | 506529 | 3159.71 | 566 | 554 | 160.1 |
| D | 1 | 52 | 474710 | 2961.0 | 566 | 554 | 160.1 |
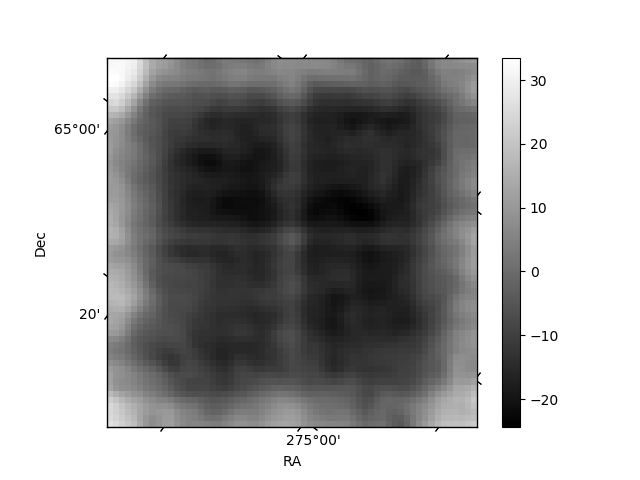
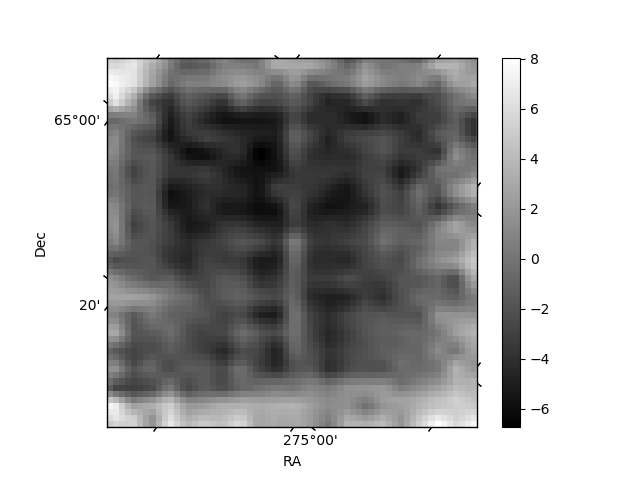
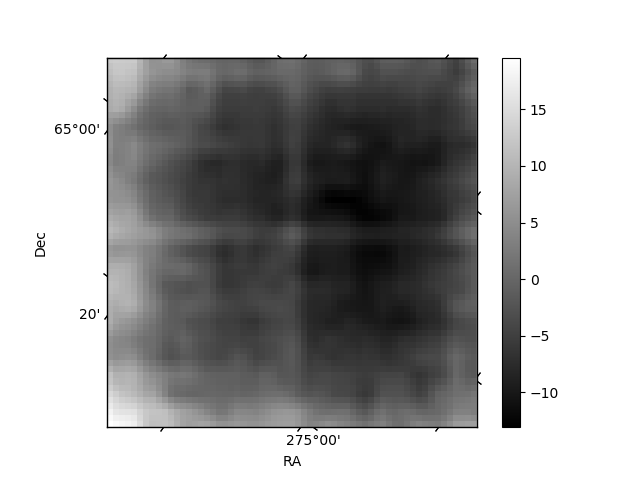
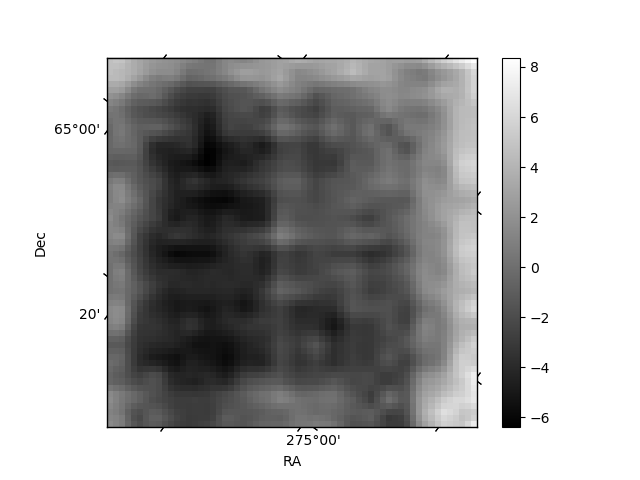
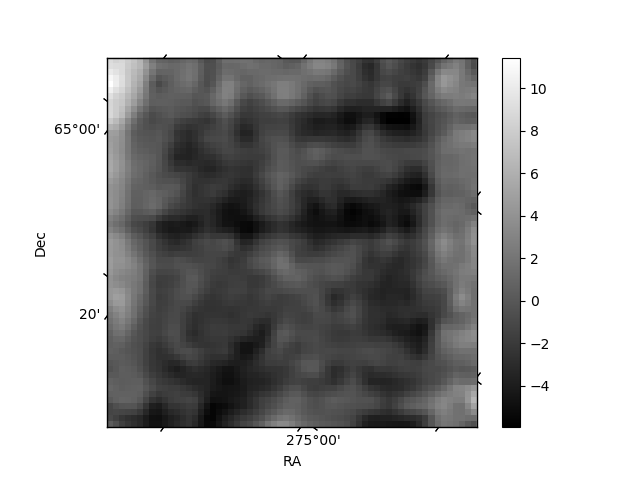
Histogram calculated using DETX and DETY for each event in the final _common_clean file
| Quadrant A | 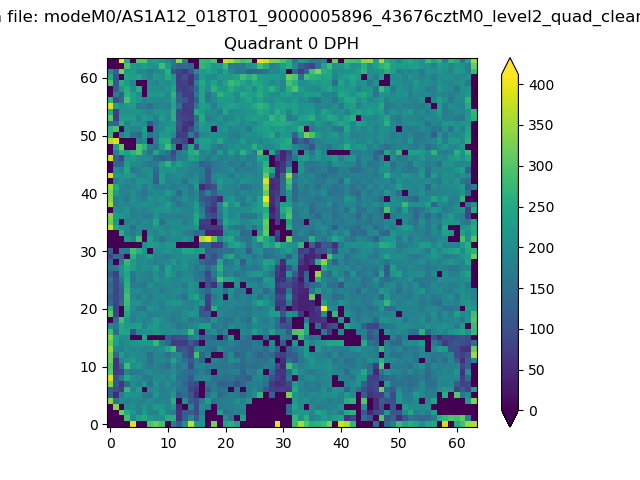 |
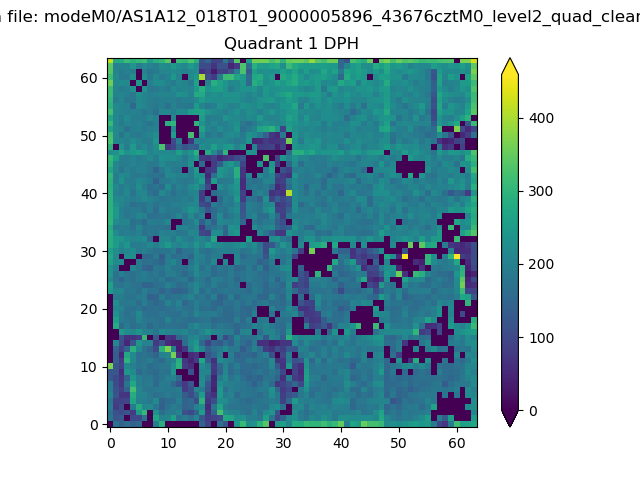 |
Quadrant B |
|---|---|---|---|
| Quadrant D | 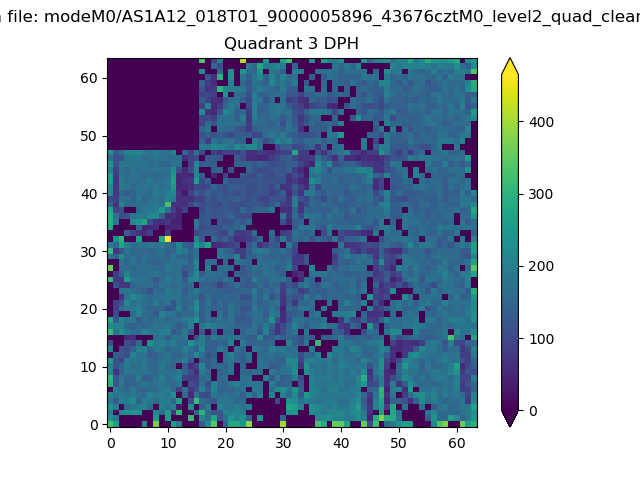 |
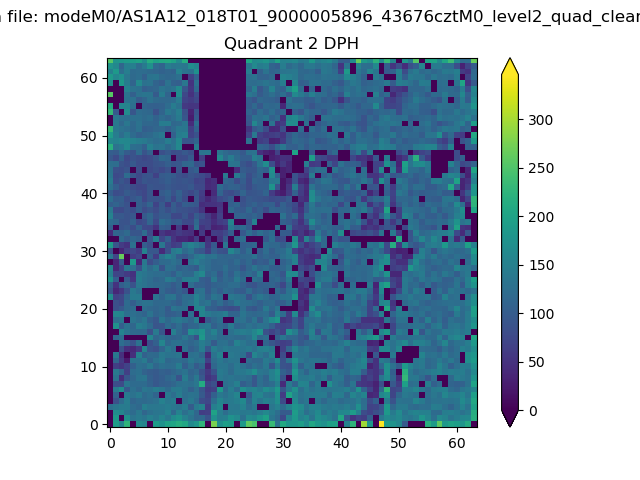 |
Quadrant C |
| Plot type | Count rate plots | Images |
|---|---|---|
| Comparison with Poisson distribution Blue bars denote a histogram of data divided into 1 sec bins. Red curve is a Poisson curve with rate = median count rate of data. |
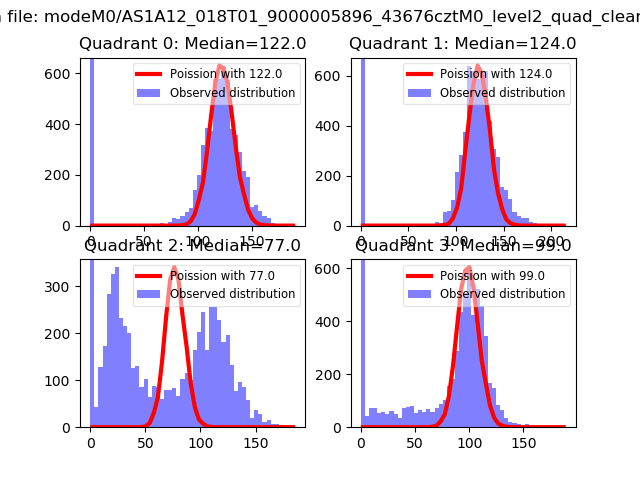 |
 |
| Quadrant-wise count rates Data is divided into 100 sec bins |
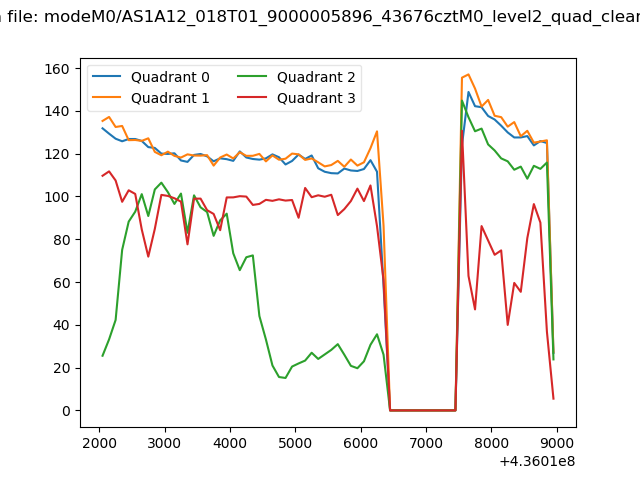 |
|
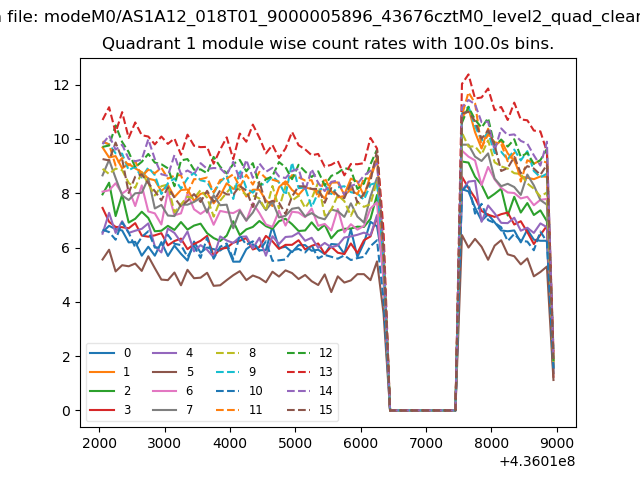
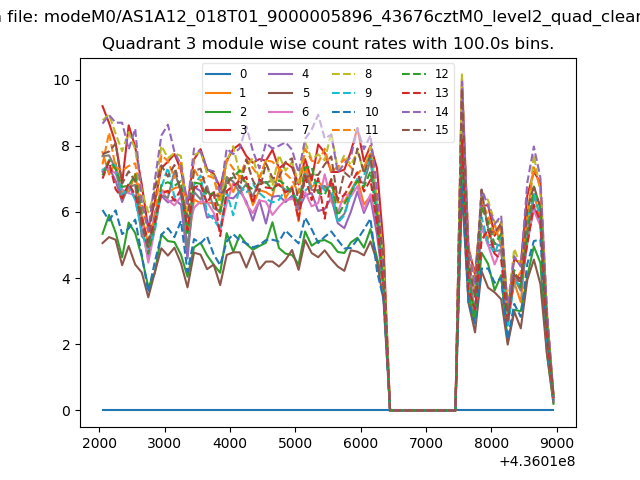
| Module-wise count rates for Quadrant A Data is divided into 100 sec bins |
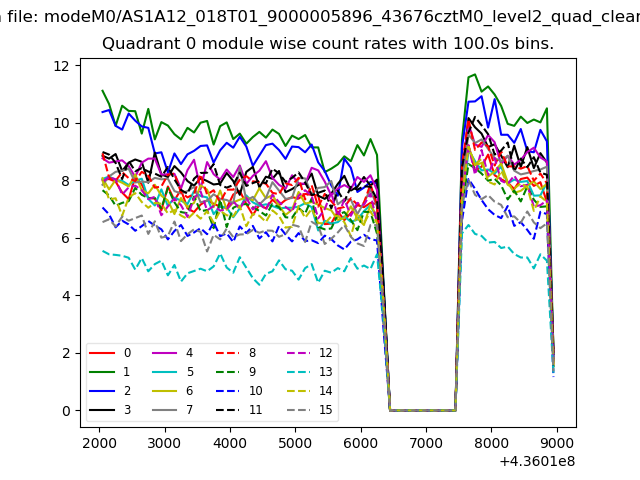 |
 |
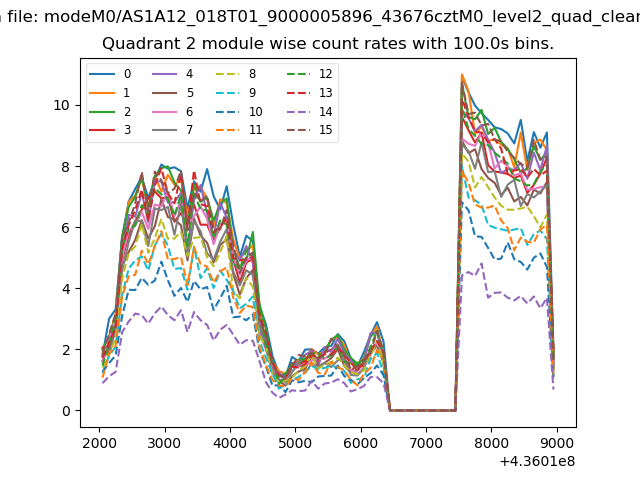
| Module-wise count rates for Quadrant B Data is divided into 100 sec bins |
 |
 |
| Module-wise count rates for Quadrant C Data is divided into 100 sec bins |
 |
 |
| Module-wise count rates for Quadrant D Data is divided into 100 sec bins |
 |
 |
| Parameter | Plot |
|---|---|
| CZT HV Monitor | 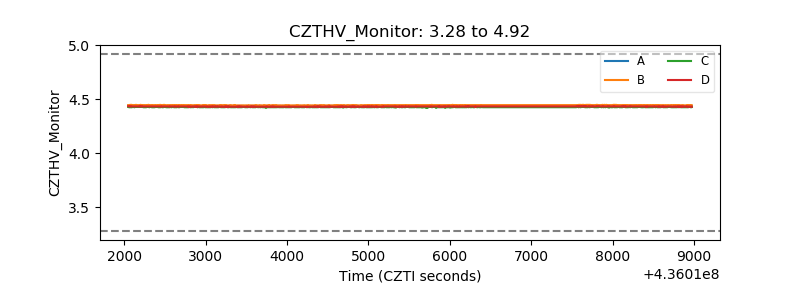 |
| D_VDD | 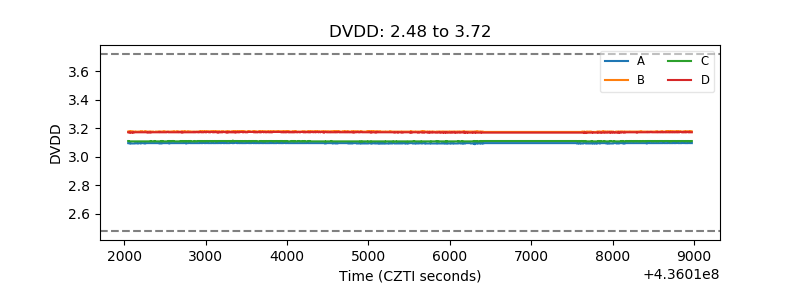 |
| Temperature 1 | 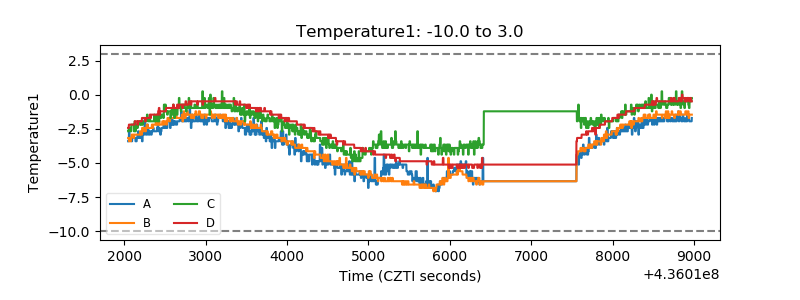 |
| Veto HV Monitor | 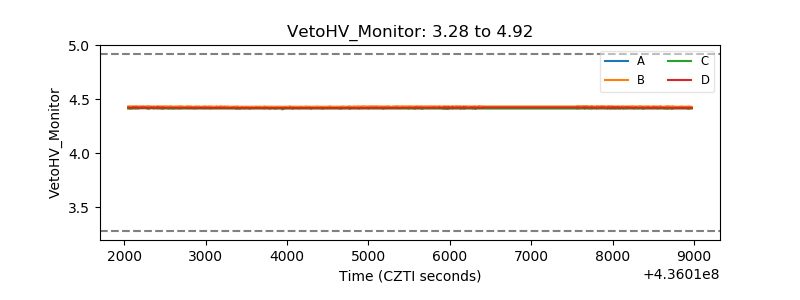 |
| Veto LLD | 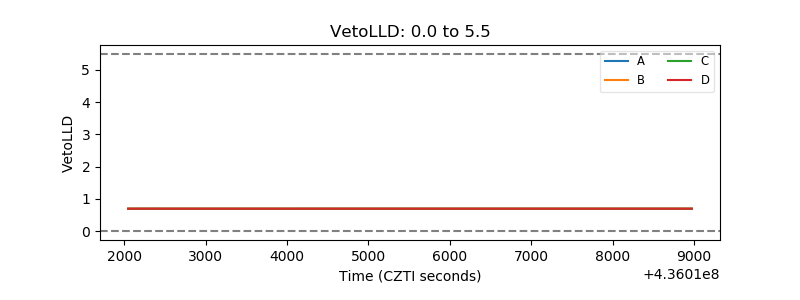 |
| Alpha Counter | 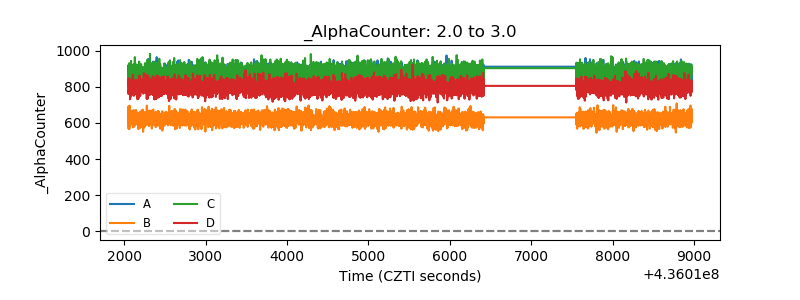 |
| _CPM_Rate | 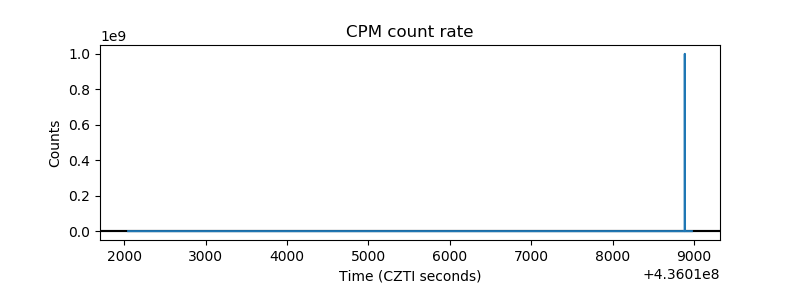 |
| CZT Counter | 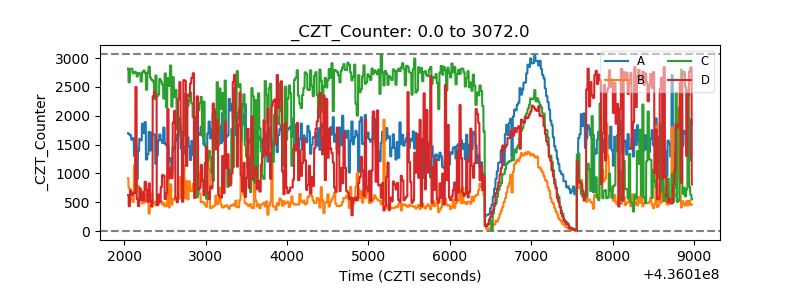 |
| +2.5 Volts monitor | 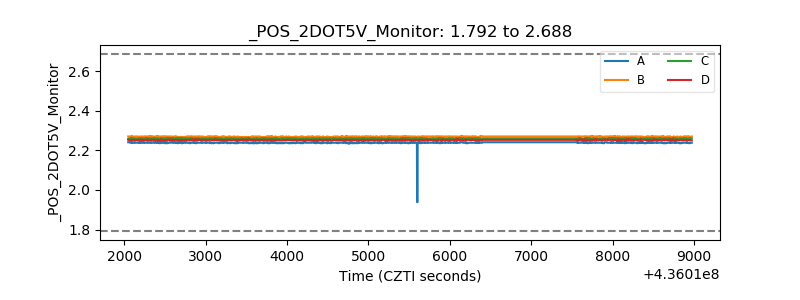 |
| +5 Volts monitor | 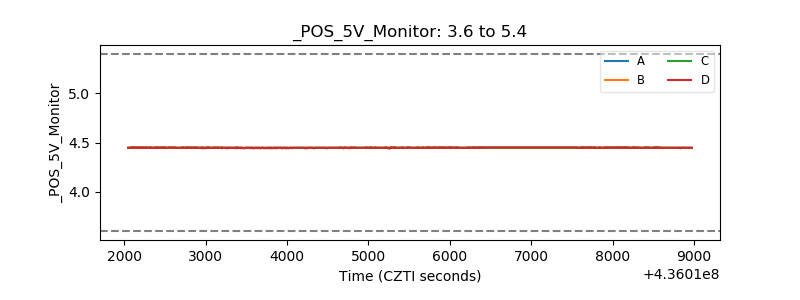 |
| _ROLL_ROT | 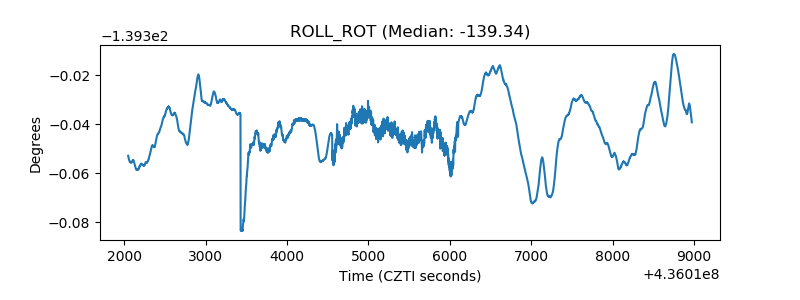 |
| _Roll_DEC | 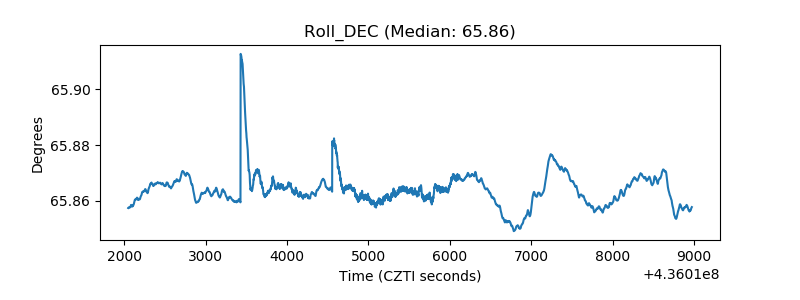 |
| _Roll_RA | 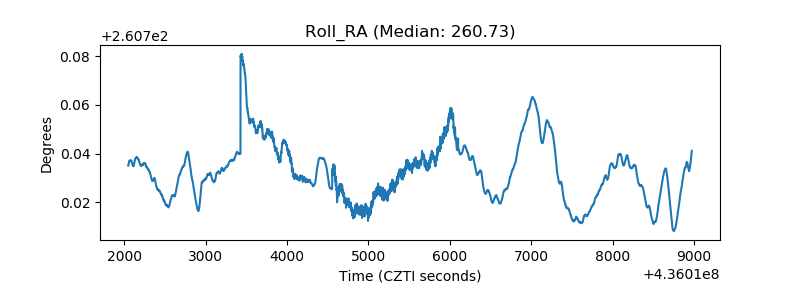 |
| Veto Counter | 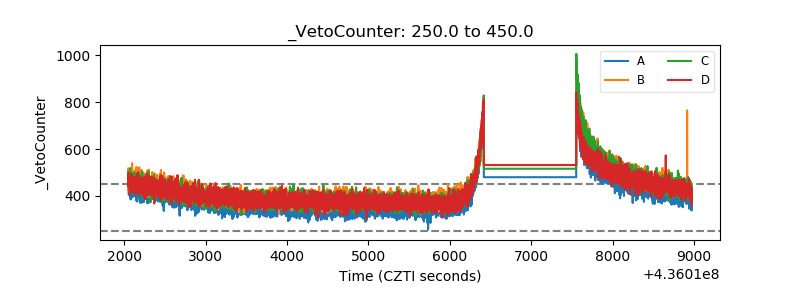 |