| Param | Original file | Final file |
|---|---|---|
| Filename | modeM0/AS1A12_018T01_9000005896_43677cztM0_level2.fits | modeM0/AS1A12_018T01_9000005896_43677cztM0_level2_quad_clean.evt |
| Size (bytes) | 897,004,800 | 92,793,600 |
| Size | 855.5 MB | 88.5 MB |
| Events in quadrant A | 8,947,636 | 713,021 |
| Events in quadrant B | 3,673,380 | 725,390 |
| Events in quadrant C | 11,429,544 | 436,831 |
| Events in quadrant D | 8,696,466 | 517,072 |
| Mode SS | |||
|---|---|---|---|
| Quadrant | BADHDUFLAG | Total packets | Discarded packets |
| A | 0 | 120 | 0 |
| B | 0 | 120 | 0 |
| C | 0 | 120 | 0 |
| D | 0 | 120 | 0 |
| Mode M0 | |||
|---|---|---|---|
| Quadrant | BADHDUFLAG | Total packets | Discarded packets |
| A | 0 | 30730 | 1 |
| B | 0 | 14773 | 1 |
| C | 0 | 38034 | 1 |
| D | 0 | 30025 | 1 |
| Mode M9 | |||
|---|---|---|---|
| Quadrant | BADHDUFLAG | Total packets | Discarded packets |
| A | 0 | 12 | 0 |
| B | 0 | 12 | 0 |
| C | 0 | 12 | 0 |
| D | 0 | 12 | 0 |
| Quadrant | Total seconds | Saturated seconds | Saturation percentage |
|---|---|---|---|
| A | 5937 | 557 | 9.381843% |
| B | 5937 | 265 | 4.463534% |
| C | 5937 | 3377 | 56.880579% |
| D | 5937 | 1897 | 31.952164% |
Noise dominated data is calculated using 1-second bins in cleaned event files. If a bin has >2000 counts, and if more than 50% of those come from <1% of pixels, then it is considered to be noise-dominated and hence unusable.
| Quadrant | # 1 sec bins | Bins with >0 counts | Bins with >2000 counts | High rate bins dominated by noise | Noise dominated (total time) | Noise dominated (detector-on time) | Marked lightcurve |
|---|---|---|---|---|---|---|---|
| A | 7082 | 5938 | 93 | 93 | 1.31% | 1.57% | 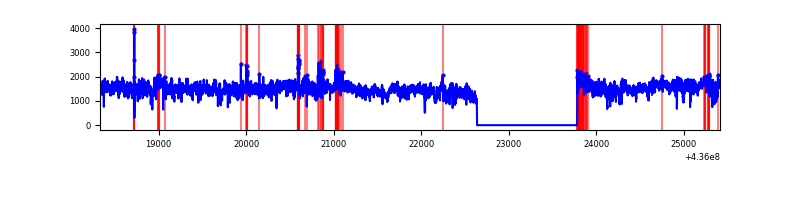 |
| B | 7082 | 5938 | 150 | 150 | 2.12% | 2.53% | 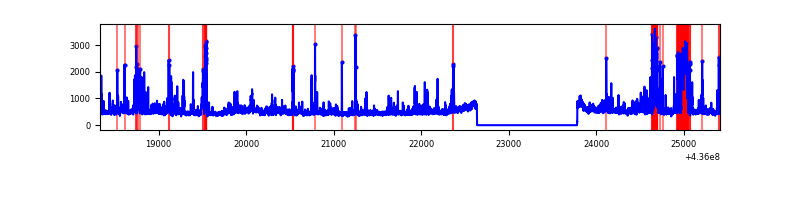 |
| C | 7082 | 5938 | 3000 | 3000 | 42.36% | 50.52% | 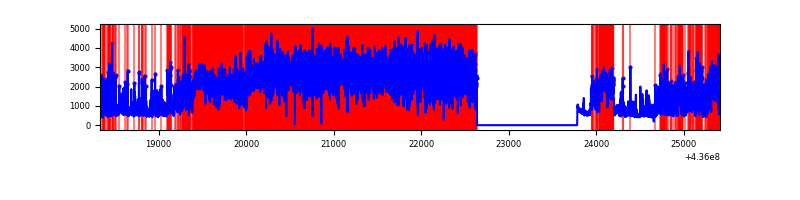 |
| D | 7082 | 5938 | 1595 | 1595 | 22.52% | 26.86% | 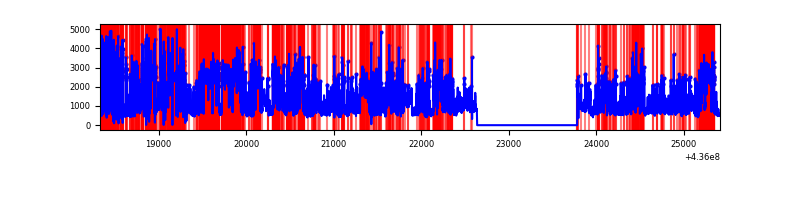 |
Top three noisy pixels from each quadrant. If the there are fewer than three noisy pixels in the level2.evt file, extra rows are filled as -1
| Pixel properties | Quadrant properties | ||||||
|---|---|---|---|---|---|---|---|
| Quadrant | DetID | PixID | Counts | Sigma | Mean | Median | Sigma |
| A | 15 | 222 | 5286495 | 38230.56 | 679 | 665 | 138.3 |
| A | 10 | 83 | 811819 | 5866.79 | 679 | 665 | 138.3 |
| A | 15 | 223 | 90032 | 646.36 | 679 | 665 | 138.3 |
| B | 5 | 235 | 291014 | 2232.13 | 680 | 660 | 130.1 |
| B | 15 | 54 | 201929 | 1547.28 | 680 | 660 | 130.1 |
| B | 5 | 172 | 177804 | 1361.81 | 680 | 660 | 130.1 |
| C | 15 | 142 | 8297523 | 81295.09 | 437 | 441 | 102.1 |
| C | 15 | 158 | 702641 | 6880.18 | 437 | 441 | 102.1 |
| C | 15 | 157 | 494267 | 4838.52 | 437 | 441 | 102.1 |
| D | 13 | 187 | 3210425 | 21435.68 | 573 | 552 | 149.7 |
| D | 1 | 52 | 458436 | 3057.77 | 573 | 552 | 149.7 |
| D | 13 | 249 | 405541 | 2704.54 | 573 | 552 | 149.7 |
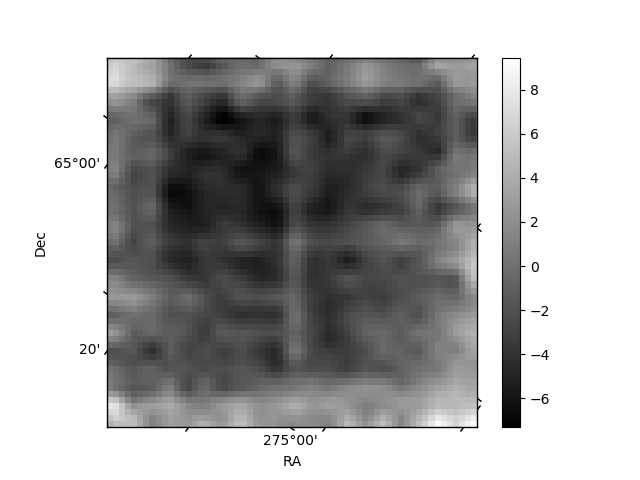
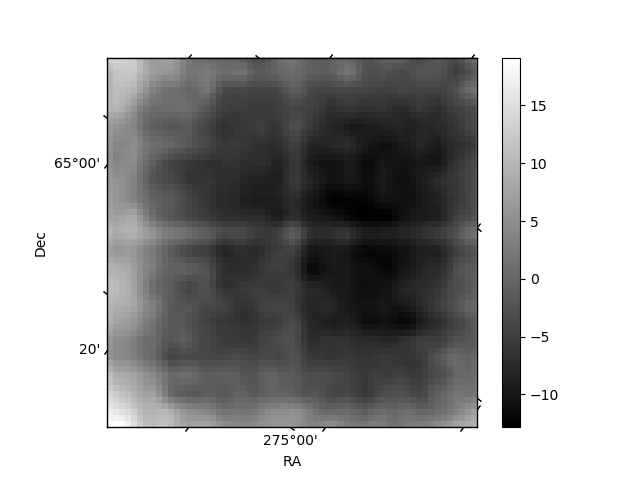
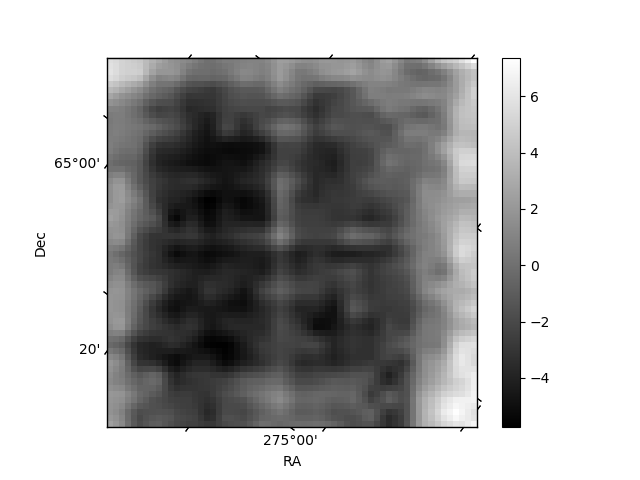
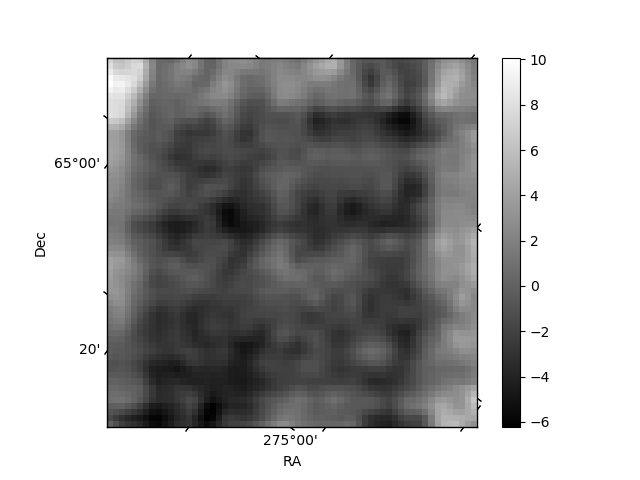
Histogram calculated using DETX and DETY for each event in the final _common_clean file
| Quadrant A | 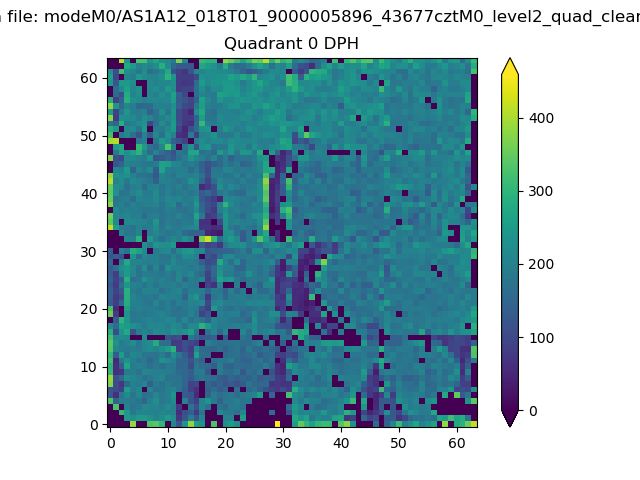 |
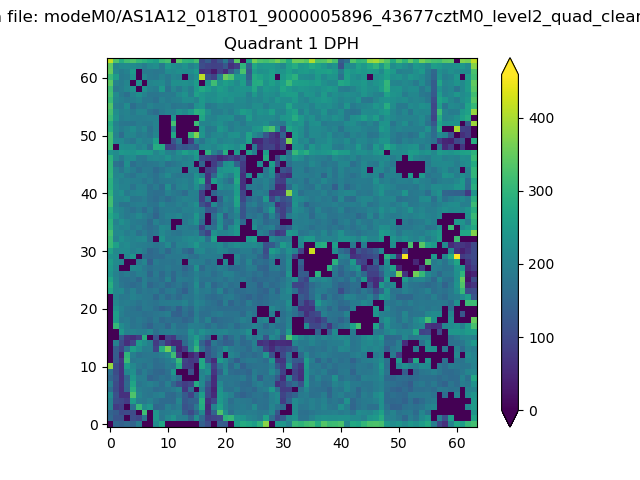 |
Quadrant B |
|---|---|---|---|
| Quadrant D | 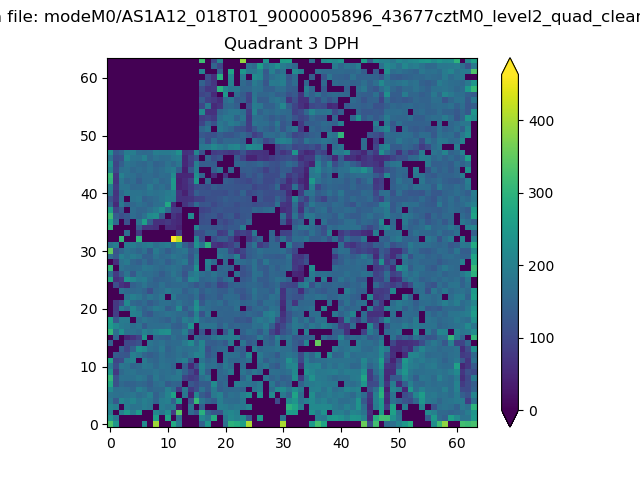 |
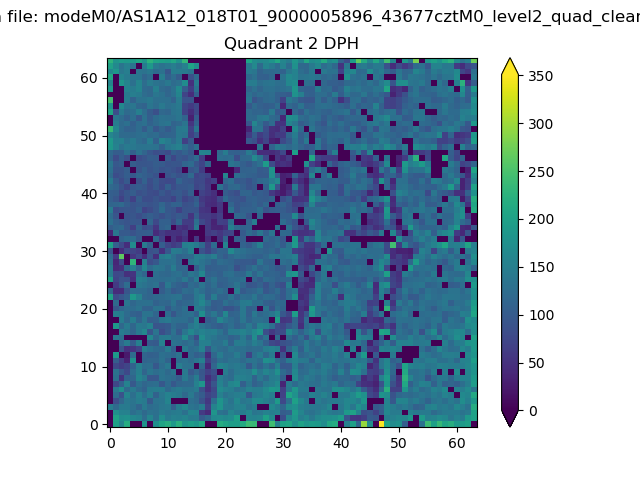 |
Quadrant C |
| Plot type | Count rate plots | Images |
|---|---|---|
| Comparison with Poisson distribution Blue bars denote a histogram of data divided into 1 sec bins. Red curve is a Poisson curve with rate = median count rate of data. |
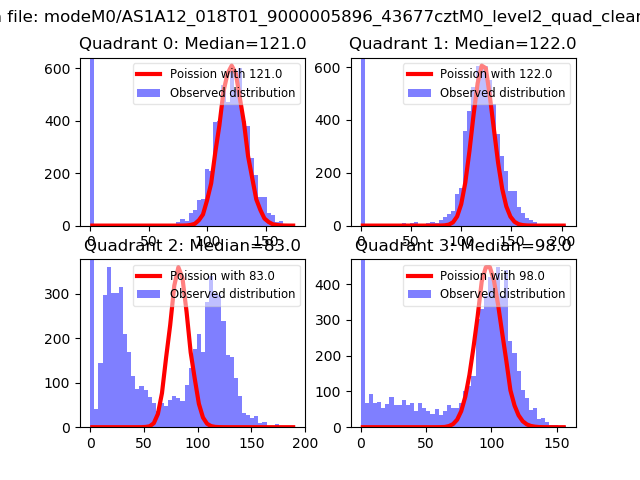 |
 |
| Quadrant-wise count rates Data is divided into 100 sec bins |
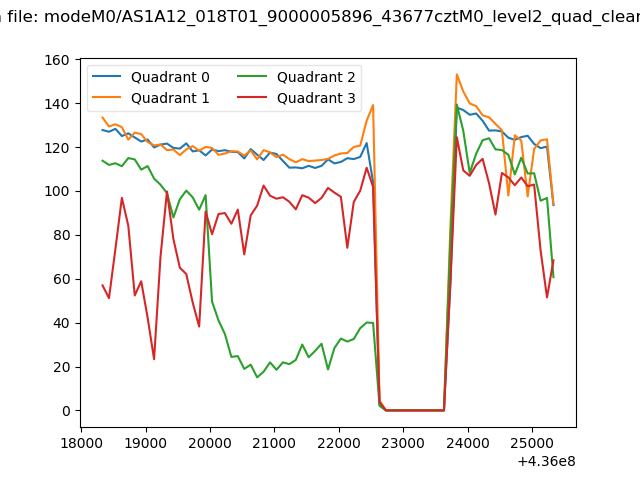 |
|
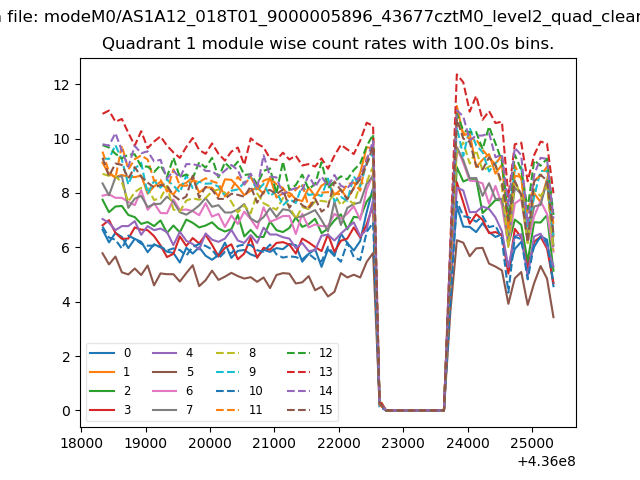
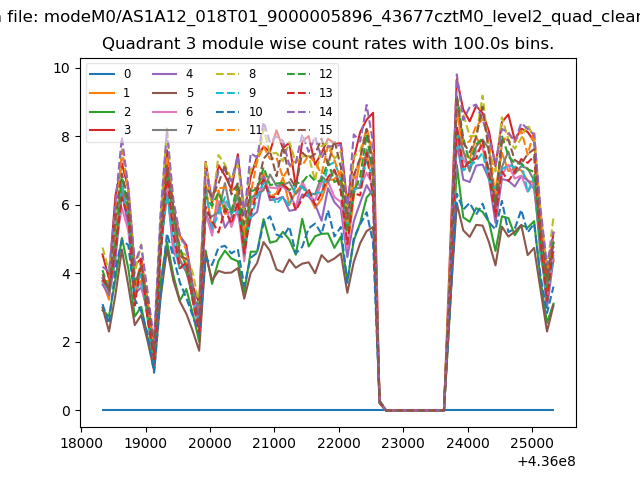
| Module-wise count rates for Quadrant A Data is divided into 100 sec bins |
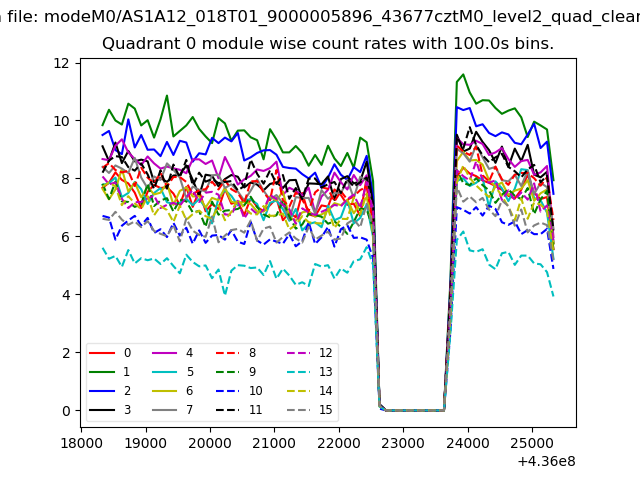 |
 |
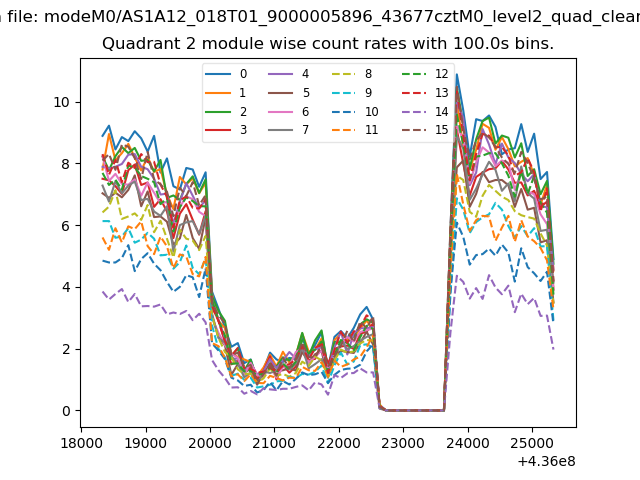
| Module-wise count rates for Quadrant B Data is divided into 100 sec bins |
 |
 |
| Module-wise count rates for Quadrant C Data is divided into 100 sec bins |
 |
 |
| Module-wise count rates for Quadrant D Data is divided into 100 sec bins |
 |
 |
| Parameter | Plot |
|---|---|
| CZT HV Monitor | 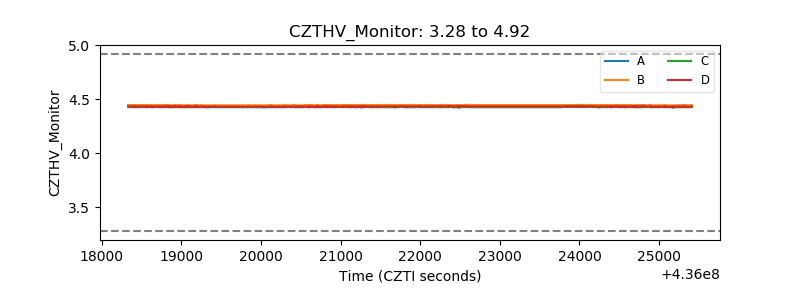 |
| D_VDD | 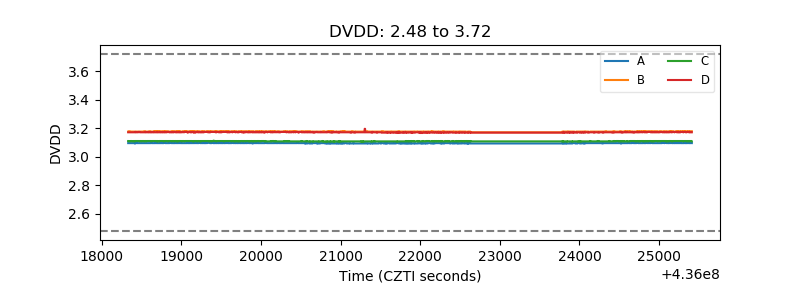 |
| Temperature 1 | 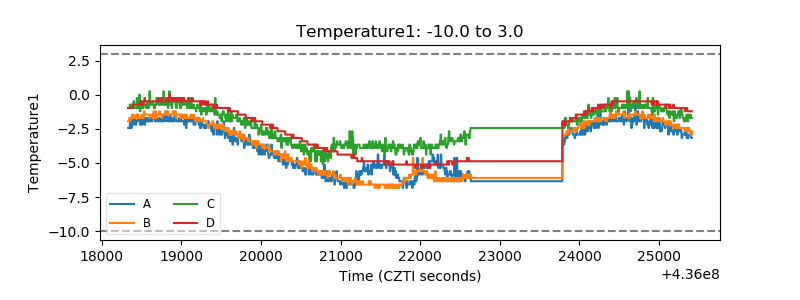 |
| Veto HV Monitor | 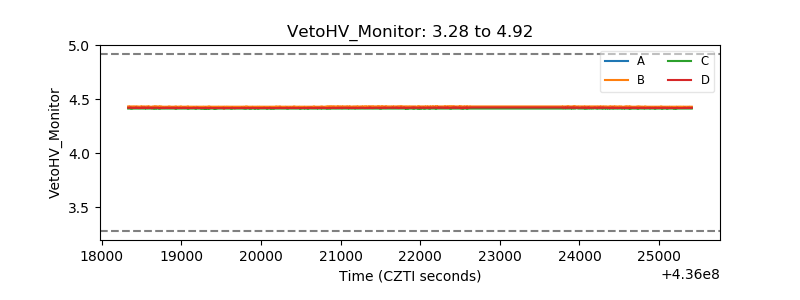 |
| Veto LLD | 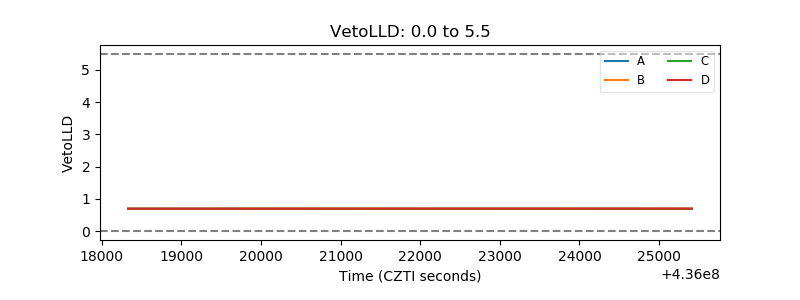 |
| Alpha Counter | 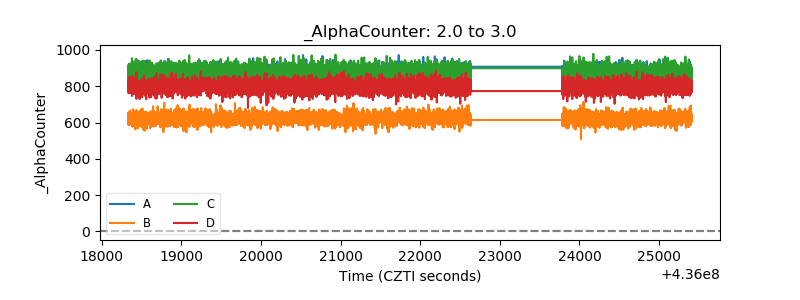 |
| _CPM_Rate | 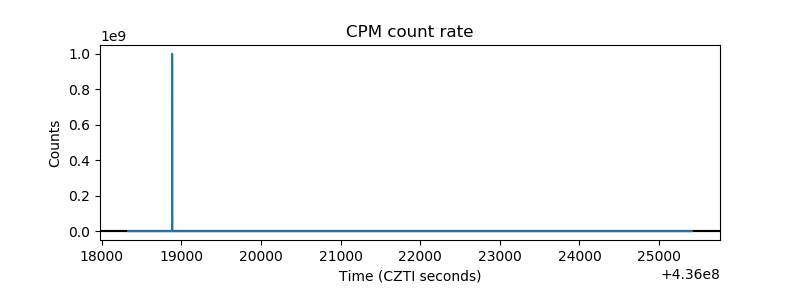 |
| CZT Counter | 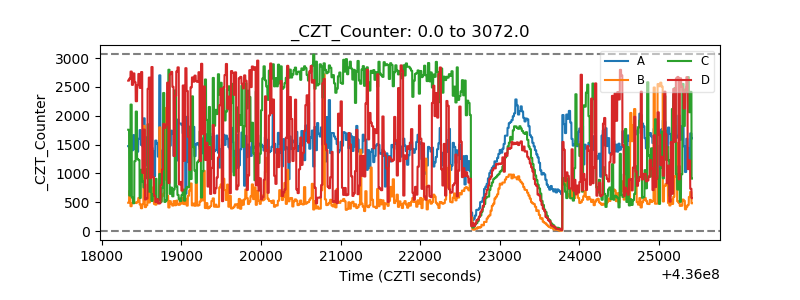 |
| +2.5 Volts monitor | 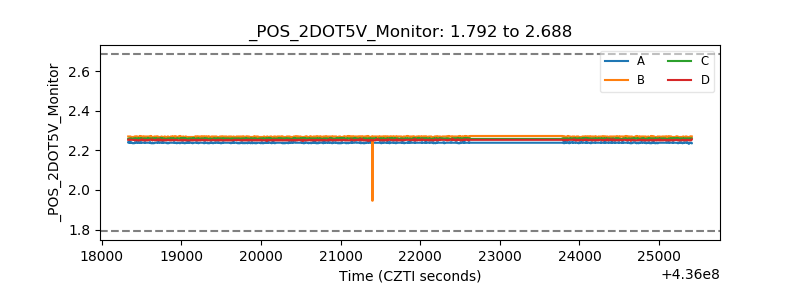 |
| +5 Volts monitor | 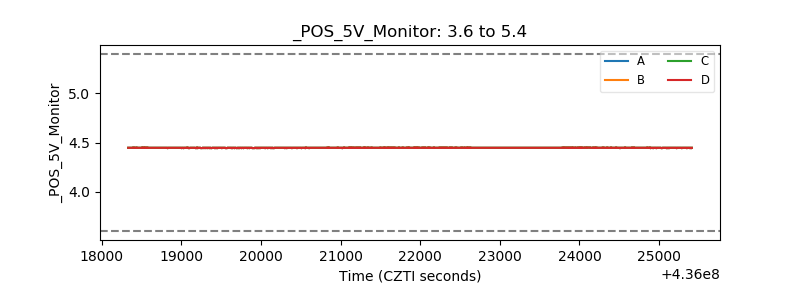 |
| _ROLL_ROT | 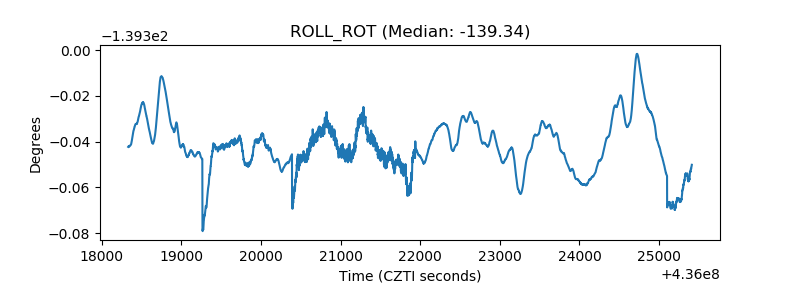 |
| _Roll_DEC | 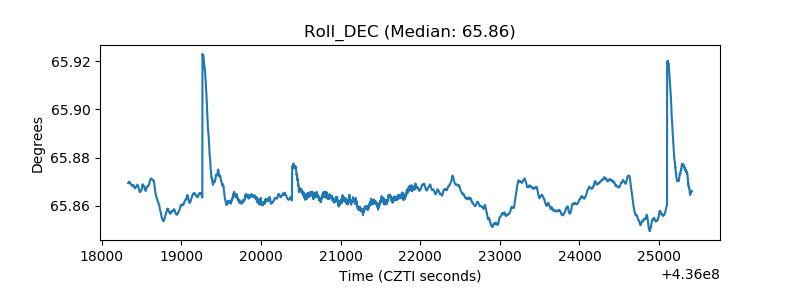 |
| _Roll_RA |  |
| Veto Counter | 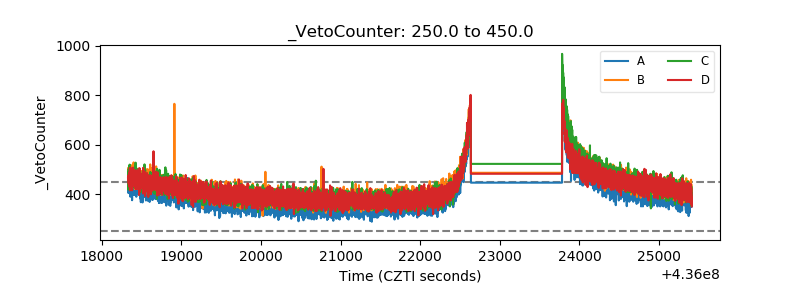 |