| Param | Original file | Final file |
|---|---|---|
| Filename | modeM0/AS1A12_018T01_9000005896_43678cztM0_level2.fits | modeM0/AS1A12_018T01_9000005896_43678cztM0_level2_quad_clean.evt |
| Size (bytes) | 938,053,440 | 90,596,160 |
| Size | 894.6 MB | 86.4 MB |
| Events in quadrant A | 10,027,174 | 675,935 |
| Events in quadrant B | 4,283,961 | 688,511 |
| Events in quadrant C | 11,488,160 | 430,872 |
| Events in quadrant D | 8,468,901 | 531,229 |
| Mode SS | |||
|---|---|---|---|
| Quadrant | BADHDUFLAG | Total packets | Discarded packets |
| A | 0 | 120 | 0 |
| B | 0 | 120 | 0 |
| C | 0 | 120 | 0 |
| D | 0 | 120 | 0 |
| Mode M0 | |||
|---|---|---|---|
| Quadrant | BADHDUFLAG | Total packets | Discarded packets |
| A | 0 | 33896 | 1 |
| B | 0 | 16685 | 1 |
| C | 0 | 38119 | 1 |
| D | 0 | 29311 | 1 |
| Mode M9 | |||
|---|---|---|---|
| Quadrant | BADHDUFLAG | Total packets | Discarded packets |
| A | 0 | 11 | 0 |
| B | 0 | 11 | 0 |
| C | 0 | 11 | 0 |
| D | 0 | 11 | 0 |
| Quadrant | Total seconds | Saturated seconds | Saturation percentage |
|---|---|---|---|
| A | 5916 | 1162 | 19.641650% |
| B | 5917 | 455 | 7.689708% |
| C | 5917 | 3556 | 60.098023% |
| D | 5917 | 1862 | 31.468650% |
Noise dominated data is calculated using 1-second bins in cleaned event files. If a bin has >2000 counts, and if more than 50% of those come from <1% of pixels, then it is considered to be noise-dominated and hence unusable.
| Quadrant | # 1 sec bins | Bins with >0 counts | Bins with >2000 counts | High rate bins dominated by noise | Noise dominated (total time) | Noise dominated (detector-on time) | Marked lightcurve |
|---|---|---|---|---|---|---|---|
| A | 6971 | 5918 | 707 | 707 | 10.14% | 11.95% | 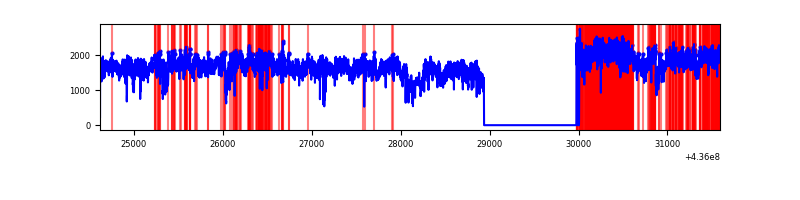 |
| B | 6972 | 5919 | 341 | 341 | 4.89% | 5.76% | 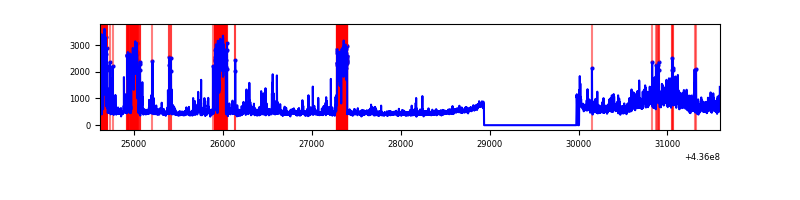 |
| C | 6972 | 5919 | 3193 | 3193 | 45.80% | 53.94% | 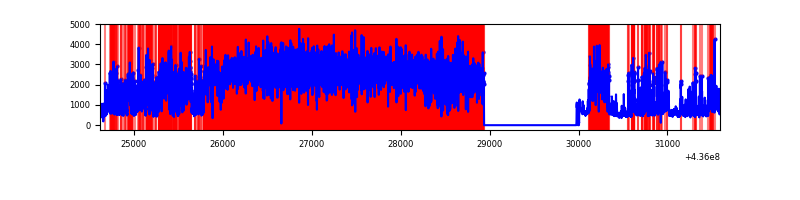 |
| D | 6972 | 5919 | 1632 | 1632 | 23.41% | 27.57% | 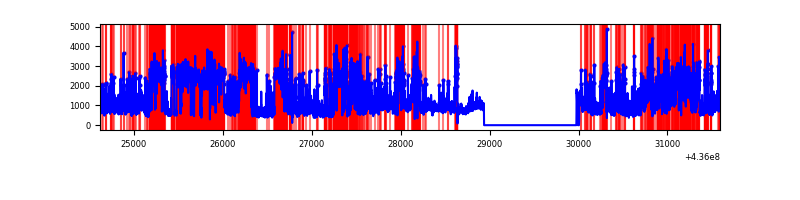 |
Top three noisy pixels from each quadrant. If the there are fewer than three noisy pixels in the level2.evt file, extra rows are filled as -1
| Pixel properties | Quadrant properties | ||||||
|---|---|---|---|---|---|---|---|
| Quadrant | DetID | PixID | Counts | Sigma | Mean | Median | Sigma |
| A | 15 | 222 | 6459141 | 48741.7 | 651 | 638 | 132.5 |
| A | 10 | 83 | 777088 | 5859.79 | 651 | 638 | 132.5 |
| A | 14 | 63 | 153288 | 1152.03 | 651 | 638 | 132.5 |
| B | 10 | 244 | 534195 | 4229.82 | 658 | 638 | 126.1 |
| B | 4 | 206 | 501996 | 3974.56 | 658 | 638 | 126.1 |
| B | 15 | 54 | 213143 | 1684.65 | 658 | 638 | 126.1 |
| C | 15 | 142 | 7865212 | 75975.18 | 442 | 444 | 103.5 |
| C | 15 | 158 | 1099618 | 10618.23 | 442 | 444 | 103.5 |
| C | 15 | 157 | 581042 | 5608.69 | 442 | 444 | 103.5 |
| D | 13 | 187 | 2418240 | 15695.81 | 589 | 568 | 154.0 |
| D | 1 | 52 | 657784 | 4266.72 | 589 | 568 | 154.0 |
| D | 7 | 80 | 552805 | 3585.19 | 589 | 568 | 154.0 |
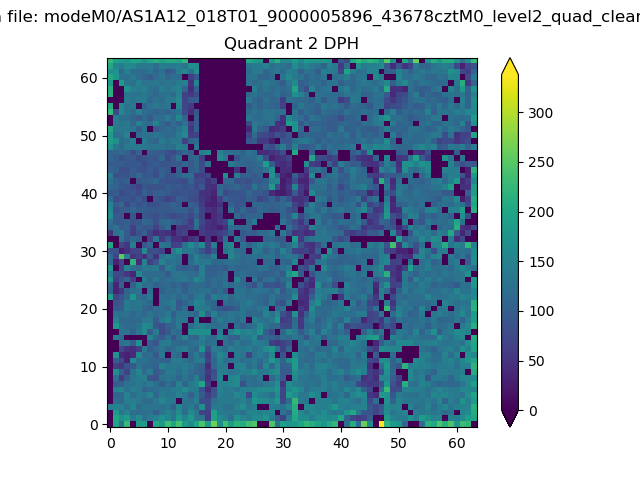
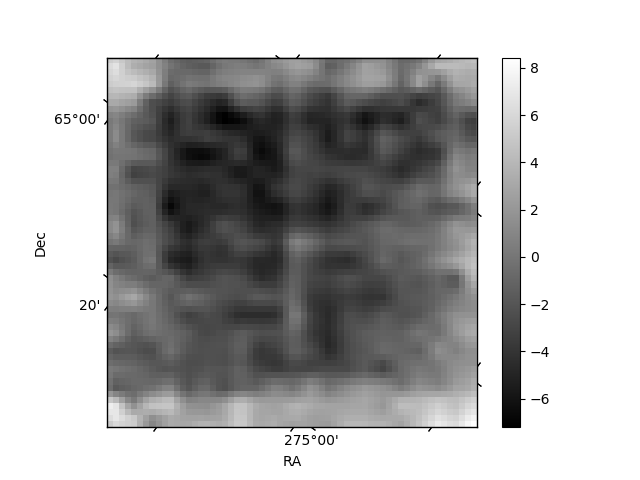
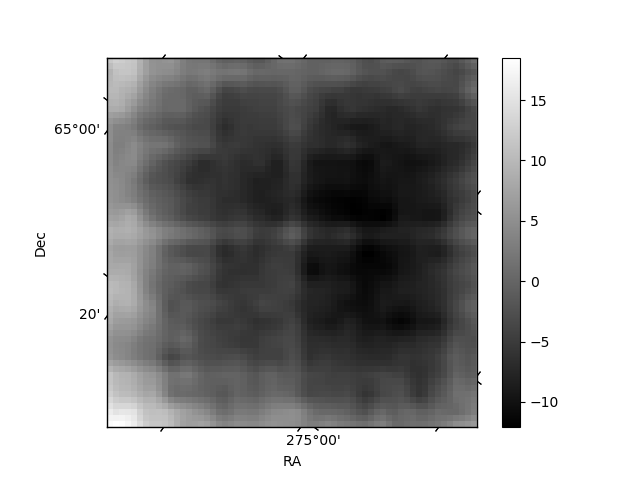
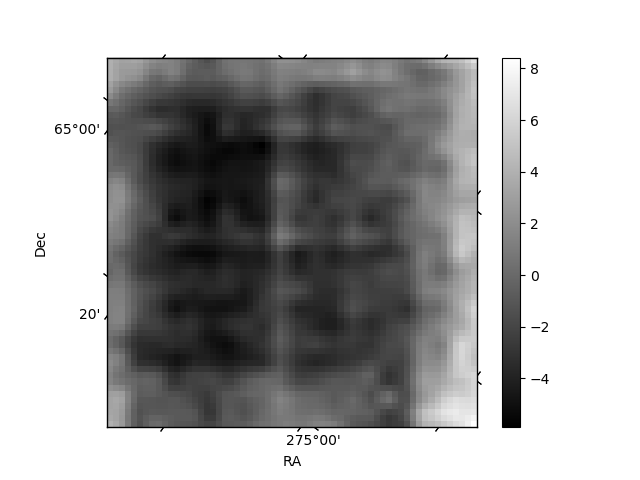
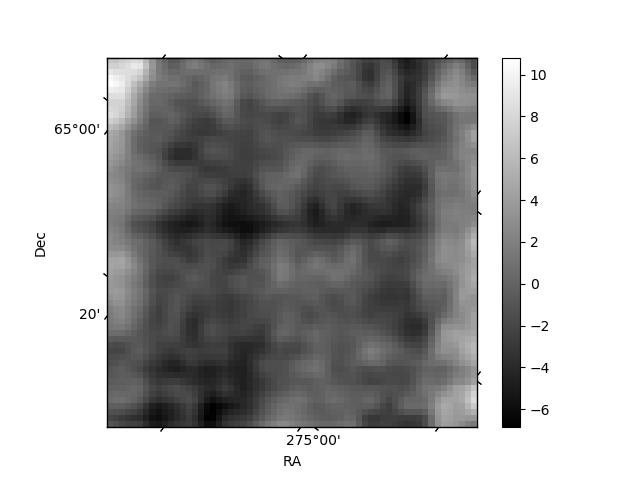
Histogram calculated using DETX and DETY for each event in the final _common_clean file
| Quadrant A | 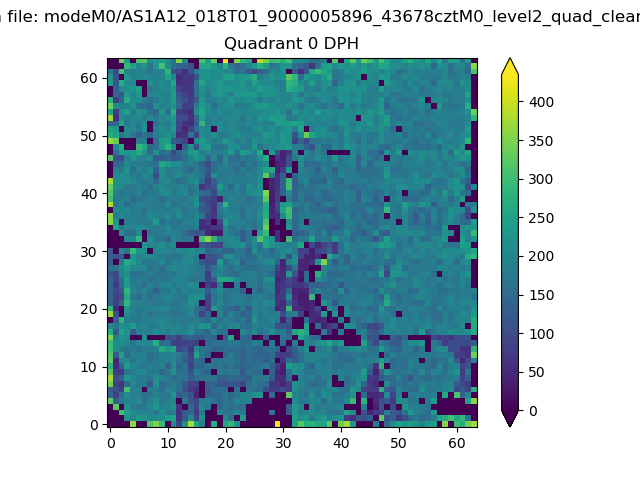 |
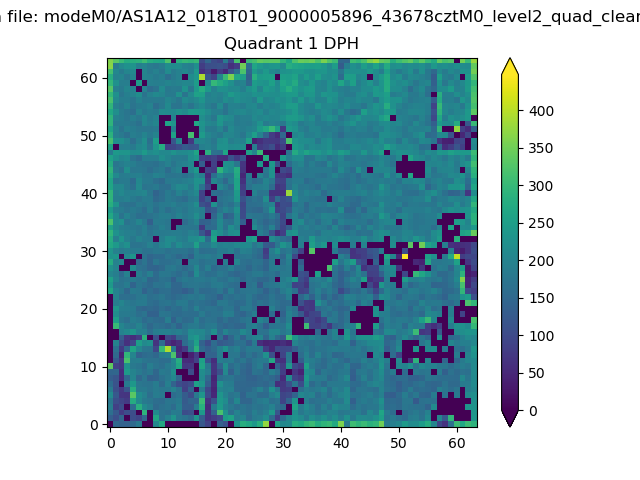 |
Quadrant B |
|---|---|---|---|
| Quadrant D | 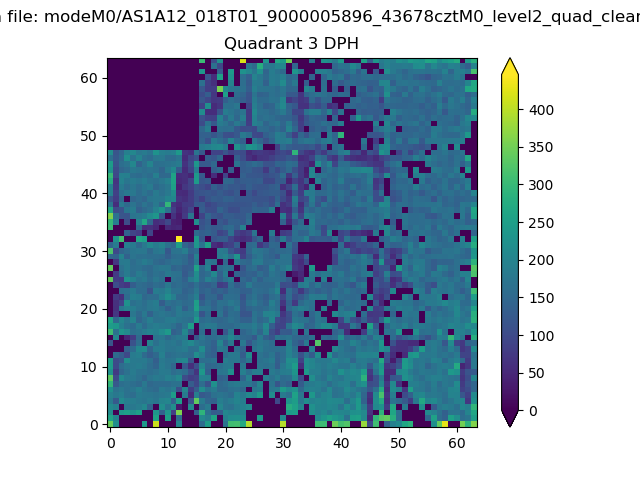 |
 |
Quadrant C |
| Plot type | Count rate plots | Images |
|---|---|---|
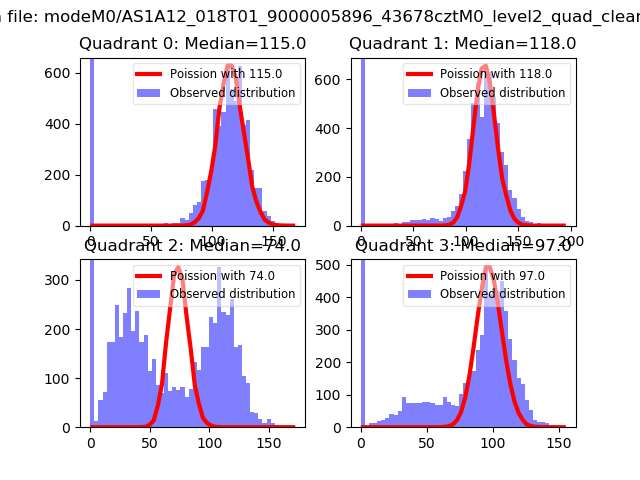
| Comparison with Poisson distribution Blue bars denote a histogram of data divided into 1 sec bins. Red curve is a Poisson curve with rate = median count rate of data. |
 |
 |
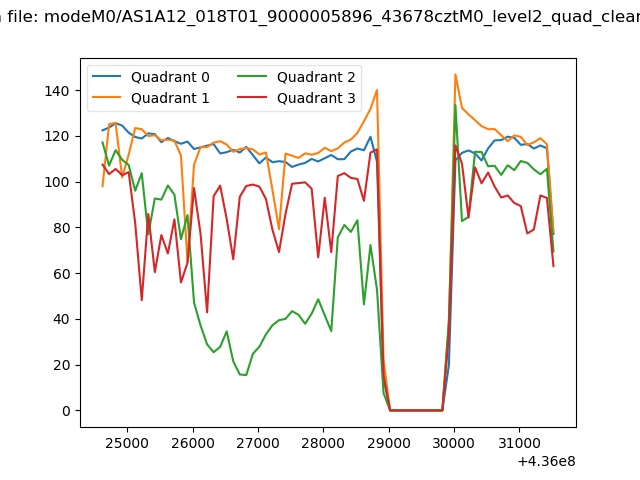
| Quadrant-wise count rates Data is divided into 100 sec bins |
 |
|
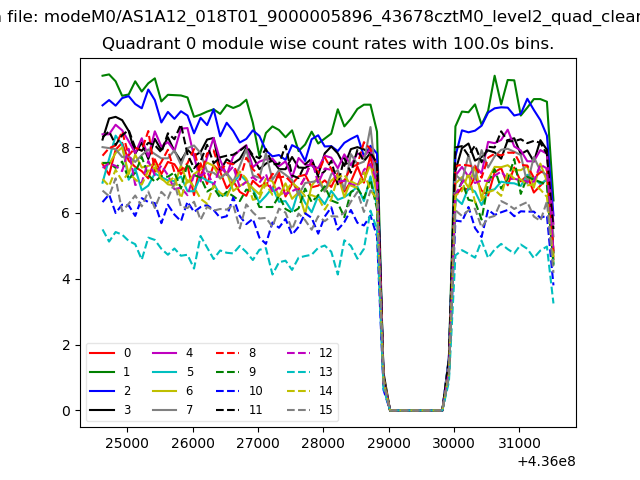
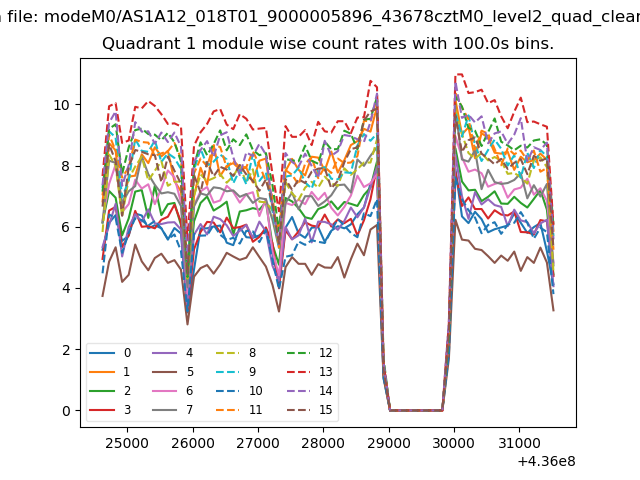
| Module-wise count rates for Quadrant A Data is divided into 100 sec bins |
 |
 |
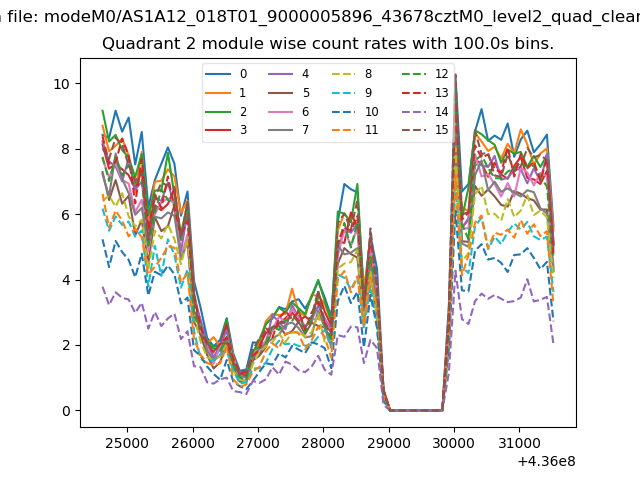
| Module-wise count rates for Quadrant B Data is divided into 100 sec bins |
 |
 |
| Module-wise count rates for Quadrant C Data is divided into 100 sec bins |
 |
 |
| Module-wise count rates for Quadrant D Data is divided into 100 sec bins |
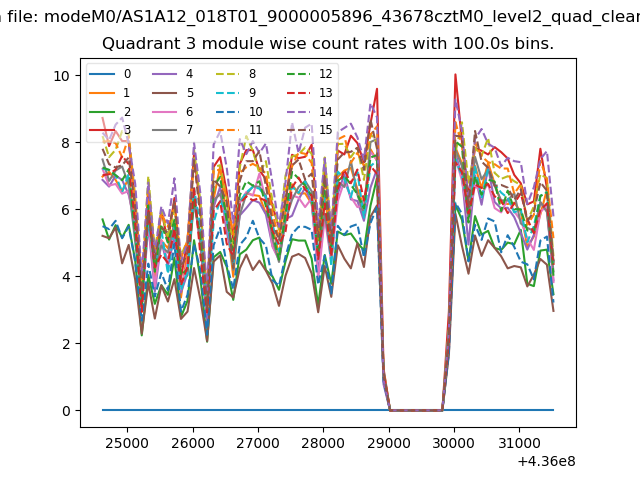 |
 |
| Parameter | Plot |
|---|---|
| CZT HV Monitor | 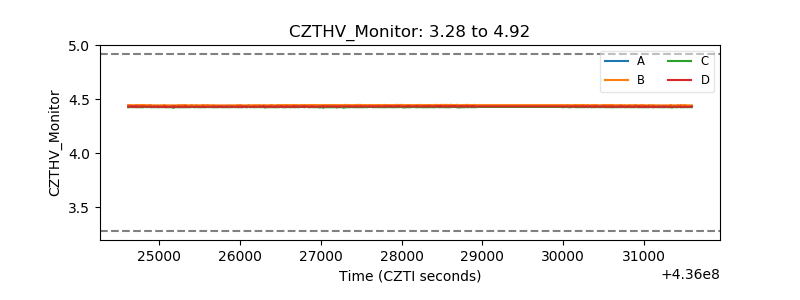 |
| D_VDD | 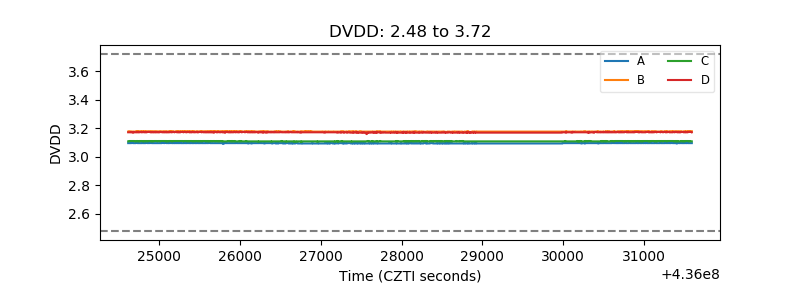 |
| Temperature 1 | 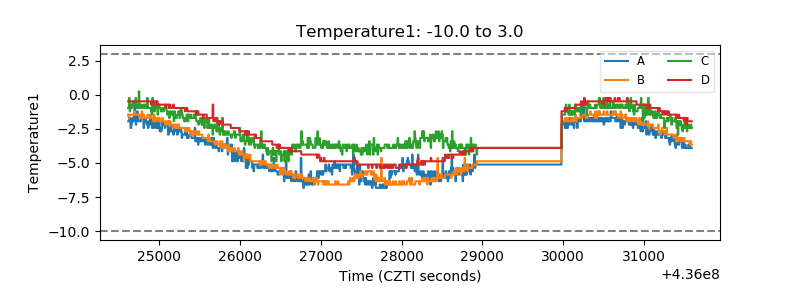 |
| Veto HV Monitor |  |
| Veto LLD | 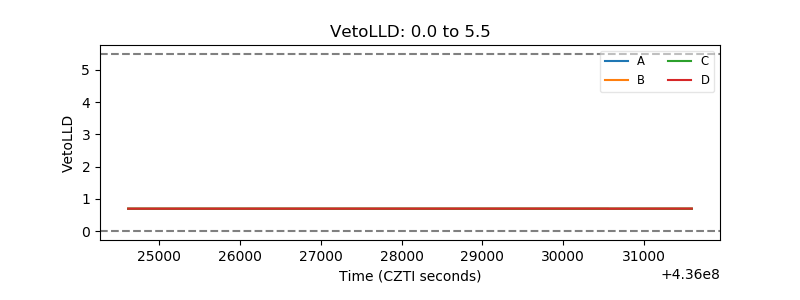 |
| Alpha Counter | 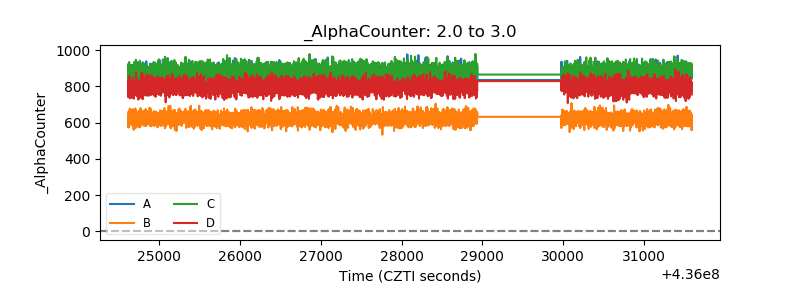 |
| _CPM_Rate | 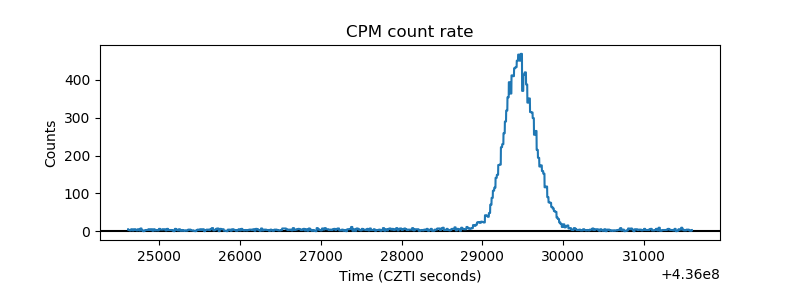 |
| CZT Counter | 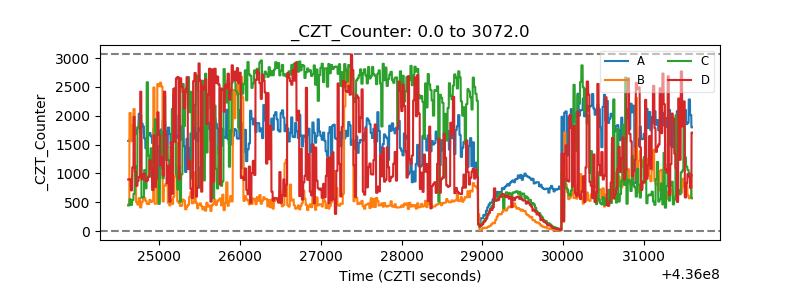 |
| +2.5 Volts monitor | 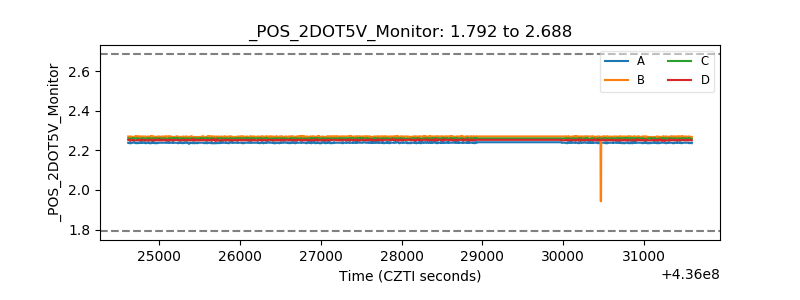 |
| +5 Volts monitor | 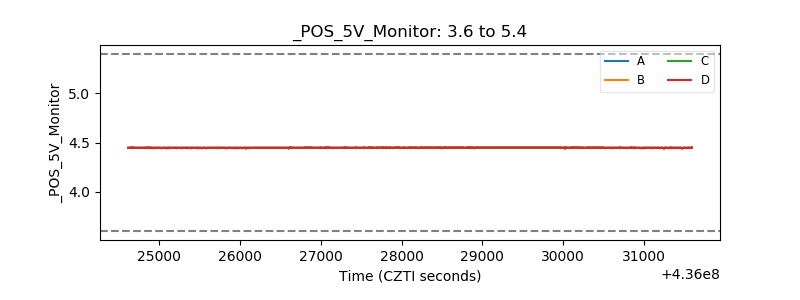 |
| _ROLL_ROT | 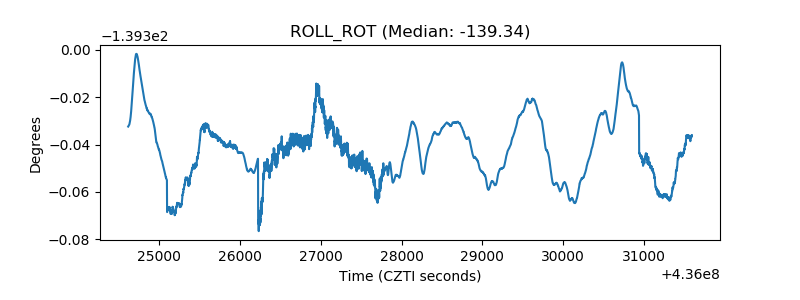 |
| _Roll_DEC | 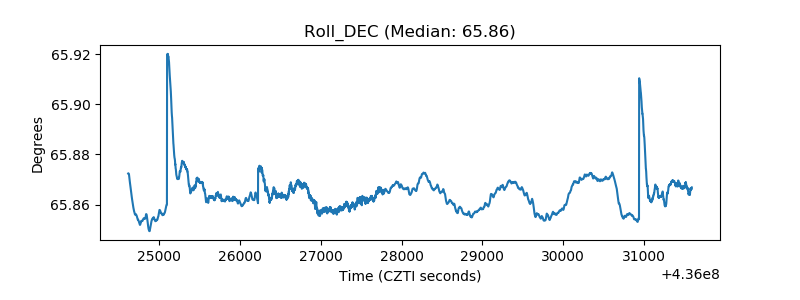 |
| _Roll_RA | 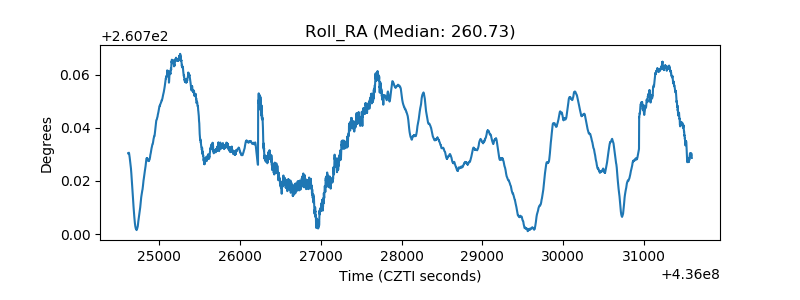 |
| Veto Counter | 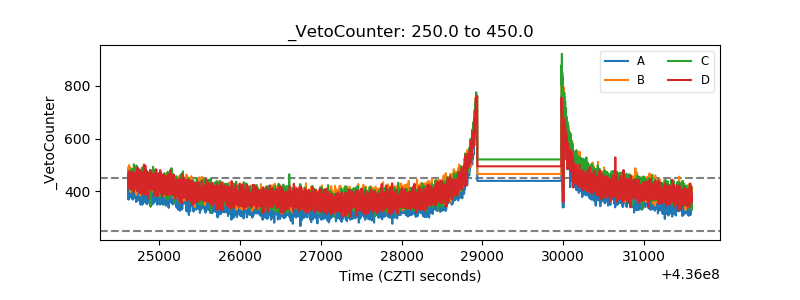 |