| Param | Original file | Final file |
|---|---|---|
| Filename | modeM0/AS1A12_018T01_9000005896_43679cztM0_level2.fits | modeM0/AS1A12_018T01_9000005896_43679cztM0_level2_quad_clean.evt |
| Size (bytes) | 935,737,920 | 92,073,600 |
| Size | 892.4 MB | 87.8 MB |
| Events in quadrant A | 10,737,764 | 673,673 |
| Events in quadrant B | 4,128,291 | 698,140 |
| Events in quadrant C | 11,253,524 | 459,402 |
| Events in quadrant D | 8,048,717 | 527,650 |
| Mode SS | |||
|---|---|---|---|
| Quadrant | BADHDUFLAG | Total packets | Discarded packets |
| A | 0 | 124 | 0 |
| B | 0 | 124 | 0 |
| C | 0 | 124 | 0 |
| D | 0 | 124 | 0 |
| Mode M0 | |||
|---|---|---|---|
| Quadrant | BADHDUFLAG | Total packets | Discarded packets |
| A | 0 | 36132 | 1 |
| B | 0 | 16472 | 1 |
| C | 0 | 37579 | 1 |
| D | 0 | 28123 | 1 |
| Mode M9 | |||
|---|---|---|---|
| Quadrant | BADHDUFLAG | Total packets | Discarded packets |
| A | 0 | 9 | 0 |
| B | 0 | 9 | 0 |
| C | 0 | 9 | 0 |
| D | 0 | 9 | 0 |
| Quadrant | Total seconds | Saturated seconds | Saturation percentage |
|---|---|---|---|
| A | 6101 | 1276 | 20.914604% |
| B | 6101 | 146 | 2.393050% |
| C | 6101 | 3465 | 56.793968% |
| D | 6101 | 1600 | 26.225209% |
Noise dominated data is calculated using 1-second bins in cleaned event files. If a bin has >2000 counts, and if more than 50% of those come from <1% of pixels, then it is considered to be noise-dominated and hence unusable.
| Quadrant | # 1 sec bins | Bins with >0 counts | Bins with >2000 counts | High rate bins dominated by noise | Noise dominated (total time) | Noise dominated (detector-on time) | Marked lightcurve |
|---|---|---|---|---|---|---|---|
| A | 6976 | 6102 | 798 | 798 | 11.44% | 13.08% | 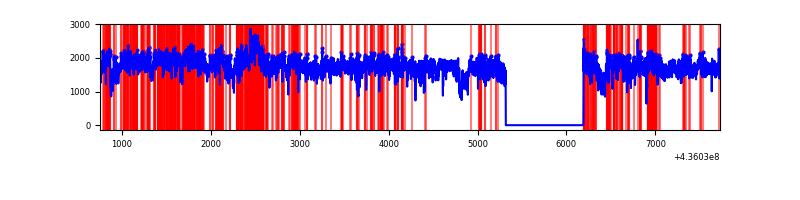 |
| B | 6976 | 6102 | 47 | 47 | 0.67% | 0.77% | 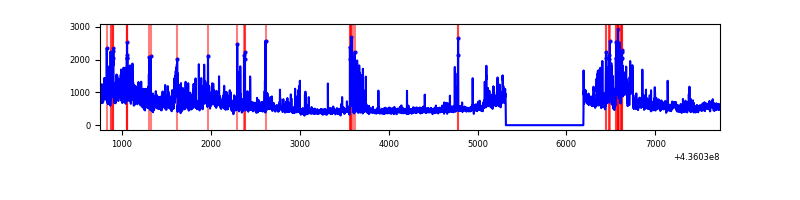 |
| C | 6976 | 6102 | 2827 | 2827 | 40.52% | 46.33% | 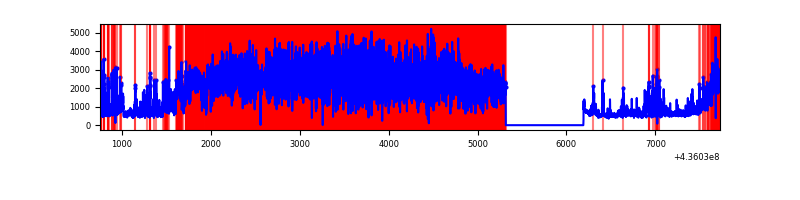 |
| D | 6976 | 6102 | 1411 | 1411 | 20.23% | 23.12% | 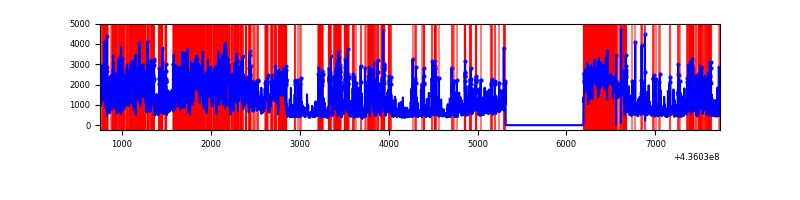 |
Top three noisy pixels from each quadrant. If the there are fewer than three noisy pixels in the level2.evt file, extra rows are filled as -1
| Pixel properties | Quadrant properties | ||||||
|---|---|---|---|---|---|---|---|
| Quadrant | DetID | PixID | Counts | Sigma | Mean | Median | Sigma |
| A | 15 | 222 | 7105783 | 53850.79 | 654 | 641 | 131.9 |
| A | 10 | 83 | 806378 | 6106.79 | 654 | 641 | 131.9 |
| A | 15 | 223 | 192215 | 1451.96 | 654 | 641 | 131.9 |
| B | 4 | 206 | 938088 | 7196.81 | 677 | 658 | 130.3 |
| B | 4 | 171 | 168341 | 1287.33 | 677 | 658 | 130.3 |
| B | 5 | 235 | 123961 | 946.62 | 677 | 658 | 130.3 |
| C | 15 | 142 | 6963928 | 62305.36 | 475 | 476 | 111.8 |
| C | 15 | 158 | 1582766 | 14157.51 | 475 | 476 | 111.8 |
| C | 15 | 157 | 369476 | 3301.62 | 475 | 476 | 111.8 |
| D | 2 | 249 | 1472245 | 9164.27 | 578 | 563 | 160.6 |
| D | 13 | 187 | 1204329 | 7495.94 | 578 | 563 | 160.6 |
| D | 7 | 80 | 570498 | 3549.03 | 578 | 563 | 160.6 |
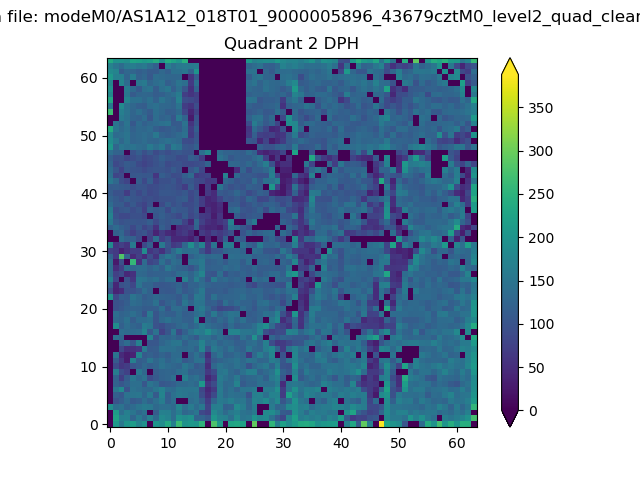
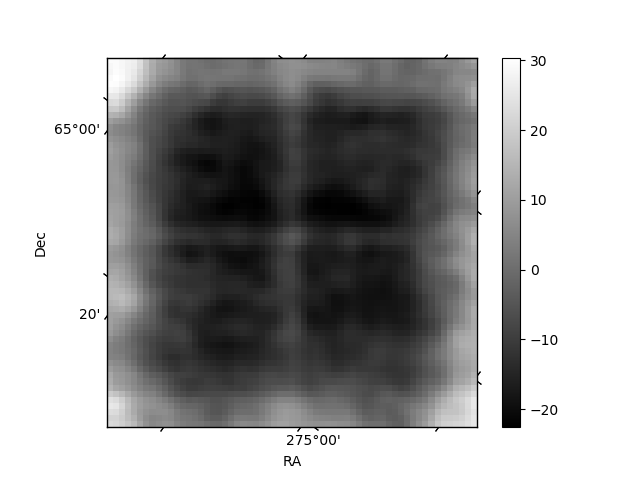
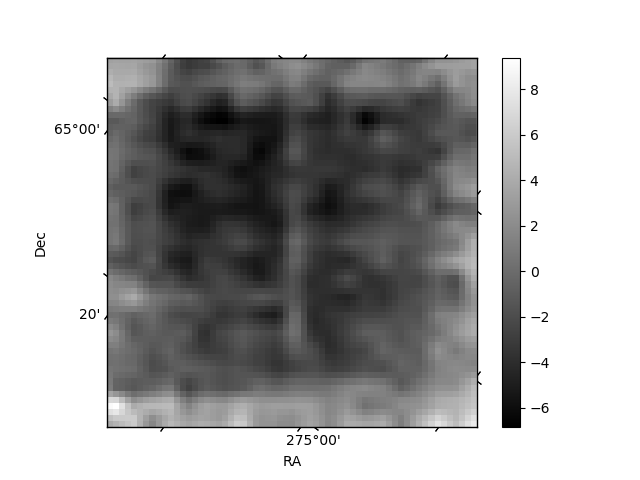
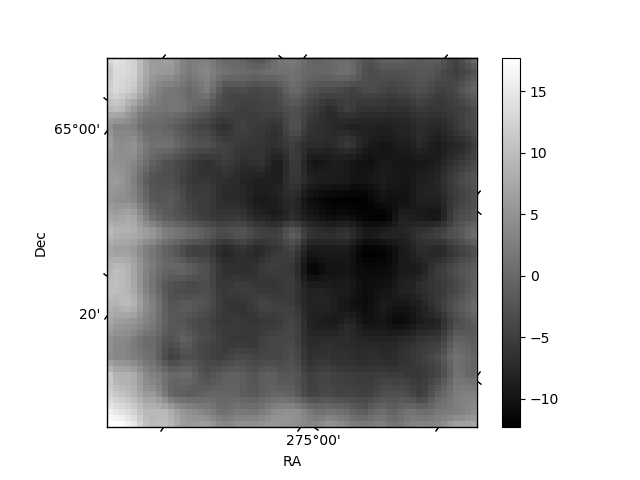
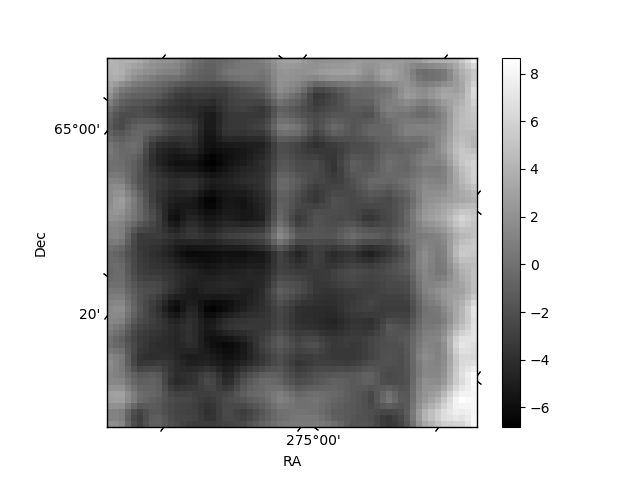
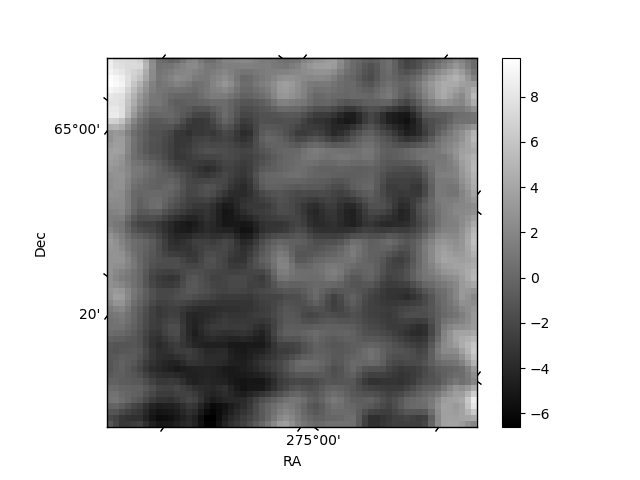
Histogram calculated using DETX and DETY for each event in the final _common_clean file
| Quadrant A | 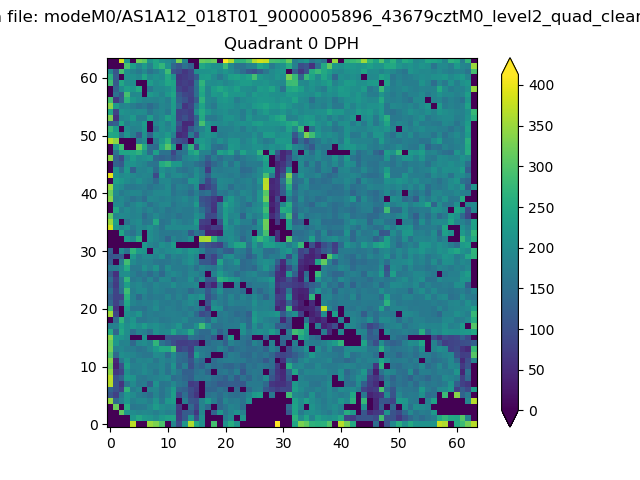 |
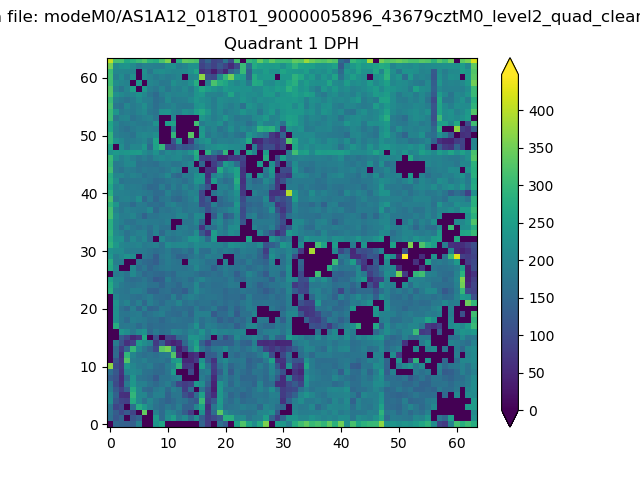 |
Quadrant B |
|---|---|---|---|
| Quadrant D | 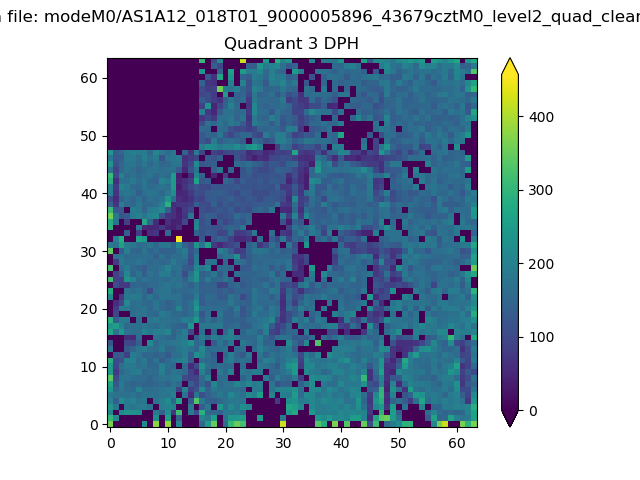 |
 |
Quadrant C |
| Plot type | Count rate plots | Images |
|---|---|---|
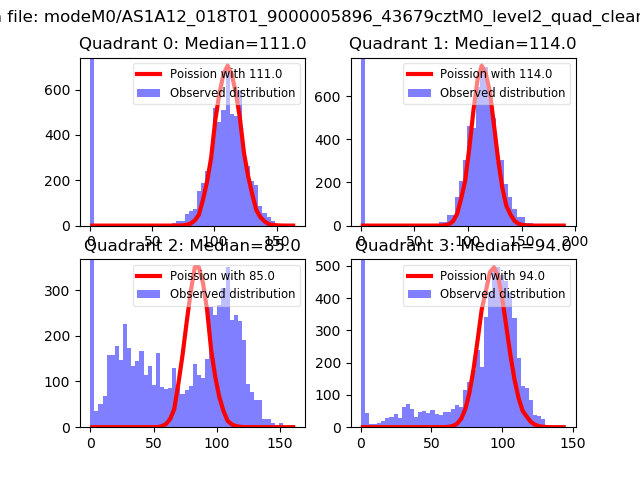
| Comparison with Poisson distribution Blue bars denote a histogram of data divided into 1 sec bins. Red curve is a Poisson curve with rate = median count rate of data. |
 |
 |
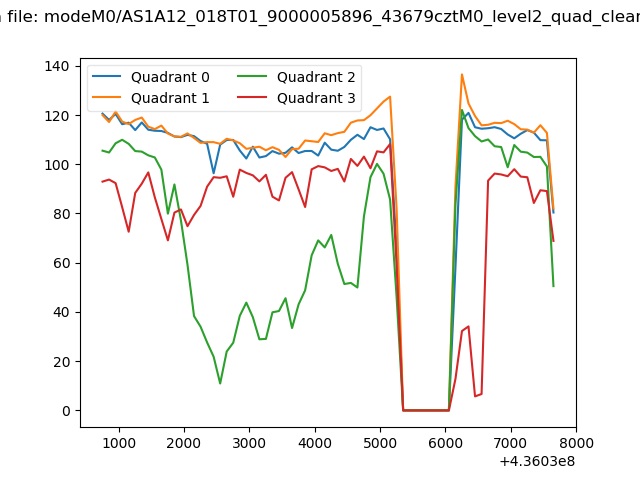
| Quadrant-wise count rates Data is divided into 100 sec bins |
 |
|
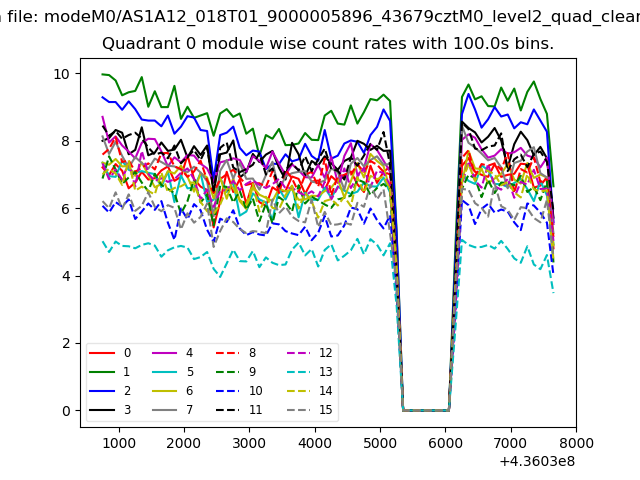
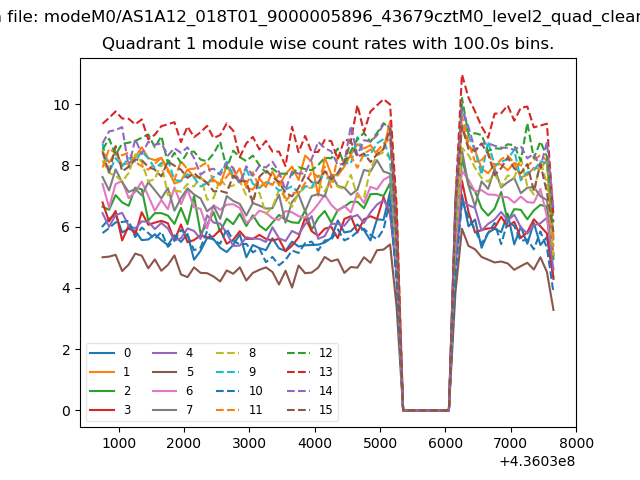
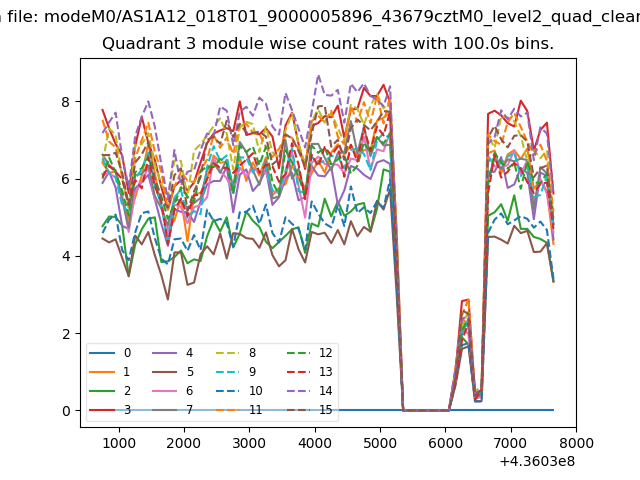
| Module-wise count rates for Quadrant A Data is divided into 100 sec bins |
 |
 |
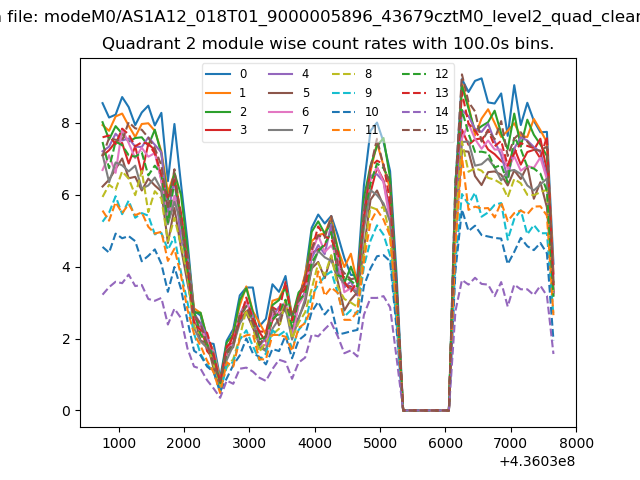
| Module-wise count rates for Quadrant B Data is divided into 100 sec bins |
 |
 |
| Module-wise count rates for Quadrant C Data is divided into 100 sec bins |
 |
 |
| Module-wise count rates for Quadrant D Data is divided into 100 sec bins |
 |
 |
| Parameter | Plot |
|---|---|
| CZT HV Monitor | 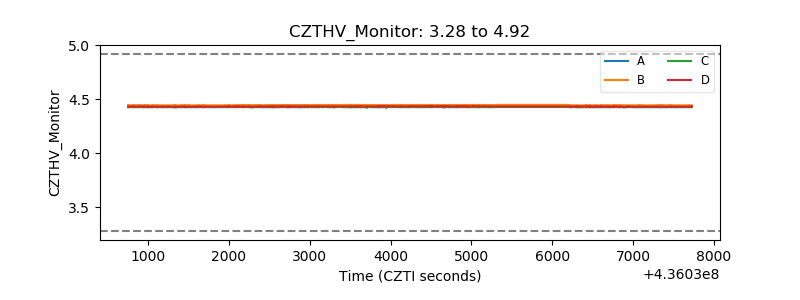 |
| D_VDD | 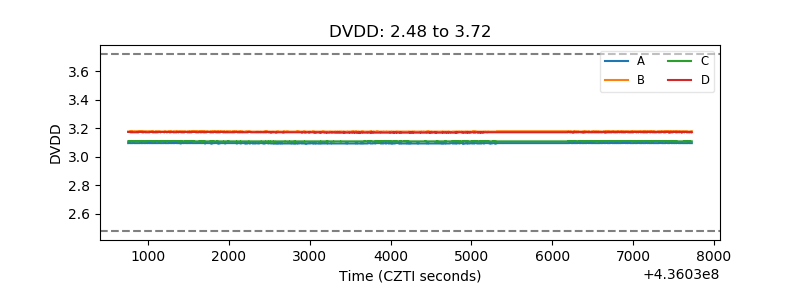 |
| Temperature 1 | 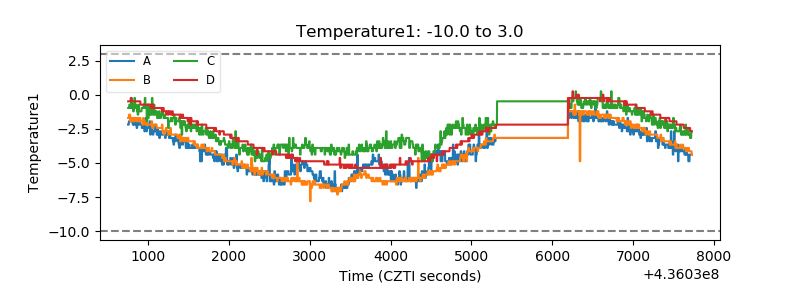 |
| Veto HV Monitor | 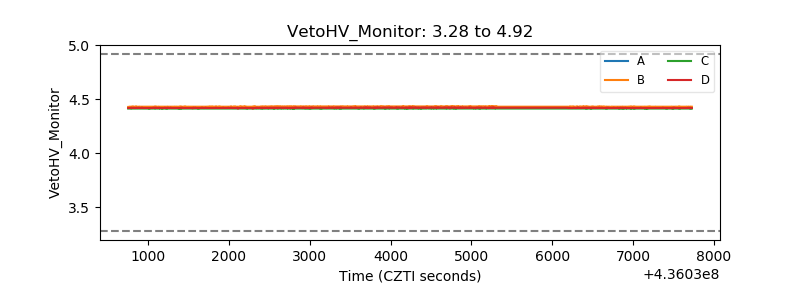 |
| Veto LLD | 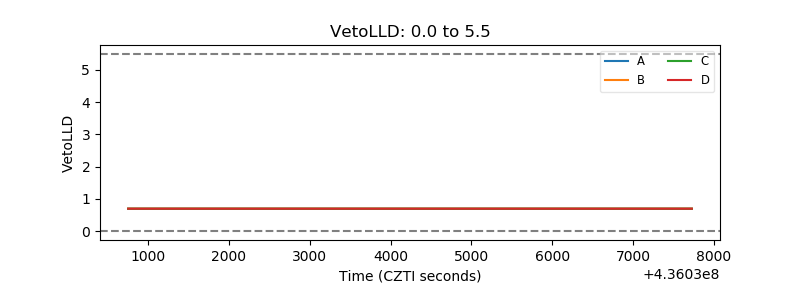 |
| Alpha Counter | 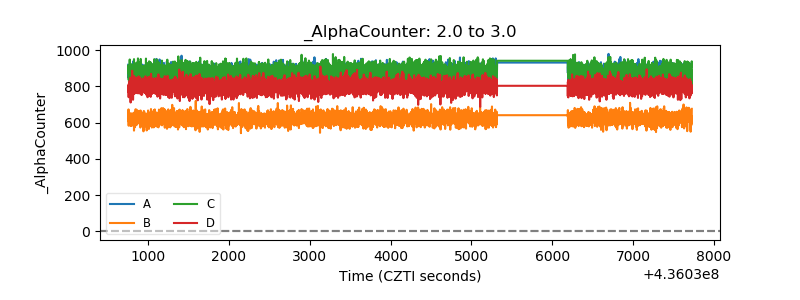 |
| _CPM_Rate | 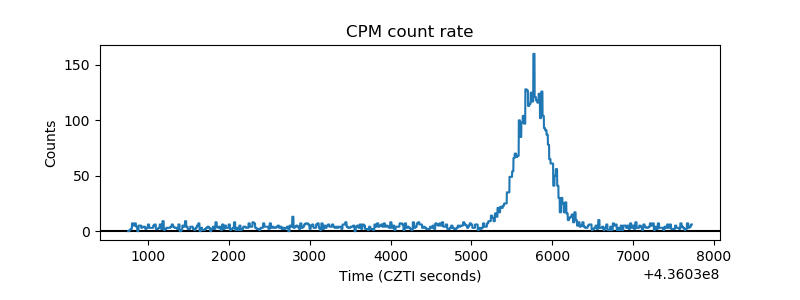 |
| CZT Counter | 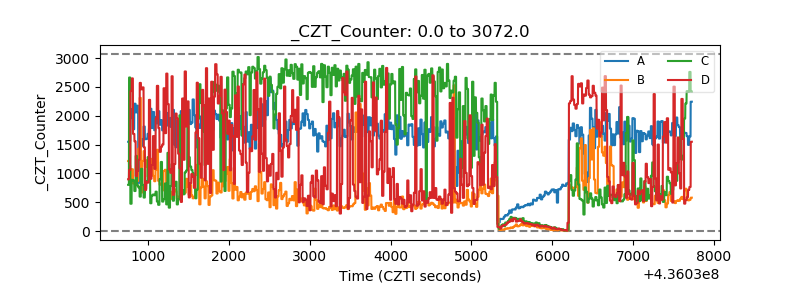 |
| +2.5 Volts monitor | 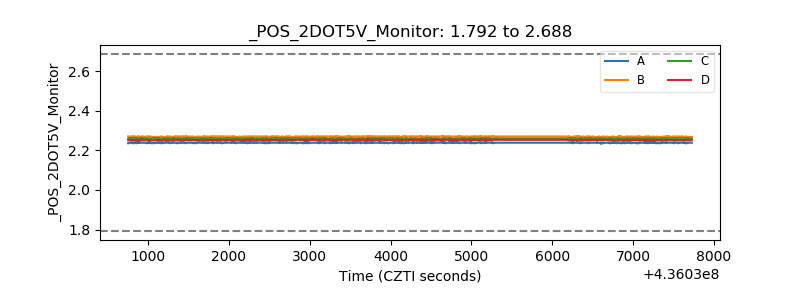 |
| +5 Volts monitor | 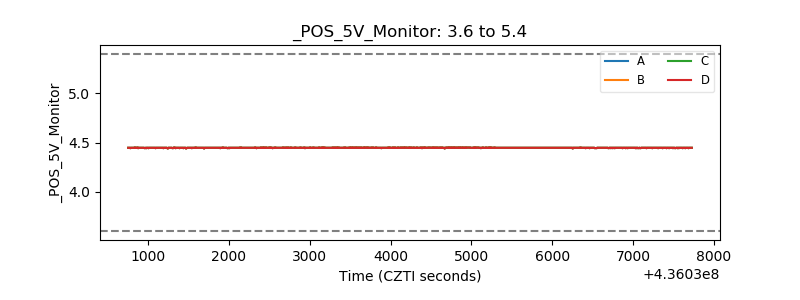 |
| _ROLL_ROT | 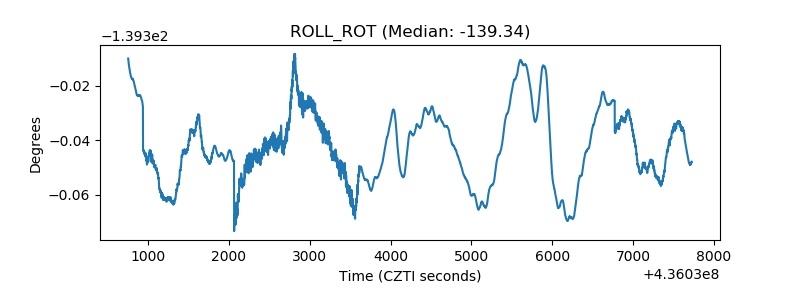 |
| _Roll_DEC | 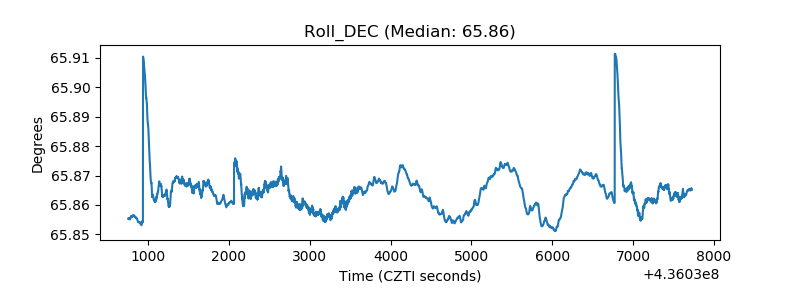 |
| _Roll_RA | 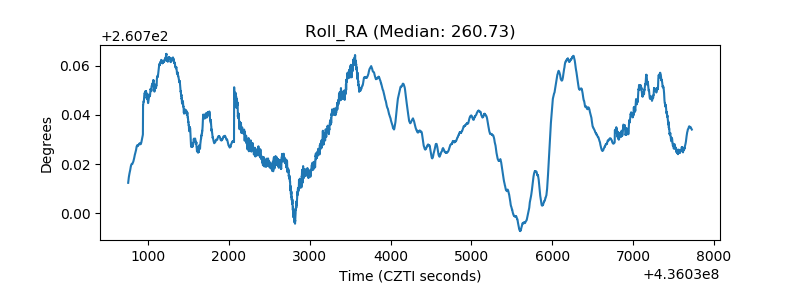 |
| Veto Counter | 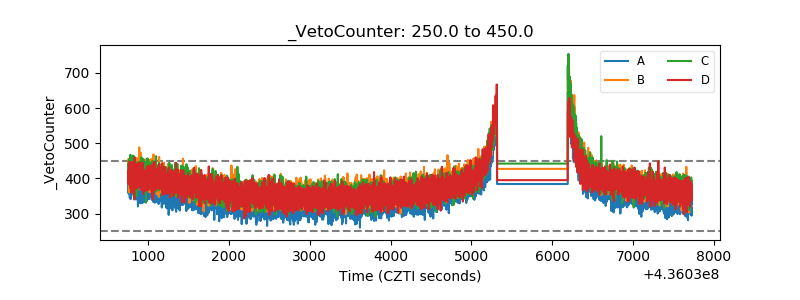 |