| Param | Original file | Final file |
|---|---|---|
| Filename | modeM0/AS1A12_018T01_9000005896_43680cztM0_level2.fits | modeM0/AS1A12_018T01_9000005896_43680cztM0_level2_quad_clean.evt |
| Size (bytes) | 949,167,360 | 98,421,120 |
| Size | 905.2 MB | 93.9 MB |
| Events in quadrant A | 10,382,115 | 720,093 |
| Events in quadrant B | 4,162,312 | 740,585 |
| Events in quadrant C | 13,574,840 | 437,382 |
| Events in quadrant D | 6,500,294 | 612,757 |
| Mode SS | |||
|---|---|---|---|
| Quadrant | BADHDUFLAG | Total packets | Discarded packets |
| A | 0 | 136 | 0 |
| B | 0 | 136 | 0 |
| C | 0 | 136 | 0 |
| D | 0 | 136 | 0 |
| Mode M0 | |||
|---|---|---|---|
| Quadrant | BADHDUFLAG | Total packets | Discarded packets |
| A | 0 | 35528 | 1 |
| B | 0 | 16852 | 1 |
| C | 0 | 45017 | 2 |
| D | 0 | 23964 | 1 |
| Mode M9 | |||
|---|---|---|---|
| Quadrant | BADHDUFLAG | Total packets | Discarded packets |
| A | 0 | 5 | 0 |
| B | 0 | 5 | 0 |
| C | 0 | 5 | 0 |
| D | 0 | 5 | 0 |
| Quadrant | Total seconds | Saturated seconds | Saturation percentage |
|---|---|---|---|
| A | 6685 | 976 | 14.599850% |
| B | 6686 | 270 | 4.038289% |
| C | 6685 | 4428 | 66.237846% |
| D | 6685 | 934 | 13.971578% |
Noise dominated data is calculated using 1-second bins in cleaned event files. If a bin has >2000 counts, and if more than 50% of those come from <1% of pixels, then it is considered to be noise-dominated and hence unusable.
| Quadrant | # 1 sec bins | Bins with >0 counts | Bins with >2000 counts | High rate bins dominated by noise | Noise dominated (total time) | Noise dominated (detector-on time) | Marked lightcurve |
|---|---|---|---|---|---|---|---|
| A | 7195 | 6686 | 504 | 504 | 7.00% | 7.54% | 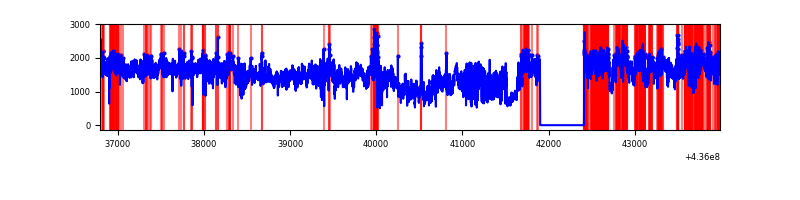 |
| B | 7196 | 6687 | 114 | 114 | 1.58% | 1.70% | 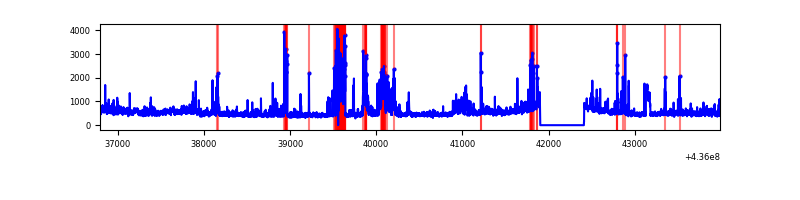 |
| C | 7195 | 6686 | 3632 | 3632 | 50.48% | 54.32% | 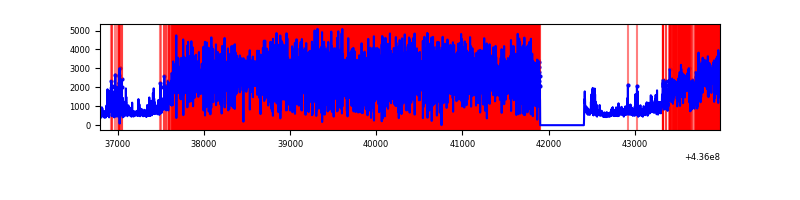 |
| D | 7195 | 6686 | 611 | 611 | 8.49% | 9.14% | 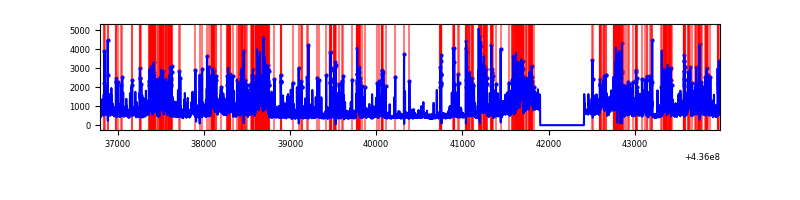 |
Top three noisy pixels from each quadrant. If the there are fewer than three noisy pixels in the level2.evt file, extra rows are filled as -1
| Pixel properties | Quadrant properties | ||||||
|---|---|---|---|---|---|---|---|
| Quadrant | DetID | PixID | Counts | Sigma | Mean | Median | Sigma |
| A | 15 | 222 | 6078393 | 41399.71 | 714 | 700 | 146.8 |
| A | 10 | 83 | 834665 | 5680.76 | 714 | 700 | 146.8 |
| A | 15 | 223 | 446539 | 3036.94 | 714 | 700 | 146.8 |
| B | 0 | 219 | 377300 | 2664.25 | 731 | 711 | 141.3 |
| B | 5 | 235 | 246235 | 1737.0 | 731 | 711 | 141.3 |
| B | 4 | 171 | 208064 | 1466.95 | 731 | 711 | 141.3 |
| C | 15 | 142 | 9334220 | 85431.29 | 461 | 462 | 109.3 |
| C | 15 | 158 | 1364916 | 12488.76 | 461 | 462 | 109.3 |
| C | 15 | 157 | 627948 | 5743.34 | 461 | 462 | 109.3 |
| D | 2 | 249 | 888668 | 5033.64 | 688 | 668 | 176.4 |
| D | 1 | 52 | 471711 | 2670.12 | 688 | 668 | 176.4 |
| D | 13 | 249 | 387594 | 2193.3 | 688 | 668 | 176.4 |
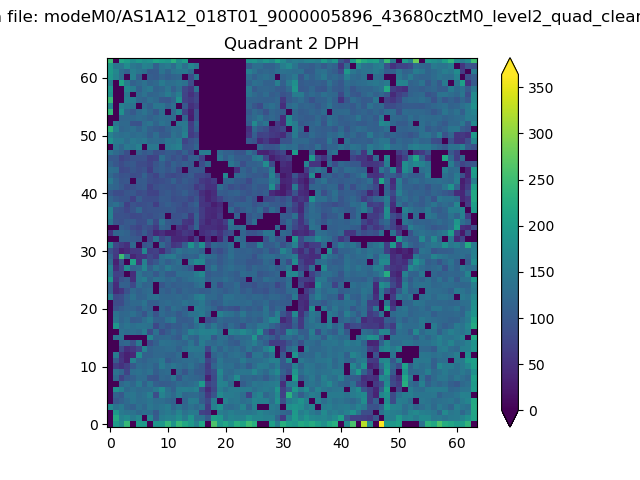
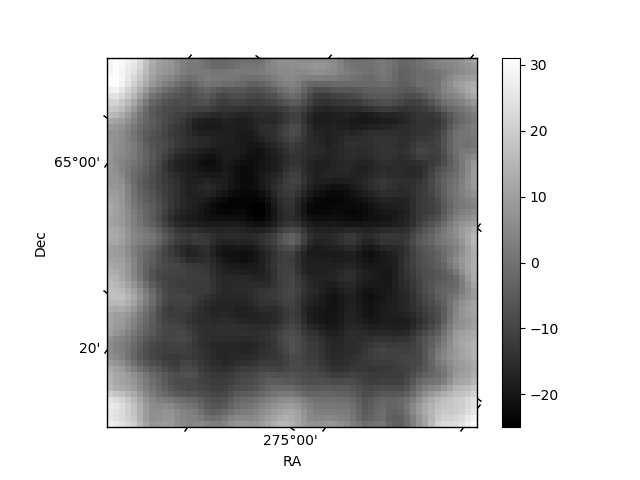
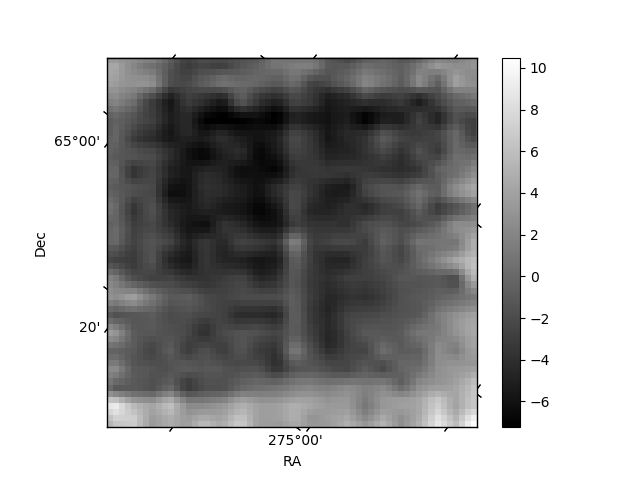
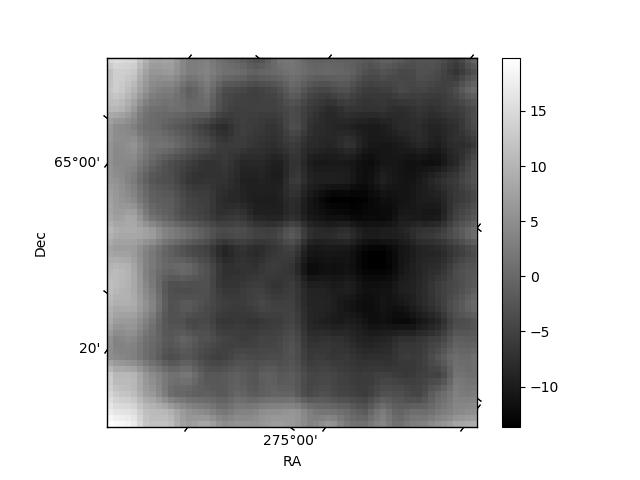
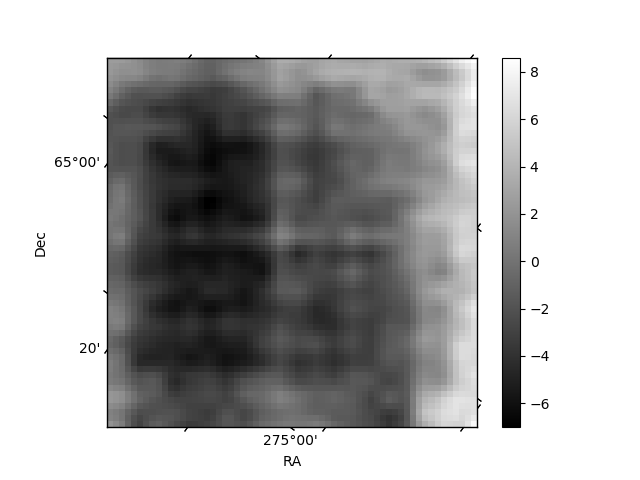
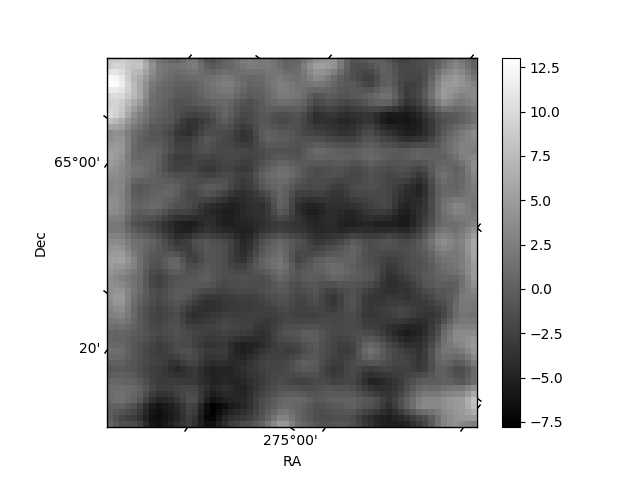
Histogram calculated using DETX and DETY for each event in the final _common_clean file
| Quadrant A | 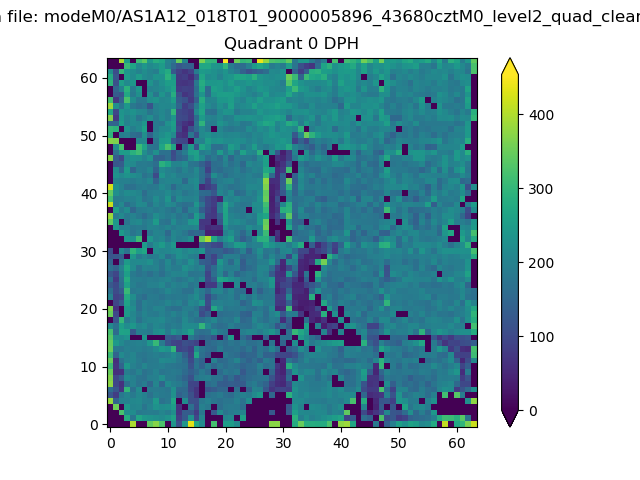 |
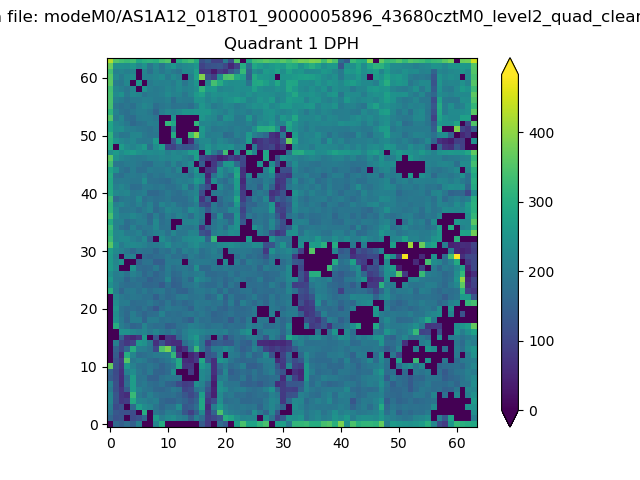 |
Quadrant B |
|---|---|---|---|
| Quadrant D | 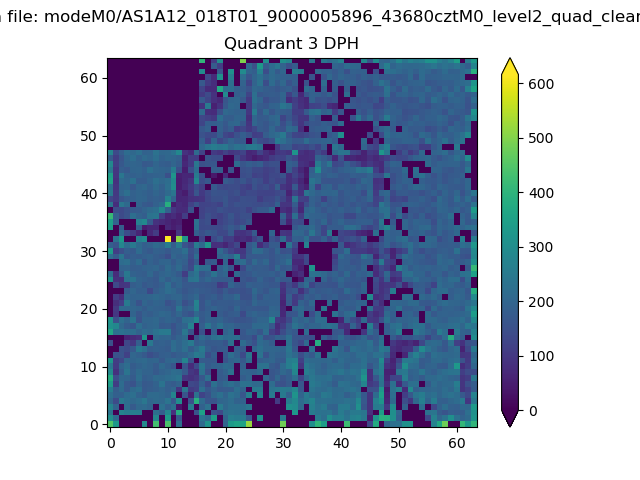 |
 |
Quadrant C |
| Plot type | Count rate plots | Images |
|---|---|---|
| Comparison with Poisson distribution Blue bars denote a histogram of data divided into 1 sec bins. Red curve is a Poisson curve with rate = median count rate of data. |
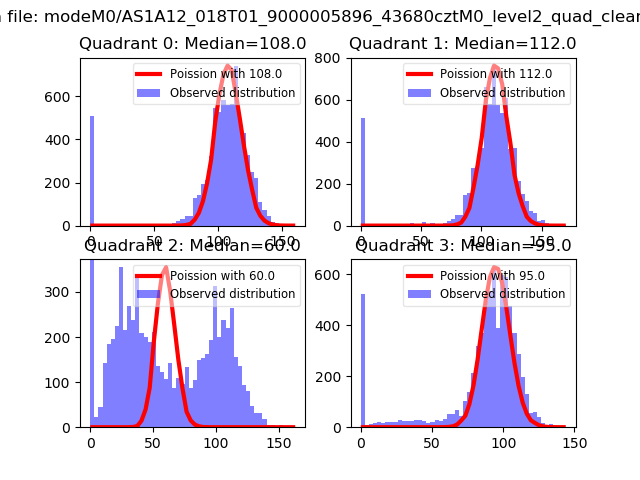 |
 |
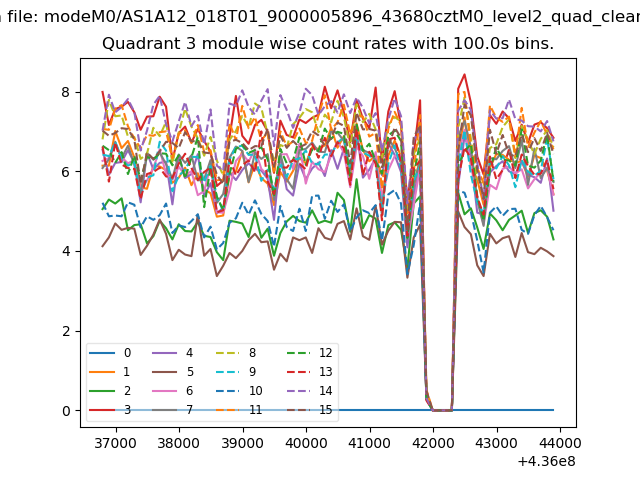
| Quadrant-wise count rates Data is divided into 100 sec bins |
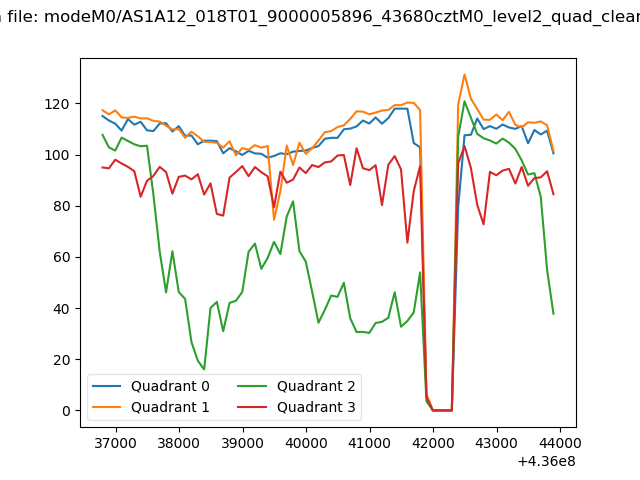 |
|
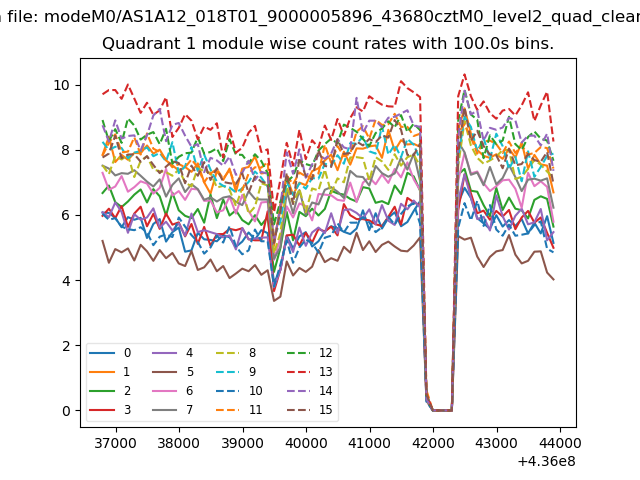
| Module-wise count rates for Quadrant A Data is divided into 100 sec bins |
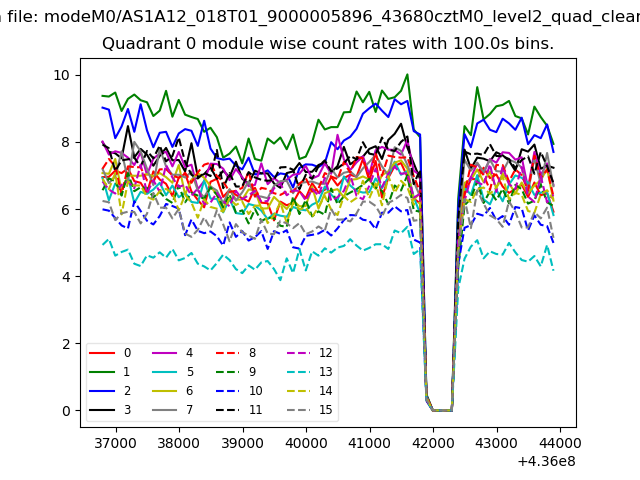 |
 |
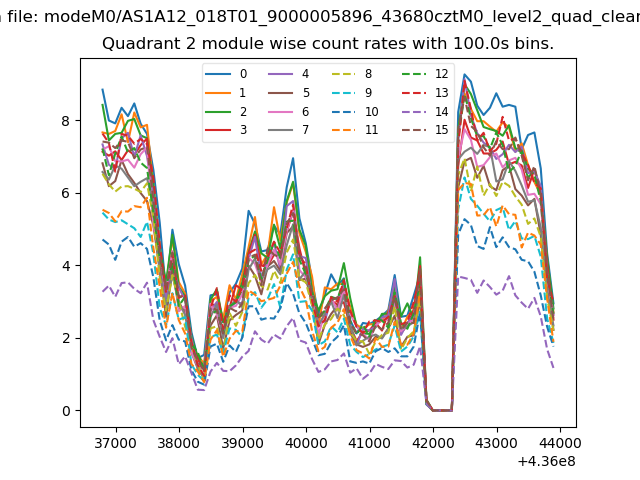
| Module-wise count rates for Quadrant B Data is divided into 100 sec bins |
 |
 |
| Module-wise count rates for Quadrant C Data is divided into 100 sec bins |
 |
 |
| Module-wise count rates for Quadrant D Data is divided into 100 sec bins |
 |
 |
| Parameter | Plot |
|---|---|
| CZT HV Monitor | 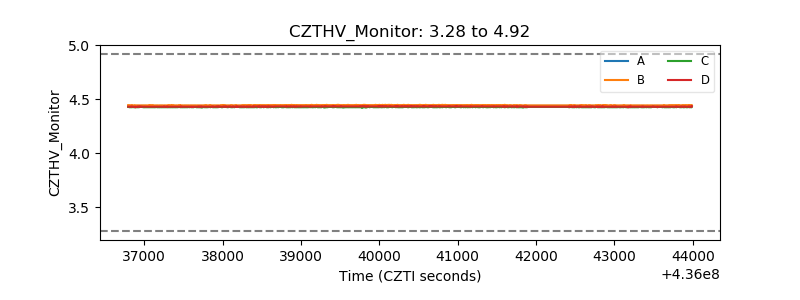 |
| D_VDD | 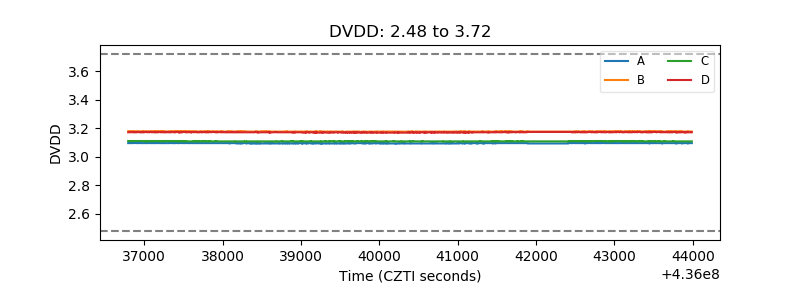 |
| Temperature 1 | 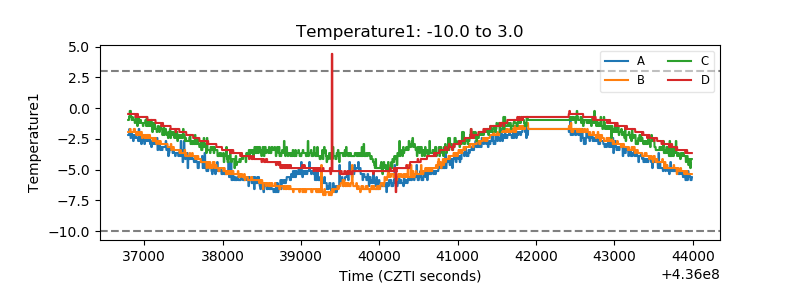 |
| Veto HV Monitor | 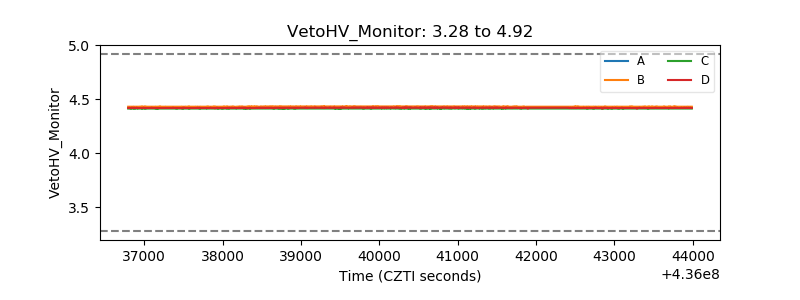 |
| Veto LLD | 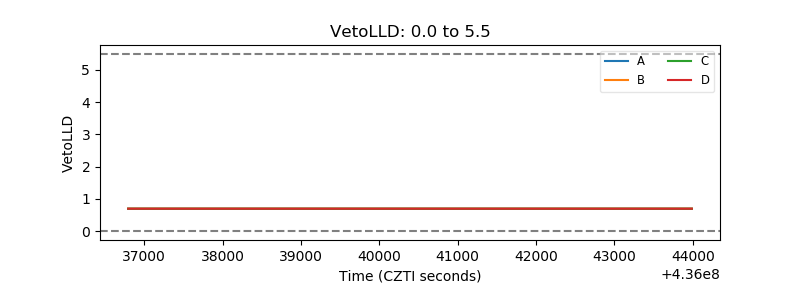 |
| Alpha Counter | 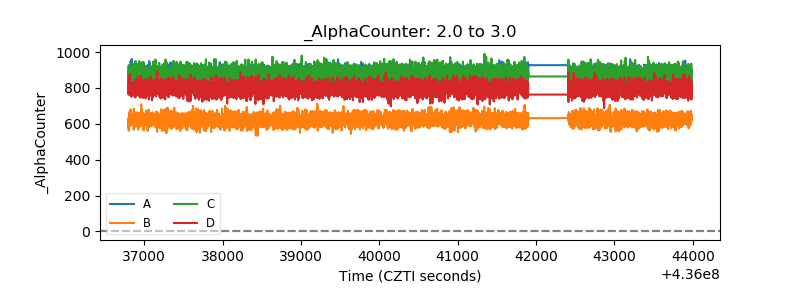 |
| _CPM_Rate | 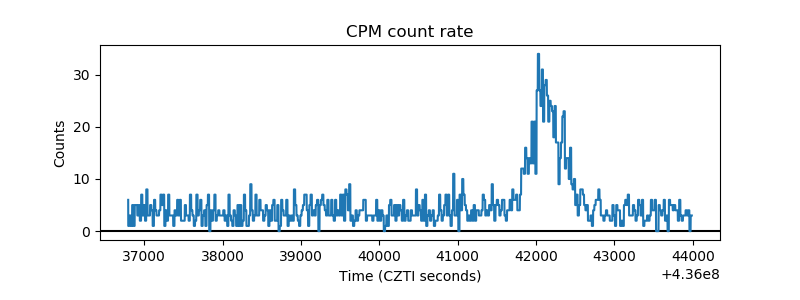 |
| CZT Counter | 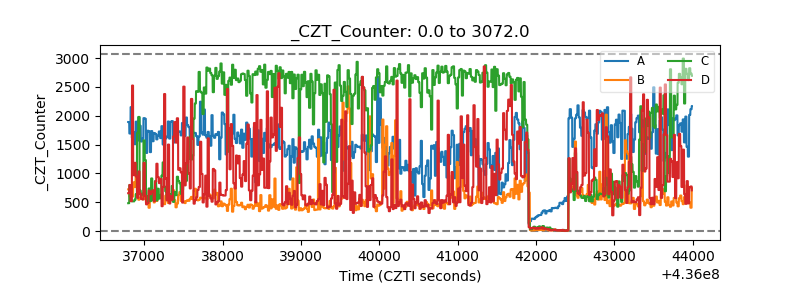 |
| +2.5 Volts monitor | 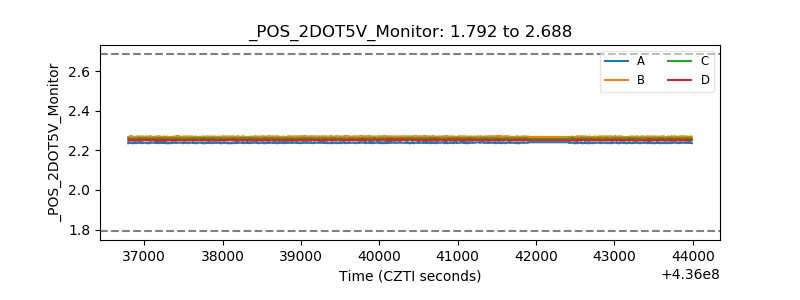 |
| +5 Volts monitor | 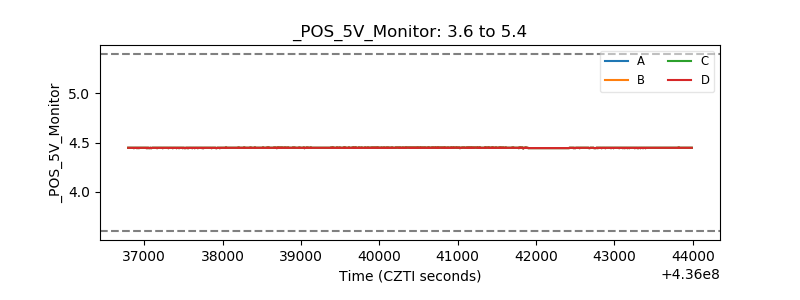 |
| _ROLL_ROT | 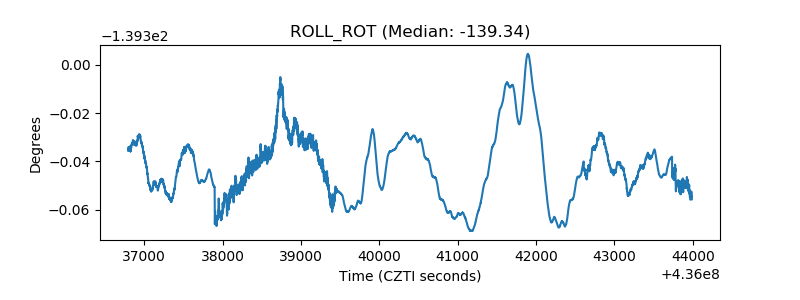 |
| _Roll_DEC | 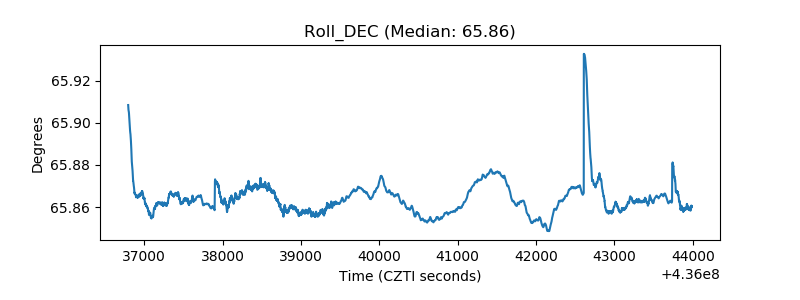 |
| _Roll_RA | 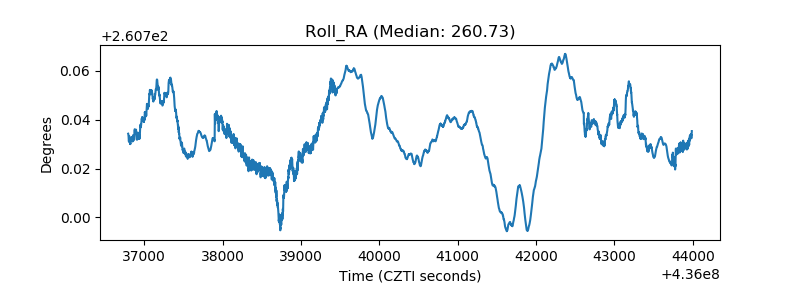 |
| Veto Counter | 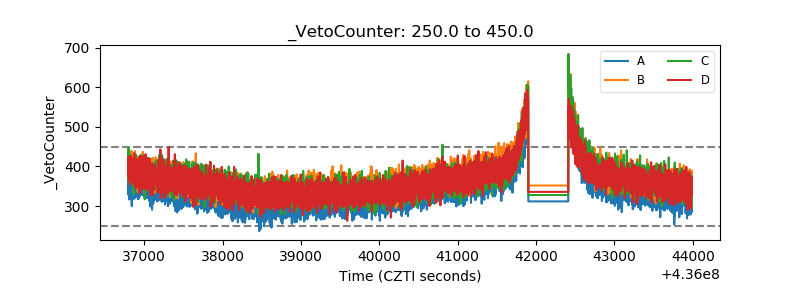 |