| Param | Original file | Final file |
|---|---|---|
| Filename | modeM0/AS1A12_018T01_9000005896_43681cztM0_level2.fits | modeM0/AS1A12_018T01_9000005896_43681cztM0_level2_quad_clean.evt |
| Size (bytes) | 1,077,166,080 | 105,618,240 |
| Size | 1.0 GB | 100.7 MB |
| Events in quadrant A | 12,370,586 | 791,179 |
| Events in quadrant B | 4,305,843 | 821,963 |
| Events in quadrant C | 15,282,233 | 380,055 |
| Events in quadrant D | 7,342,017 | 684,190 |
| Mode SS | |||
|---|---|---|---|
| Quadrant | BADHDUFLAG | Total packets | Discarded packets |
| A | 0 | 148 | 0 |
| B | 0 | 148 | 0 |
| C | 0 | 148 | 0 |
| D | 0 | 148 | 0 |
| Mode M0 | |||
|---|---|---|---|
| Quadrant | BADHDUFLAG | Total packets | Discarded packets |
| A | 0 | 41903 | 0 |
| B | 0 | 17890 | 0 |
| C | 0 | 50514 | 0 |
| D | 0 | 27044 | 0 |
| Quadrant | Total seconds | Saturated seconds | Saturation percentage |
|---|---|---|---|
| A | 7422 | 1687 | 22.729722% |
| B | 7423 | 177 | 2.384481% |
| C | 7423 | 5796 | 78.081638% |
| D | 7423 | 947 | 12.757645% |
Noise dominated data is calculated using 1-second bins in cleaned event files. If a bin has >2000 counts, and if more than 50% of those come from <1% of pixels, then it is considered to be noise-dominated and hence unusable.
| Quadrant | # 1 sec bins | Bins with >0 counts | Bins with >2000 counts | High rate bins dominated by noise | Noise dominated (total time) | Noise dominated (detector-on time) | Marked lightcurve |
|---|---|---|---|---|---|---|---|
| A | 7422 | 7422 | 858 | 858 | 11.56% | 11.56% | 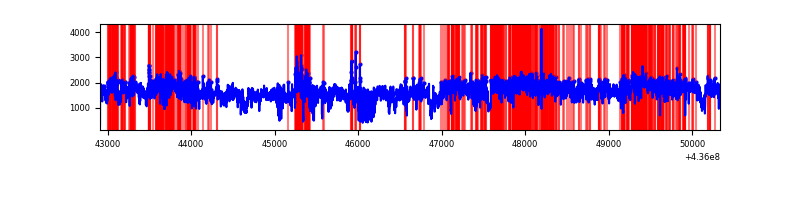 |
| B | 7423 | 7423 | 99 | 99 | 1.33% | 1.33% | 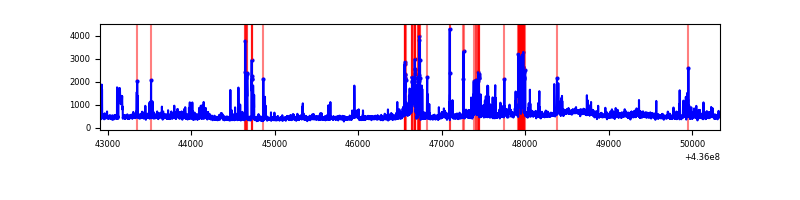 |
| C | 7422 | 7422 | 4186 | 4186 | 56.40% | 56.40% | 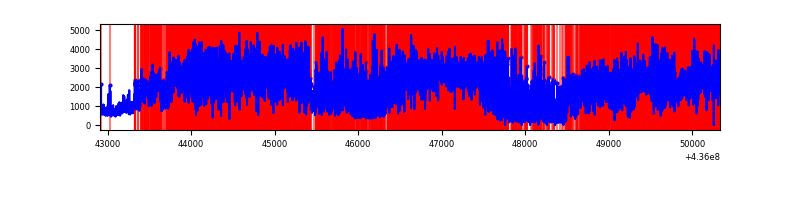 |
| D | 7423 | 7423 | 577 | 577 | 7.77% | 7.77% | 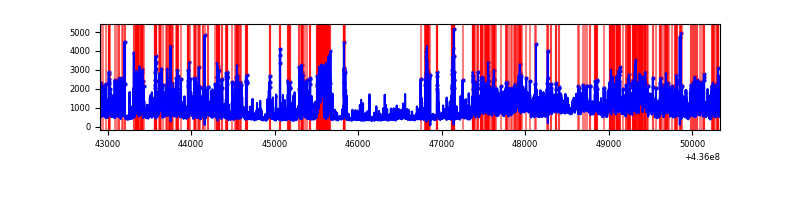 |
Top three noisy pixels from each quadrant. If the there are fewer than three noisy pixels in the level2.evt file, extra rows are filled as -1
| Pixel properties | Quadrant properties | ||||||
|---|---|---|---|---|---|---|---|
| Quadrant | DetID | PixID | Counts | Sigma | Mean | Median | Sigma |
| A | 15 | 222 | 7006136 | 42634.86 | 794 | 775 | 164.3 |
| A | 10 | 83 | 890218 | 5413.18 | 794 | 775 | 164.3 |
| A | 15 | 223 | 711692 | 4326.66 | 794 | 775 | 164.3 |
| B | 5 | 235 | 345244 | 2157.06 | 822 | 794 | 159.7 |
| B | 5 | 172 | 134305 | 836.09 | 822 | 794 | 159.7 |
| B | 0 | 200 | 109920 | 683.38 | 822 | 794 | 159.7 |
| C | 15 | 142 | 8542794 | 90579.51 | 397 | 399 | 94.3 |
| C | 15 | 158 | 3724108 | 39484.45 | 397 | 399 | 94.3 |
| C | 15 | 157 | 757334 | 8026.18 | 397 | 399 | 94.3 |
| D | 14 | 210 | 630024 | 3133.42 | 784 | 758 | 200.8 |
| D | 1 | 52 | 552603 | 2747.91 | 784 | 758 | 200.8 |
| D | 2 | 249 | 469307 | 2333.14 | 784 | 758 | 200.8 |
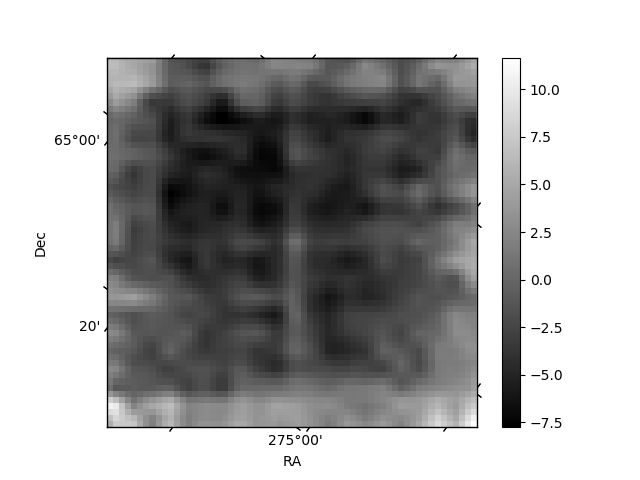
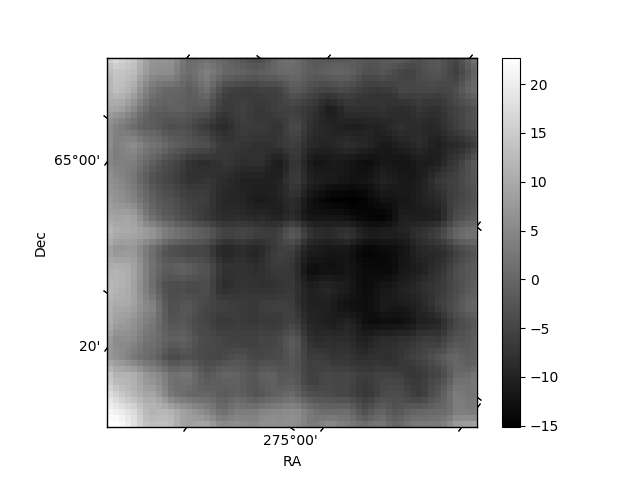
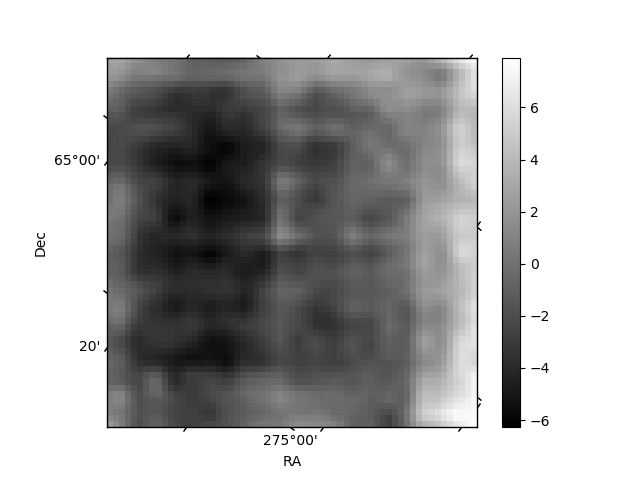
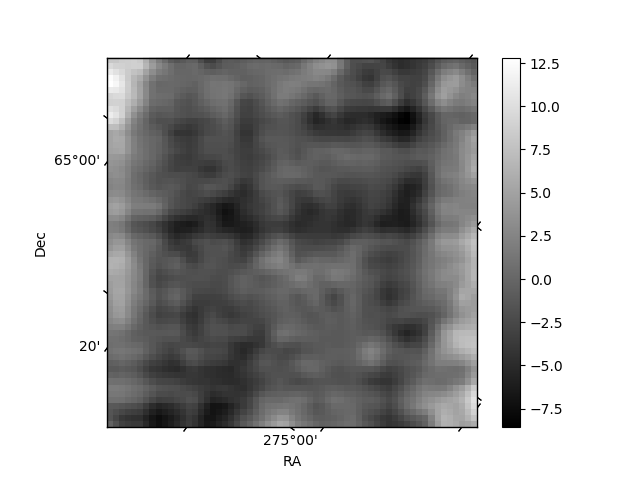
Histogram calculated using DETX and DETY for each event in the final _common_clean file
| Quadrant A | 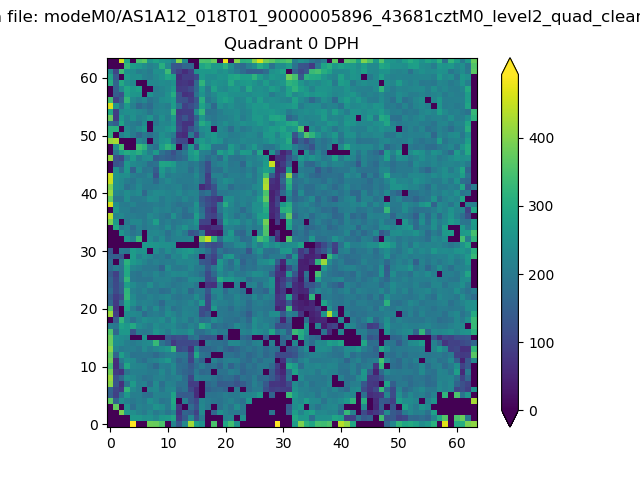 |
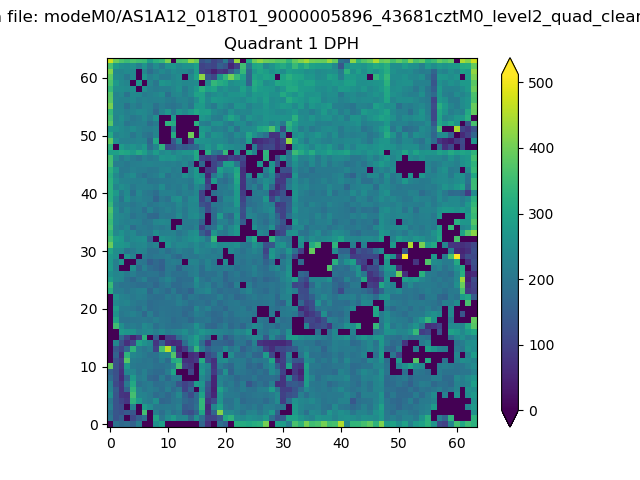 |
Quadrant B |
|---|---|---|---|
| Quadrant D | 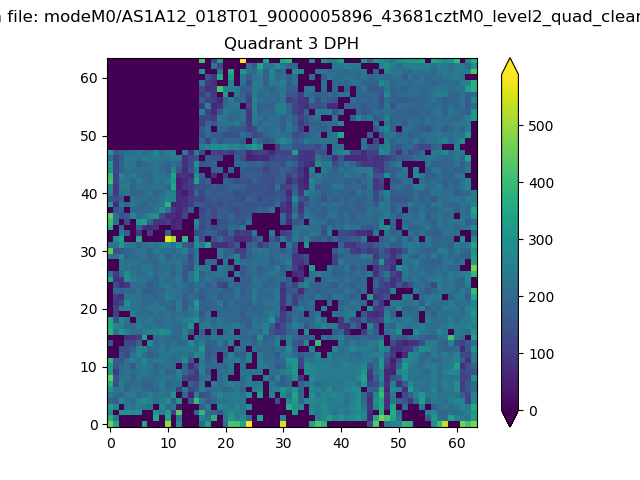 |
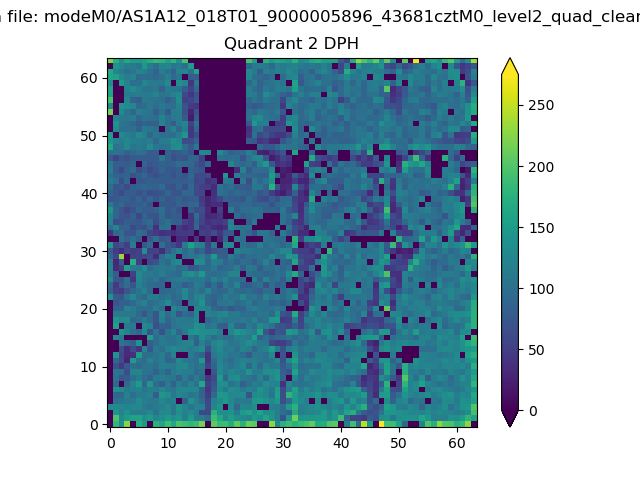 |
Quadrant C |
| Plot type | Count rate plots | Images |
|---|---|---|
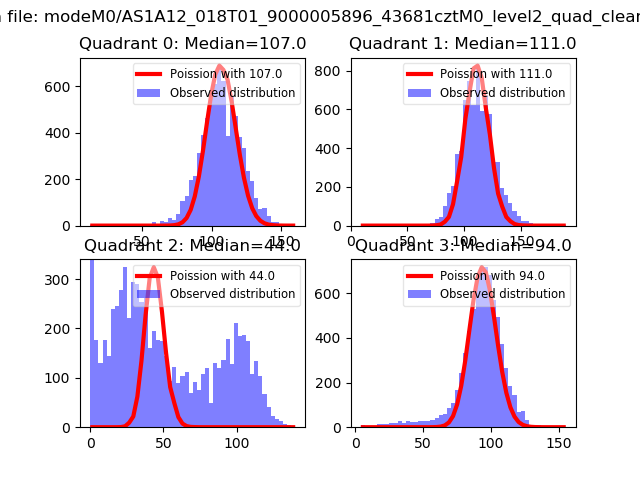
| Comparison with Poisson distribution Blue bars denote a histogram of data divided into 1 sec bins. Red curve is a Poisson curve with rate = median count rate of data. |
 |
 |
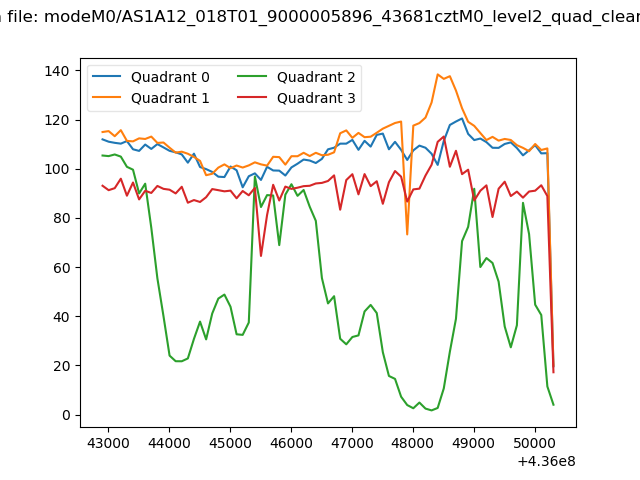
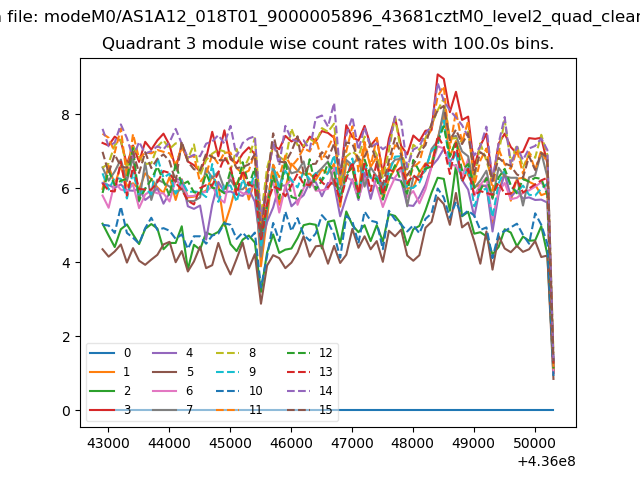
| Quadrant-wise count rates Data is divided into 100 sec bins |
 |
|
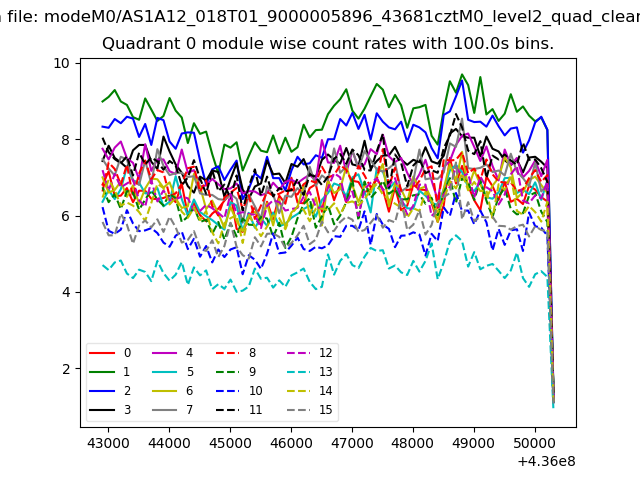
| Module-wise count rates for Quadrant A Data is divided into 100 sec bins |
 |
 |
| Module-wise count rates for Quadrant B Data is divided into 100 sec bins |
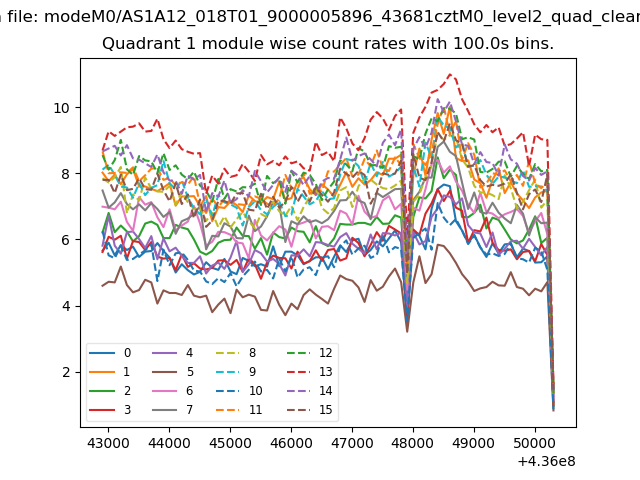 |
 |
| Module-wise count rates for Quadrant C Data is divided into 100 sec bins |
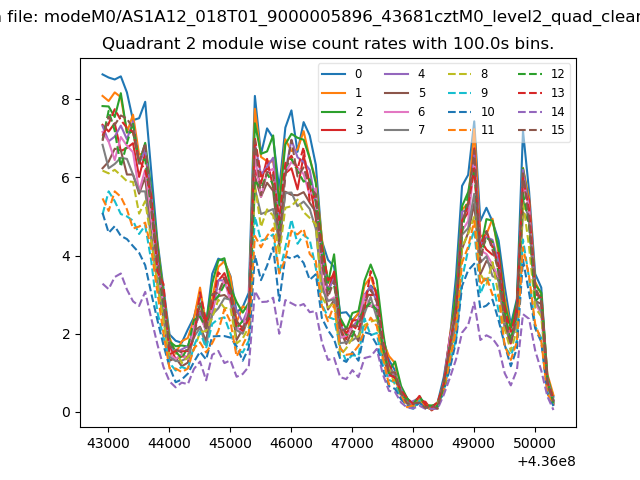 |
 |
| Module-wise count rates for Quadrant D Data is divided into 100 sec bins |
 |
 |
| Parameter | Plot |
|---|---|
| CZT HV Monitor | 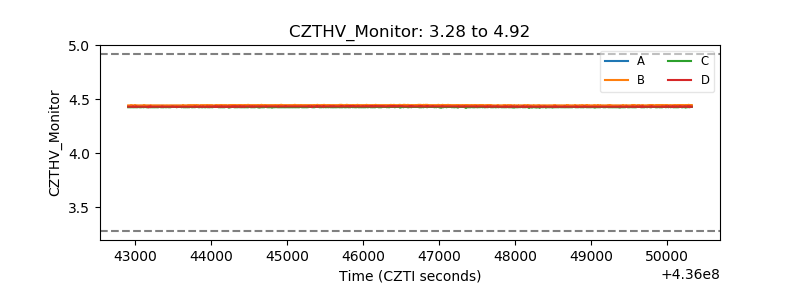 |
| D_VDD | 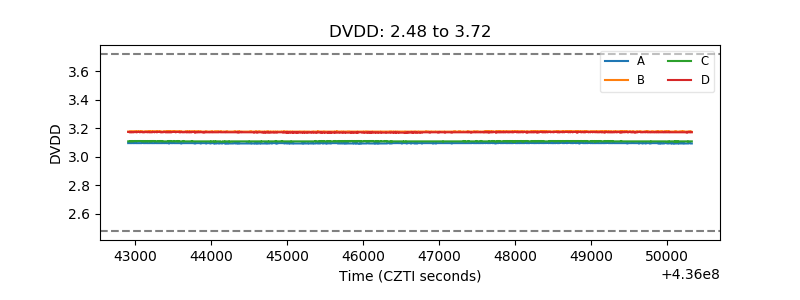 |
| Temperature 1 | 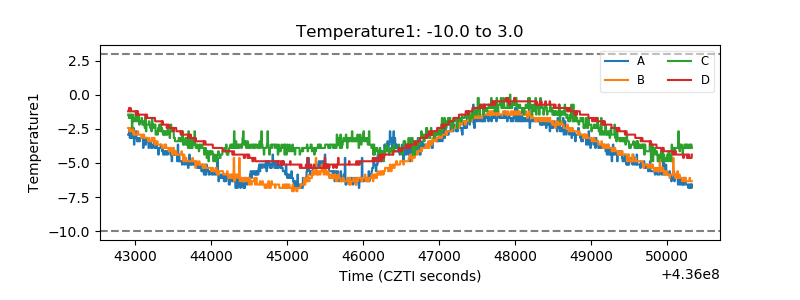 |
| Veto HV Monitor |  |
| Veto LLD | 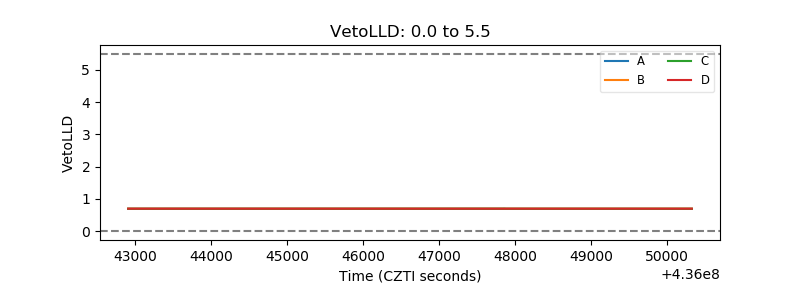 |
| Alpha Counter | 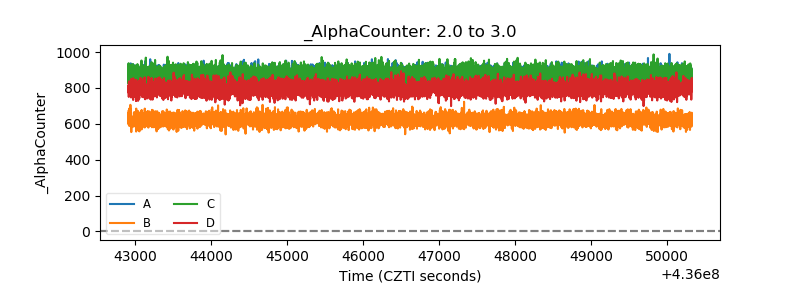 |
| _CPM_Rate | 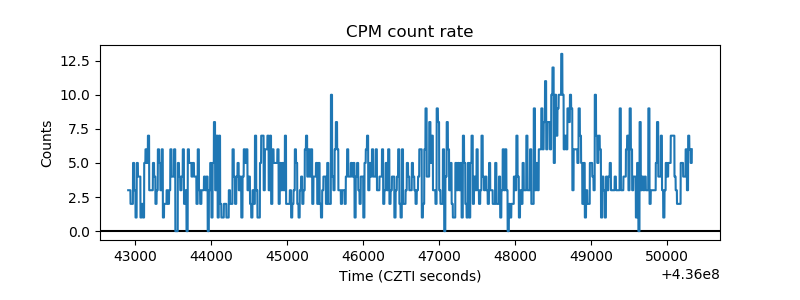 |
| CZT Counter | 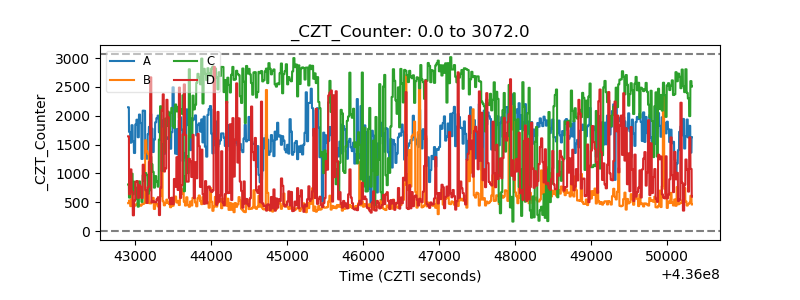 |
| +2.5 Volts monitor | 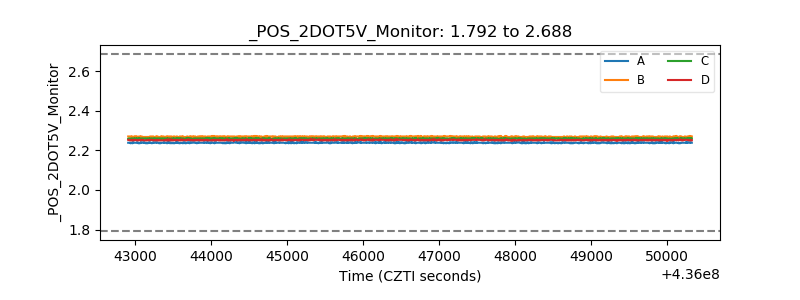 |
| +5 Volts monitor | 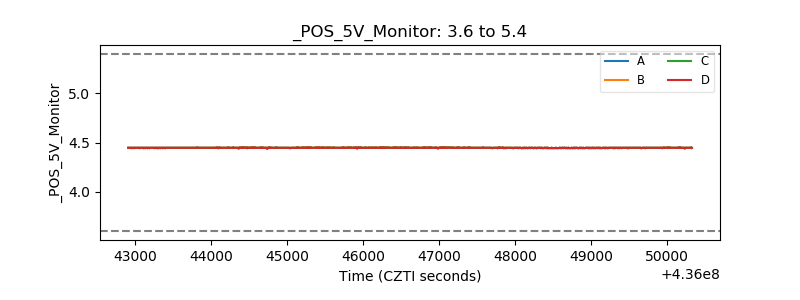 |
| _ROLL_ROT | 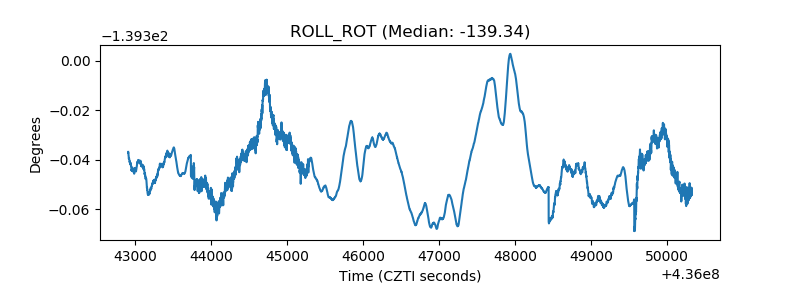 |
| _Roll_DEC | 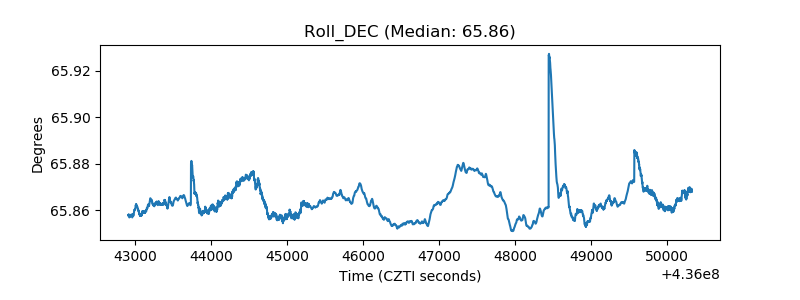 |
| _Roll_RA | 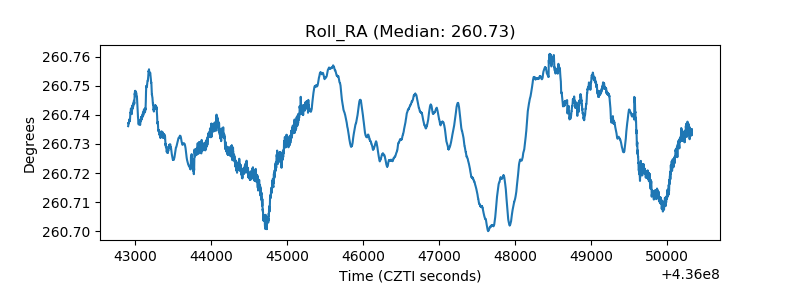 |
| Veto Counter | 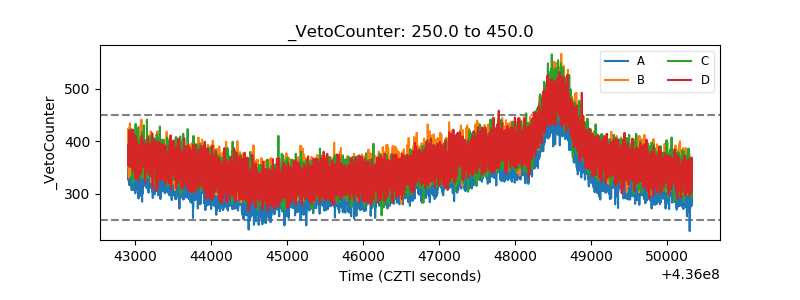 |