| Param | Original file | Final file |
|---|---|---|
| Filename | modeM0/AS1A12_018T01_9000005896_43682cztM0_level2.fits | modeM0/AS1A12_018T01_9000005896_43682cztM0_level2_quad_clean.evt |
| Size (bytes) | 1,312,214,400 | 110,174,400 |
| Size | 1.2 GB | 105.1 MB |
| Events in quadrant A | 13,753,231 | 836,646 |
| Events in quadrant B | 4,451,665 | 876,883 |
| Events in quadrant C | 18,747,600 | 384,639 |
| Events in quadrant D | 11,011,148 | 680,754 |
| Mode SS | |||
|---|---|---|---|
| Quadrant | BADHDUFLAG | Total packets | Discarded packets |
| A | 0 | 158 | 0 |
| B | 0 | 158 | 0 |
| C | 0 | 158 | 0 |
| D | 0 | 158 | 0 |
| Mode M0 | |||
|---|---|---|---|
| Quadrant | BADHDUFLAG | Total packets | Discarded packets |
| A | 0 | 46342 | 0 |
| B | 0 | 18787 | 0 |
| C | 0 | 61172 | 7 |
| D | 0 | 38277 | 0 |
| Quadrant | Total seconds | Saturated seconds | Saturation percentage |
|---|---|---|---|
| A | 7936 | 2042 | 25.730847% |
| B | 7937 | 122 | 1.537105% |
| C | 7936 | 6972 | 87.852823% |
| D | 7936 | 2179 | 27.457157% |
Noise dominated data is calculated using 1-second bins in cleaned event files. If a bin has >2000 counts, and if more than 50% of those come from <1% of pixels, then it is considered to be noise-dominated and hence unusable.
| Quadrant | # 1 sec bins | Bins with >0 counts | Bins with >2000 counts | High rate bins dominated by noise | Noise dominated (total time) | Noise dominated (detector-on time) | Marked lightcurve |
|---|---|---|---|---|---|---|---|
| A | 7936 | 7936 | 1336 | 1336 | 16.83% | 16.83% | 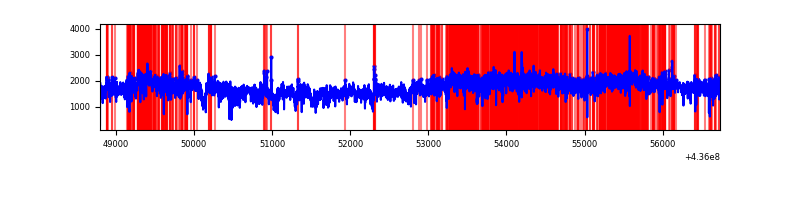 |
| B | 7937 | 7937 | 37 | 37 | 0.47% | 0.47% | 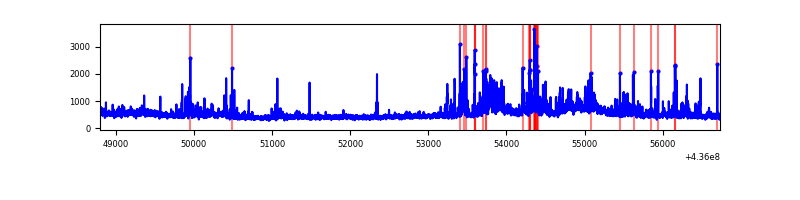 |
| C | 7936 | 7936 | 5774 | 5774 | 72.76% | 72.76% | 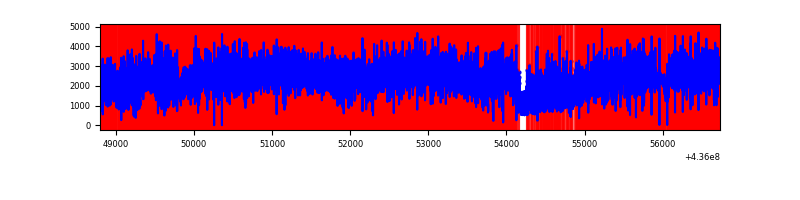 |
| D | 7936 | 7936 | 1594 | 1594 | 20.09% | 20.09% | 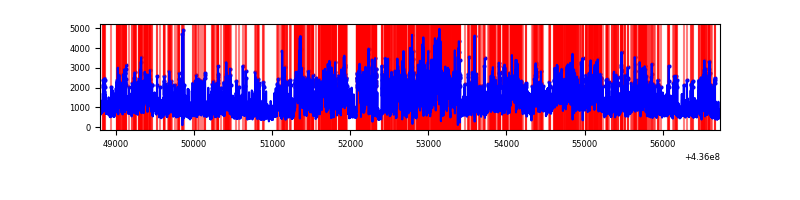 |
Top three noisy pixels from each quadrant. If the there are fewer than three noisy pixels in the level2.evt file, extra rows are filled as -1
| Pixel properties | Quadrant properties | ||||||
|---|---|---|---|---|---|---|---|
| Quadrant | DetID | PixID | Counts | Sigma | Mean | Median | Sigma |
| A | 15 | 222 | 8502917 | 48812.61 | 843 | 827 | 174.2 |
| A | 10 | 83 | 939391 | 5388.53 | 843 | 827 | 174.2 |
| A | 14 | 63 | 440125 | 2522.12 | 843 | 827 | 174.2 |
| B | 5 | 255 | 280461 | 1641.28 | 881 | 855 | 170.4 |
| B | 5 | 235 | 178771 | 1044.36 | 881 | 855 | 170.4 |
| B | 12 | 3 | 126072 | 735.02 | 881 | 855 | 170.4 |
| C | 15 | 142 | 12484578 | 124625.48 | 424 | 426 | 100.2 |
| C | 15 | 158 | 2242963 | 22386.56 | 424 | 426 | 100.2 |
| C | 15 | 174 | 1675087 | 16717.63 | 424 | 426 | 100.2 |
| D | 4 | 221 | 2899982 | 14200.03 | 784 | 756 | 204.2 |
| D | 1 | 52 | 1115947 | 5462.06 | 784 | 756 | 204.2 |
| D | 14 | 210 | 705973 | 3454.06 | 784 | 756 | 204.2 |
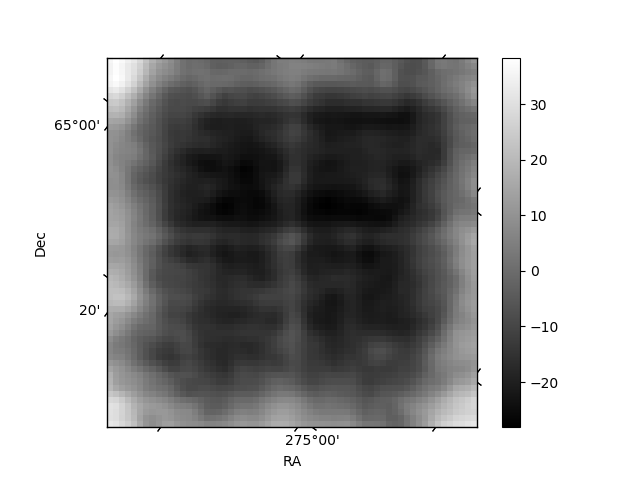
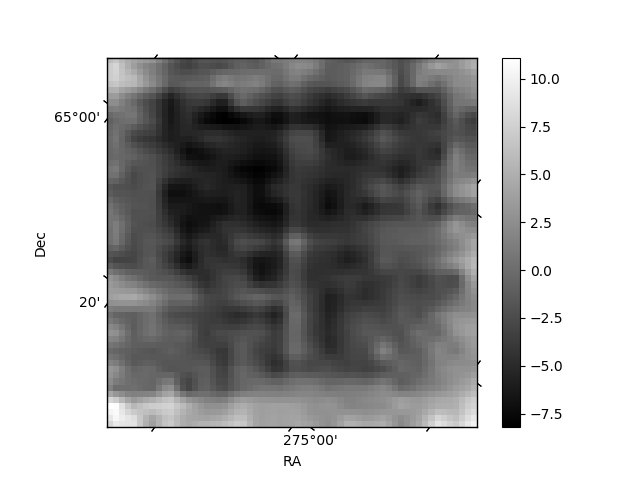
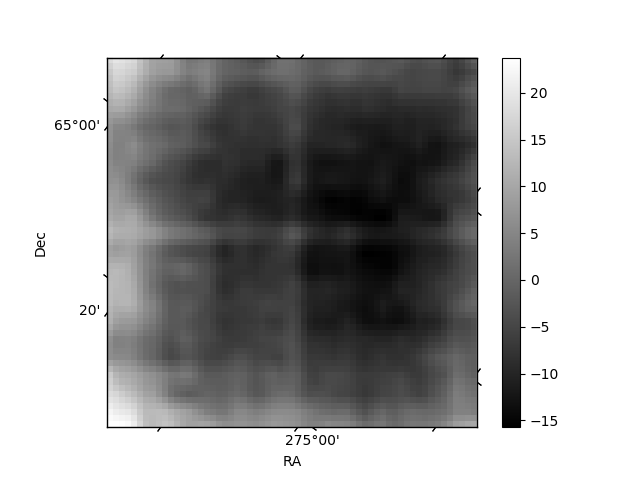
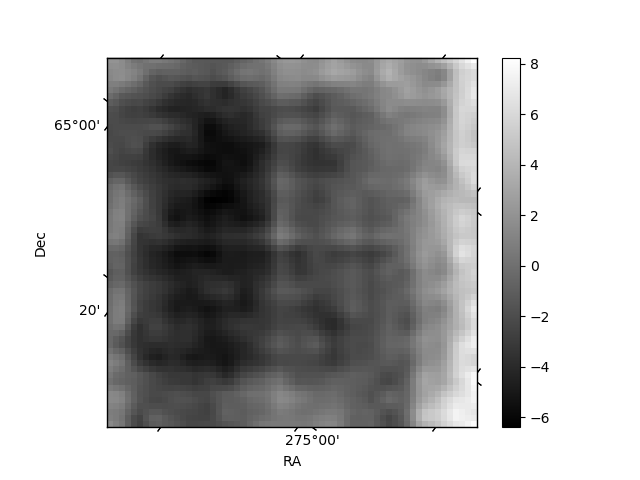
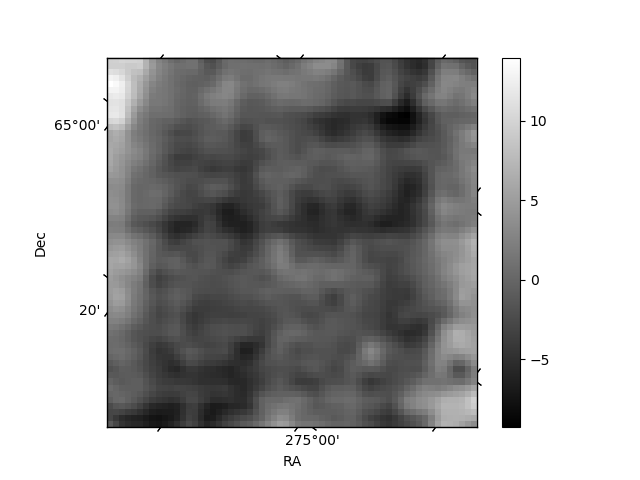
Histogram calculated using DETX and DETY for each event in the final _common_clean file
| Quadrant A | 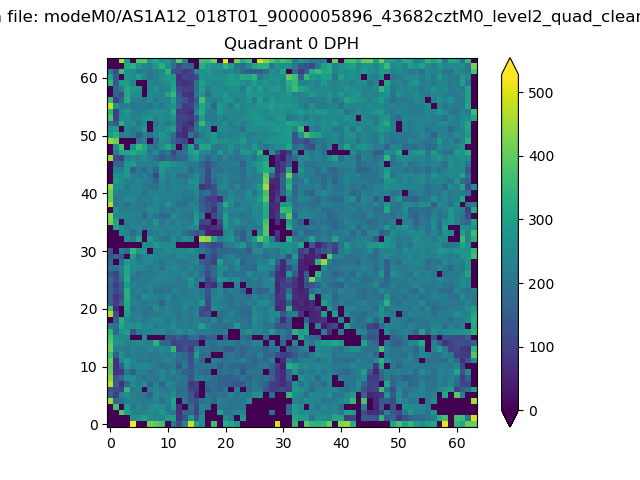 |
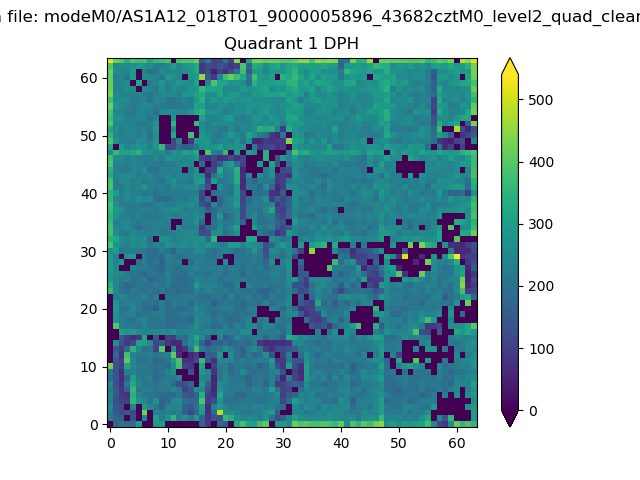 |
Quadrant B |
|---|---|---|---|
| Quadrant D | 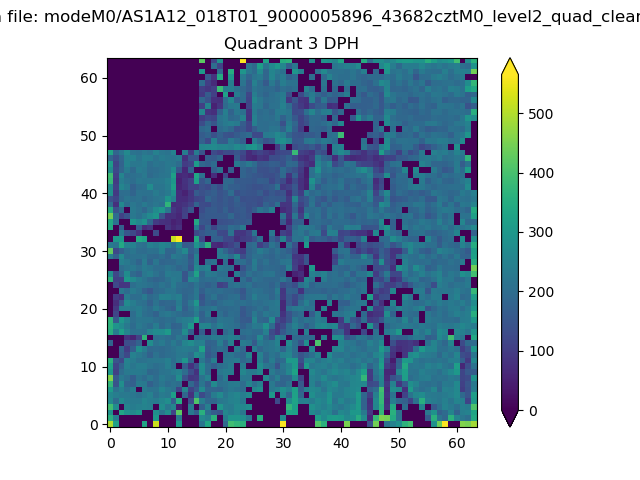 |
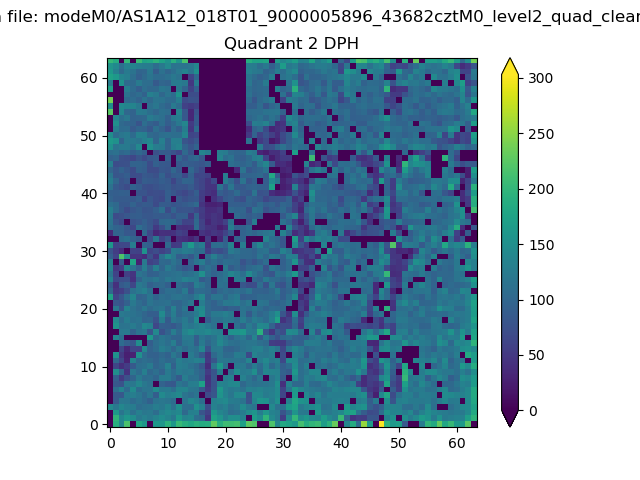 |
Quadrant C |
| Plot type | Count rate plots | Images |
|---|---|---|
| Comparison with Poisson distribution Blue bars denote a histogram of data divided into 1 sec bins. Red curve is a Poisson curve with rate = median count rate of data. |
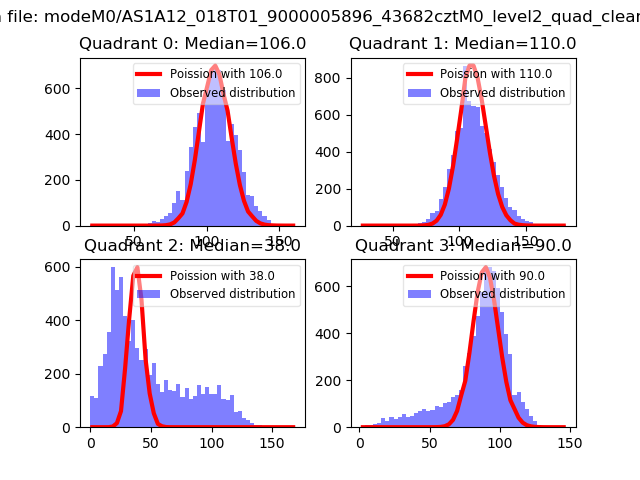 |
 |
| Quadrant-wise count rates Data is divided into 100 sec bins |
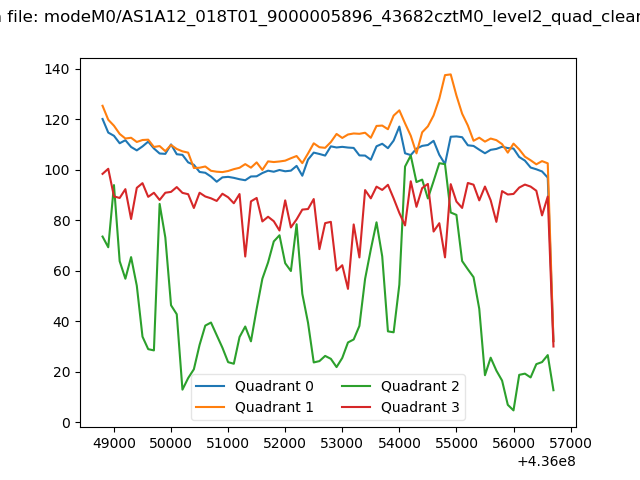 |
|
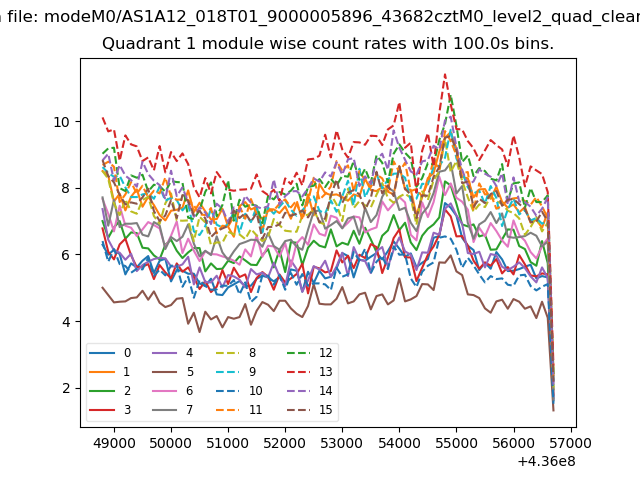
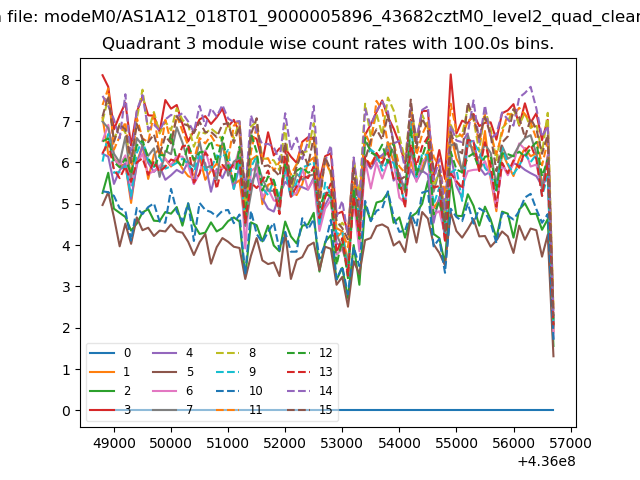
| Module-wise count rates for Quadrant A Data is divided into 100 sec bins |
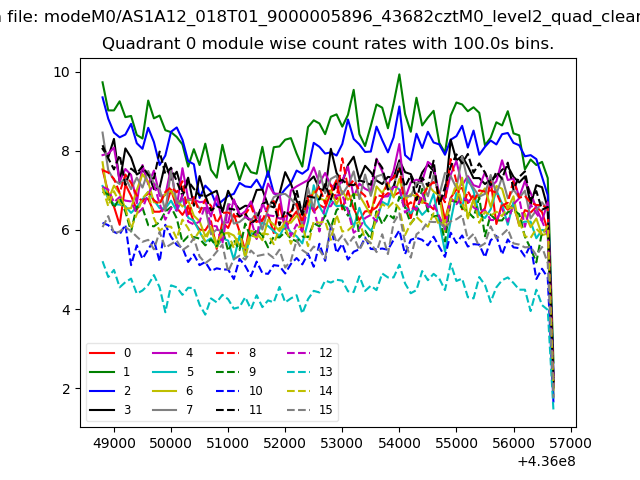 |
 |
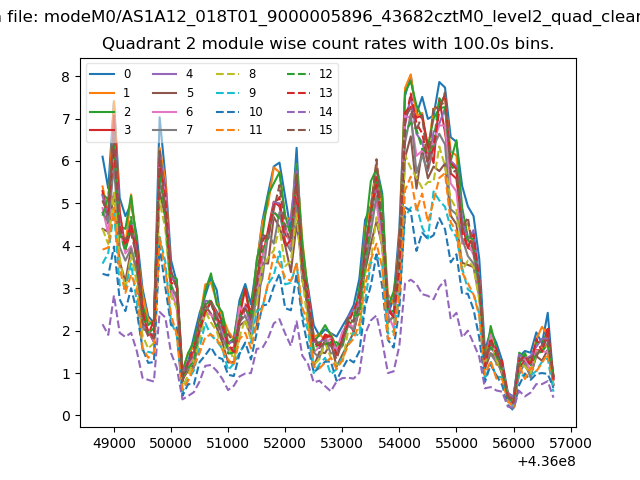
| Module-wise count rates for Quadrant B Data is divided into 100 sec bins |
 |
 |
| Module-wise count rates for Quadrant C Data is divided into 100 sec bins |
 |
 |
| Module-wise count rates for Quadrant D Data is divided into 100 sec bins |
 |
 |
| Parameter | Plot |
|---|---|
| CZT HV Monitor | 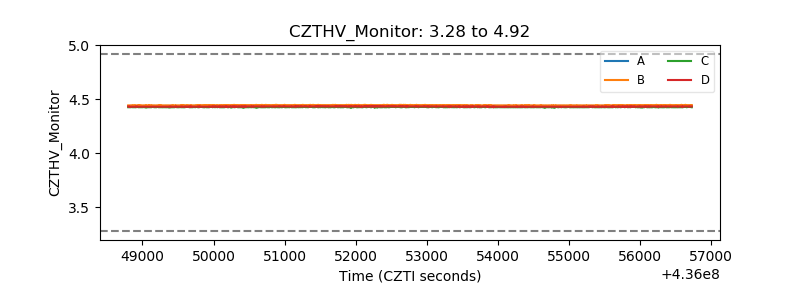 |
| D_VDD | 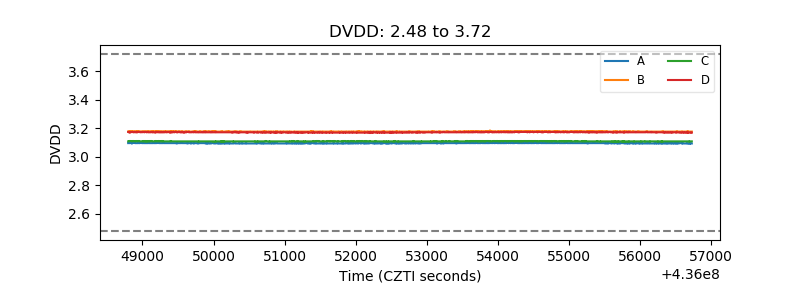 |
| Temperature 1 | 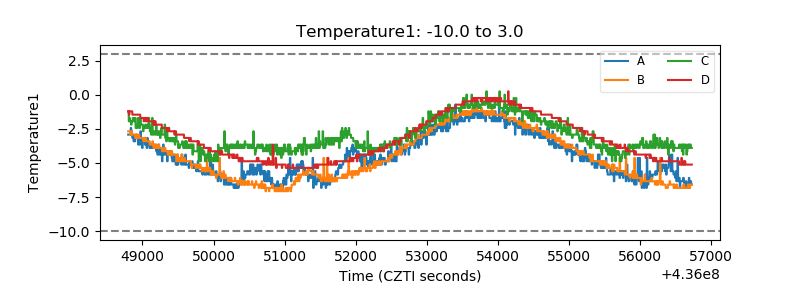 |
| Veto HV Monitor |  |
| Veto LLD | 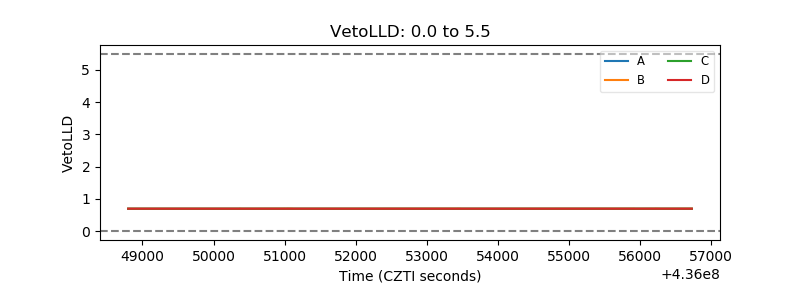 |
| Alpha Counter | 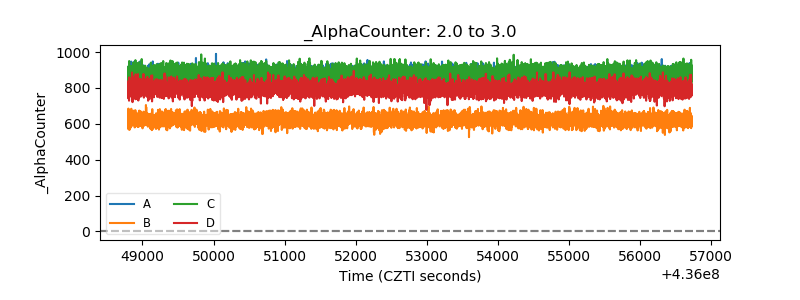 |
| _CPM_Rate | 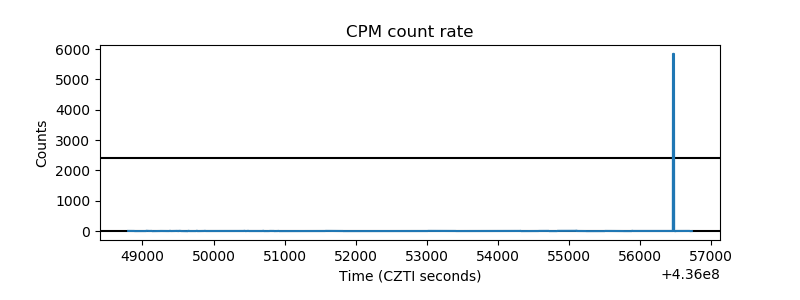 |
| CZT Counter | 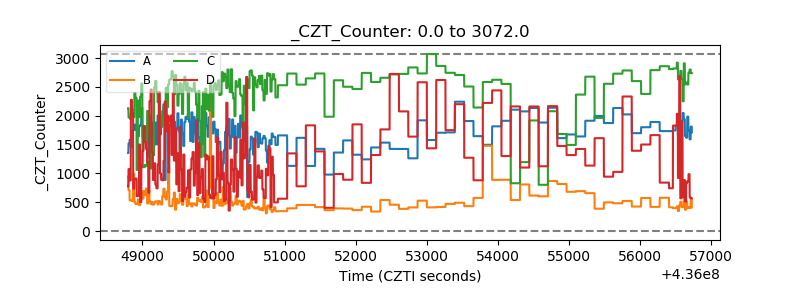 |
| +2.5 Volts monitor | 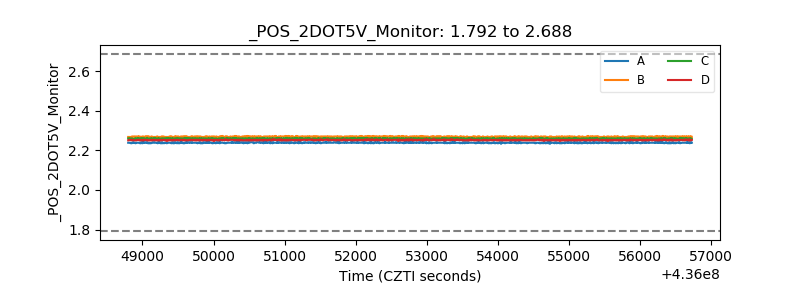 |
| +5 Volts monitor | 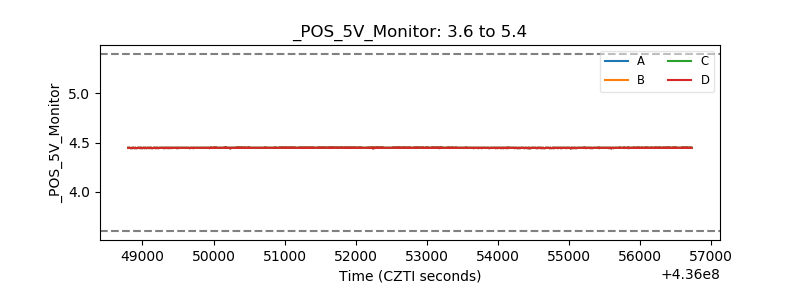 |
| _ROLL_ROT | 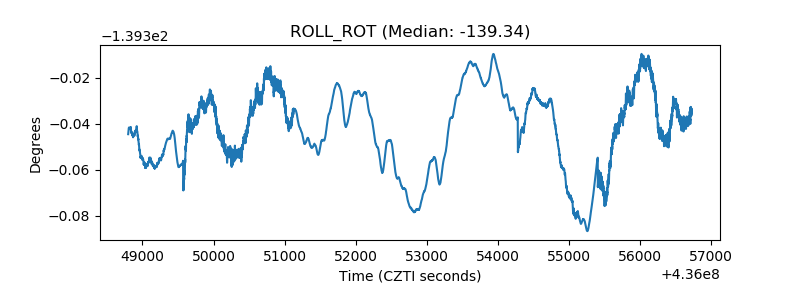 |
| _Roll_DEC | 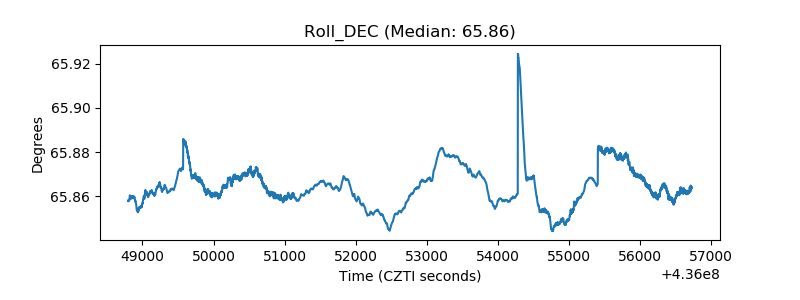 |
| _Roll_RA | 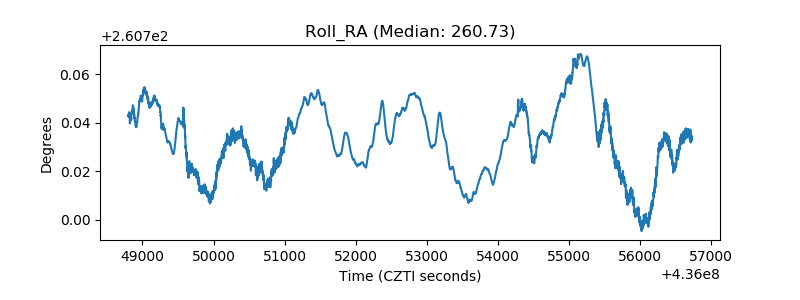 |
| Veto Counter | 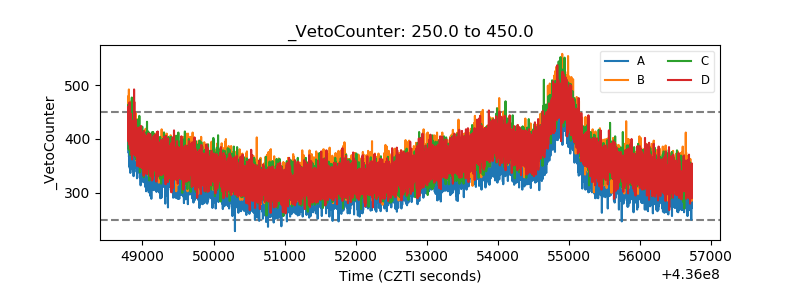 |