| Param | Original file | Final file |
|---|---|---|
| Filename | modeM0/AS1A12_018T01_9000005896_43685cztM0_level2.fits | modeM0/AS1A12_018T01_9000005896_43685cztM0_level2_quad_clean.evt |
| Size (bytes) | 1,388,928,960 | 105,923,520 |
| Size | 1.3 GB | 101.0 MB |
| Events in quadrant A | 15,841,619 | 744,660 |
| Events in quadrant B | 4,802,394 | 933,819 |
| Events in quadrant C | 20,379,765 | 216,723 |
| Events in quadrant D | 9,715,369 | 702,100 |
| Mode SS | |||
|---|---|---|---|
| Quadrant | BADHDUFLAG | Total packets | Discarded packets |
| A | 0 | 178 | 0 |
| B | 0 | 178 | 0 |
| C | 0 | 178 | 0 |
| D | 0 | 178 | 0 |
| Mode M0 | |||
|---|---|---|---|
| Quadrant | BADHDUFLAG | Total packets | Discarded packets |
| A | 0 | 53112 | 2 |
| B | 0 | 20424 | 2 |
| C | 0 | 66503 | 2 |
| D | 0 | 34957 | 2 |
| Mode M9 | |||
|---|---|---|---|
| Quadrant | BADHDUFLAG | Total packets | Discarded packets |
| A | 0 | 1 | 0 |
| B | 0 | 1 | 0 |
| C | 0 | 1 | 0 |
| D | 0 | 1 | 0 |
| Quadrant | Total seconds | Saturated seconds | Saturation percentage |
|---|---|---|---|
| A | 8767 | 2508 | 28.607277% |
| B | 8767 | 275 | 3.136763% |
| C | 8767 | 7184 | 81.943652% |
| D | 8768 | 1637 | 18.670164% |
Noise dominated data is calculated using 1-second bins in cleaned event files. If a bin has >2000 counts, and if more than 50% of those come from <1% of pixels, then it is considered to be noise-dominated and hence unusable.
| Quadrant | # 1 sec bins | Bins with >0 counts | Bins with >2000 counts | High rate bins dominated by noise | Noise dominated (total time) | Noise dominated (detector-on time) | Marked lightcurve |
|---|---|---|---|---|---|---|---|
| A | 8867 | 8768 | 1717 | 1717 | 19.36% | 19.58% | 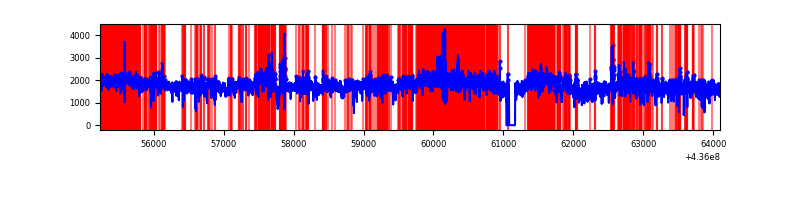 |
| B | 8867 | 8769 | 75 | 75 | 0.85% | 0.86% | 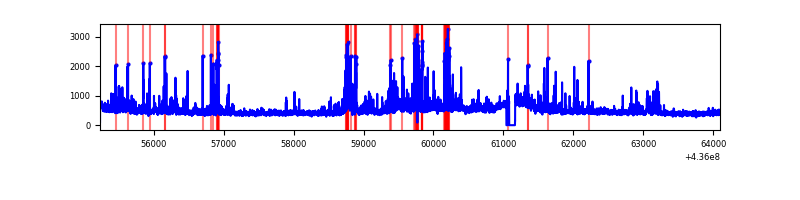 |
| C | 8867 | 8768 | 6167 | 6167 | 69.55% | 70.34% | 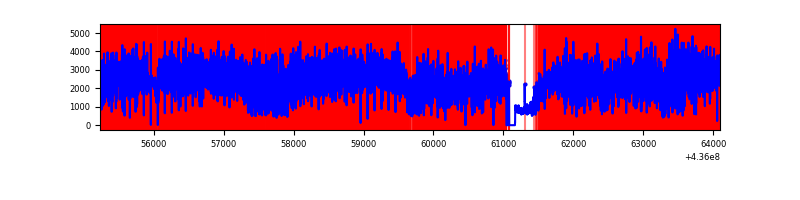 |
| D | 8868 | 8770 | 1185 | 1185 | 13.36% | 13.51% | 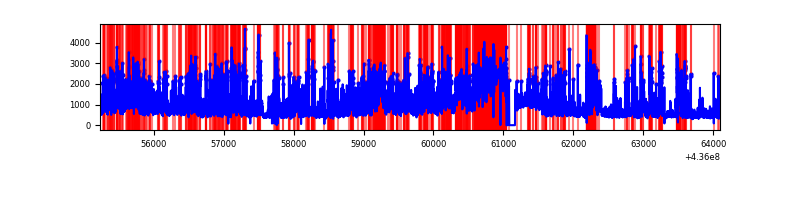 |
Top three noisy pixels from each quadrant. If the there are fewer than three noisy pixels in the level2.evt file, extra rows are filled as -1
| Pixel properties | Quadrant properties | ||||||
|---|---|---|---|---|---|---|---|
| Quadrant | DetID | PixID | Counts | Sigma | Mean | Median | Sigma |
| A | 15 | 222 | 10311986 | 55453.23 | 903 | 880 | 185.9 |
| A | 10 | 83 | 971857 | 5221.92 | 903 | 880 | 185.9 |
| A | 15 | 223 | 655221 | 3519.05 | 903 | 880 | 185.9 |
| B | 5 | 255 | 299126 | 1598.41 | 961 | 929 | 186.6 |
| B | 5 | 235 | 231351 | 1235.12 | 961 | 929 | 186.6 |
| B | 0 | 200 | 178502 | 951.83 | 961 | 929 | 186.6 |
| C | 15 | 142 | 16595981 | 135924.38 | 518 | 520 | 122.1 |
| C | 15 | 158 | 618948 | 5065.21 | 518 | 520 | 122.1 |
| C | 15 | 174 | 518415 | 4241.8 | 518 | 520 | 122.1 |
| D | 13 | 249 | 1471040 | 6208.32 | 860 | 839 | 236.8 |
| D | 4 | 221 | 1303578 | 5501.17 | 860 | 839 | 236.8 |
| D | 14 | 210 | 524258 | 2210.28 | 860 | 839 | 236.8 |
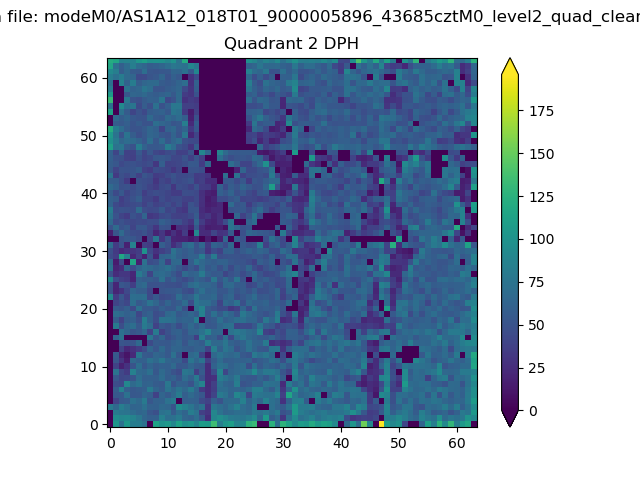
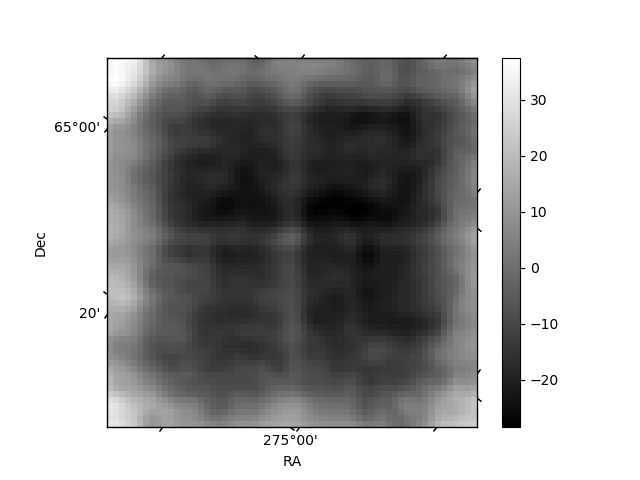
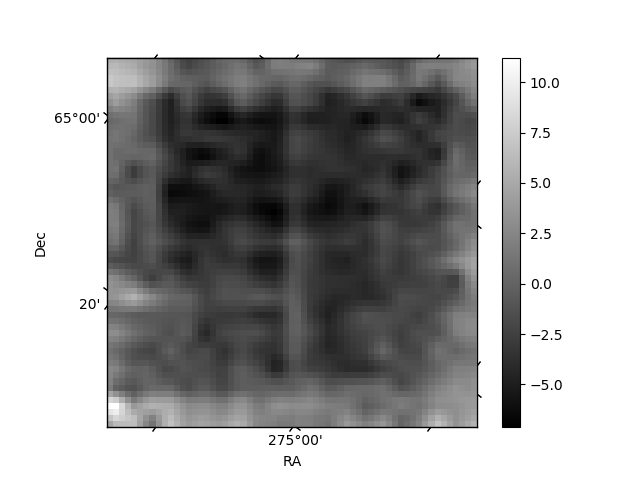
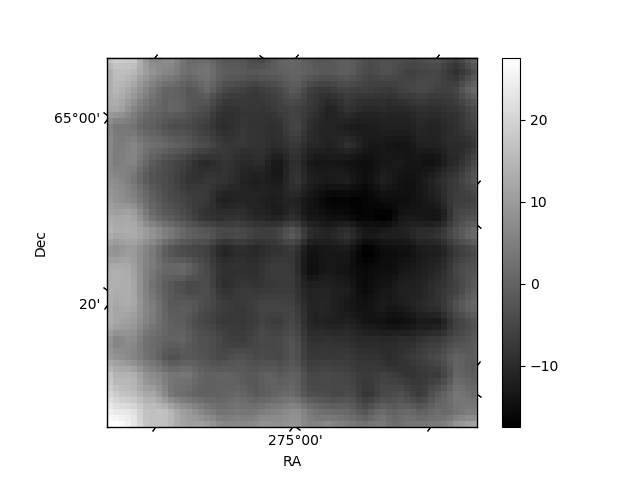
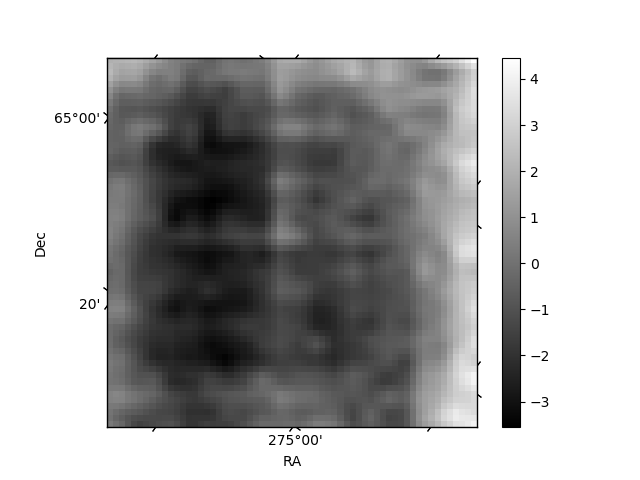
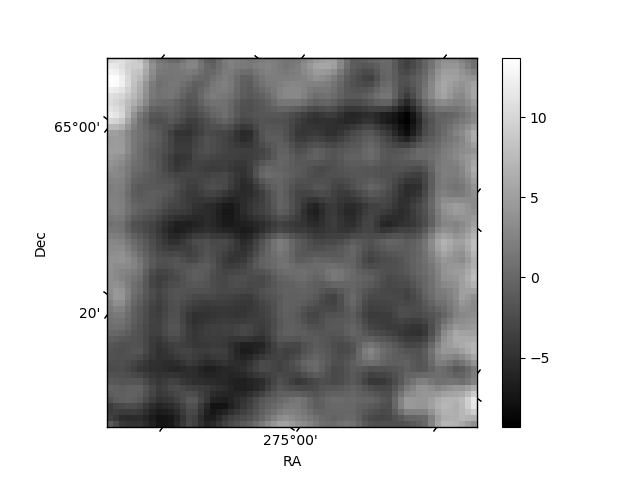
Histogram calculated using DETX and DETY for each event in the final _common_clean file
| Quadrant A | 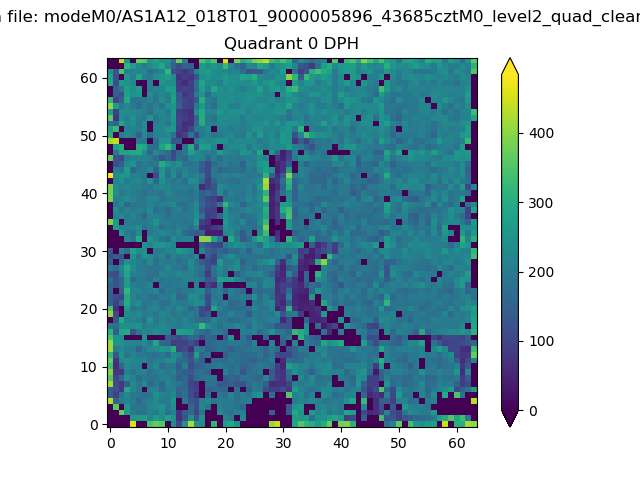 |
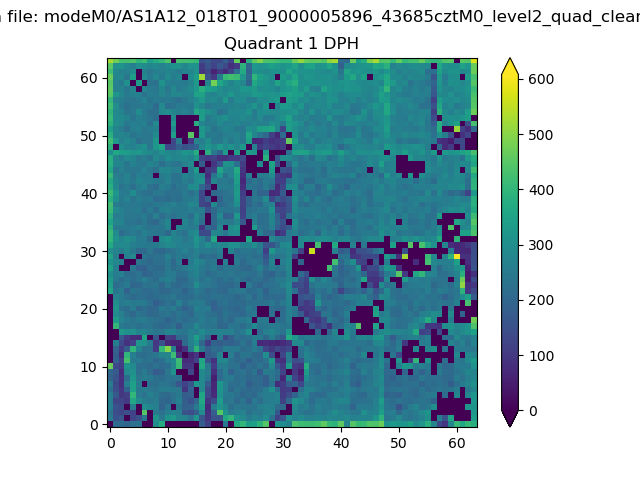 |
Quadrant B |
|---|---|---|---|
| Quadrant D | 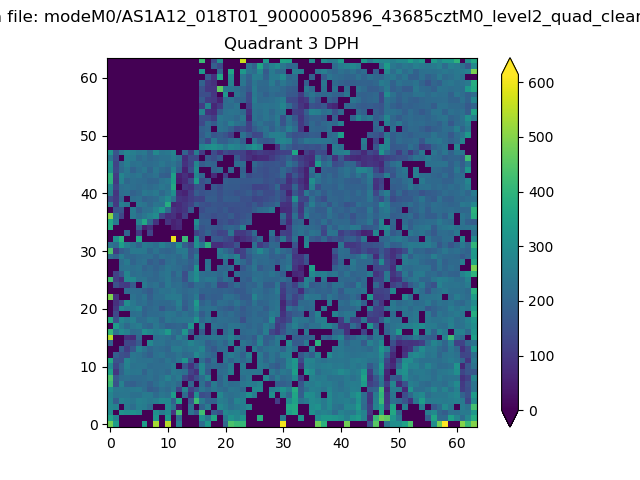 |
 |
Quadrant C |
| Plot type | Count rate plots | Images |
|---|---|---|
| Comparison with Poisson distribution Blue bars denote a histogram of data divided into 1 sec bins. Red curve is a Poisson curve with rate = median count rate of data. |
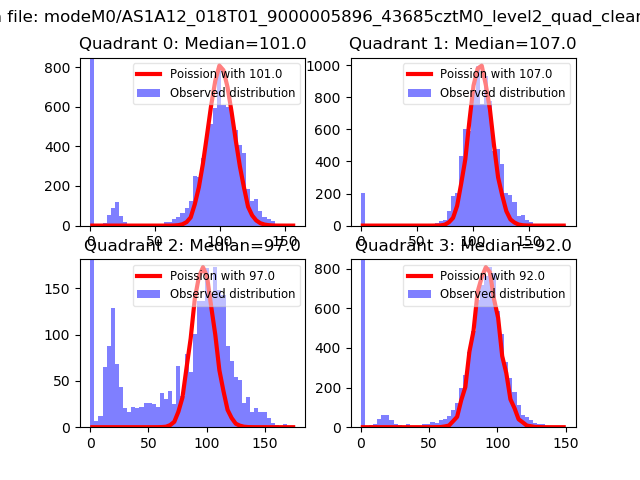 |
 |
| Quadrant-wise count rates Data is divided into 100 sec bins |
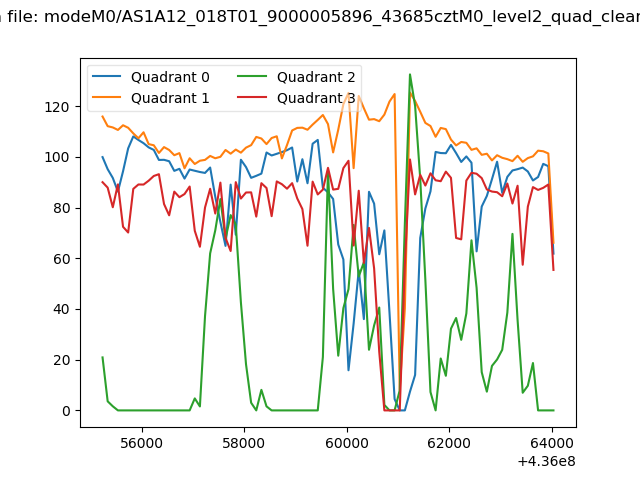 |
|
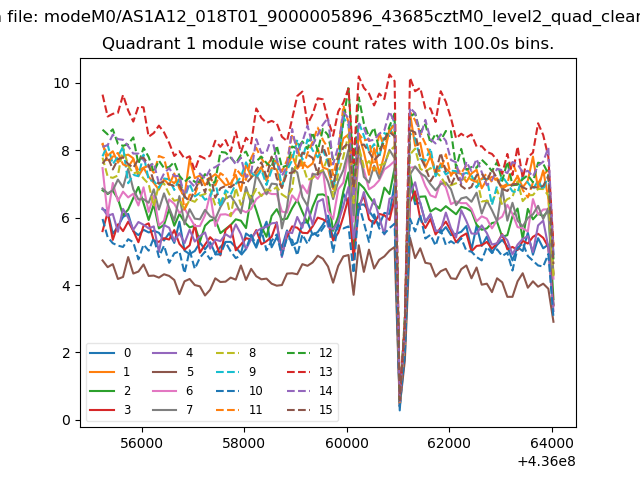
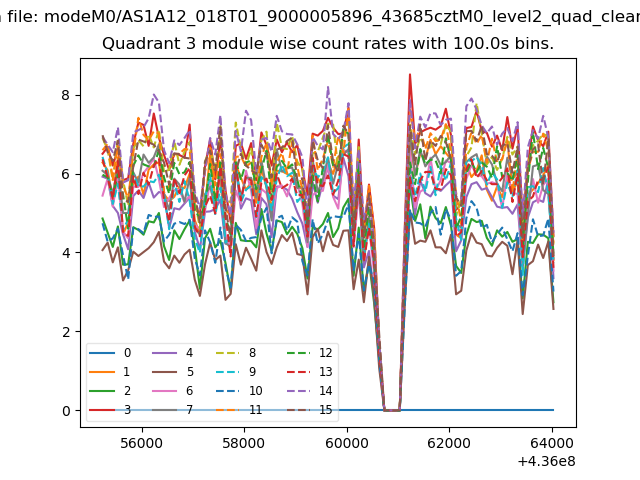
| Module-wise count rates for Quadrant A Data is divided into 100 sec bins |
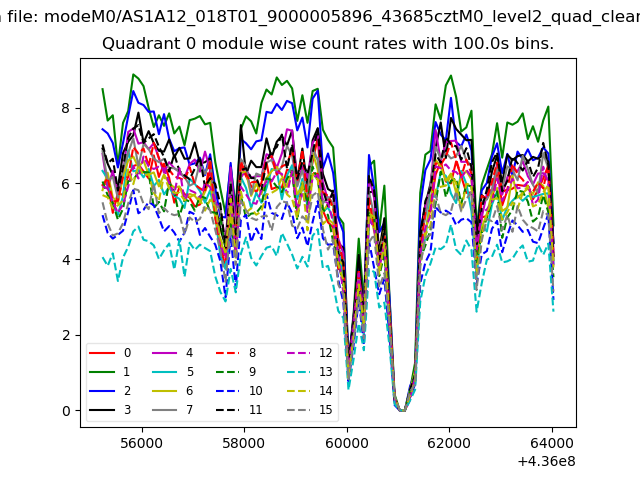 |
 |
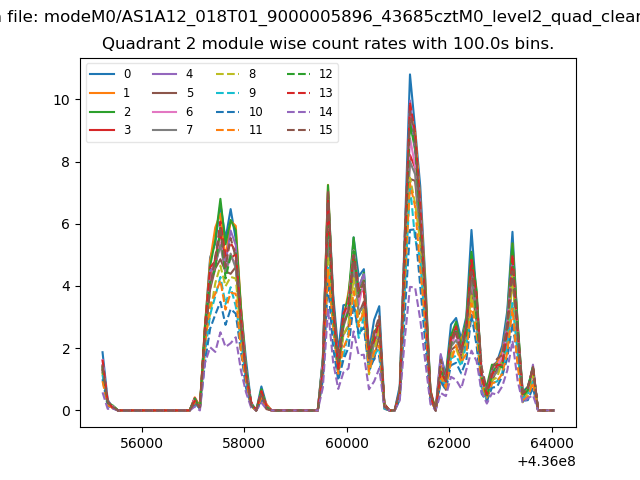
| Module-wise count rates for Quadrant B Data is divided into 100 sec bins |
 |
 |
| Module-wise count rates for Quadrant C Data is divided into 100 sec bins |
 |
 |
| Module-wise count rates for Quadrant D Data is divided into 100 sec bins |
 |
 |
| Parameter | Plot |
|---|---|
| CZT HV Monitor | 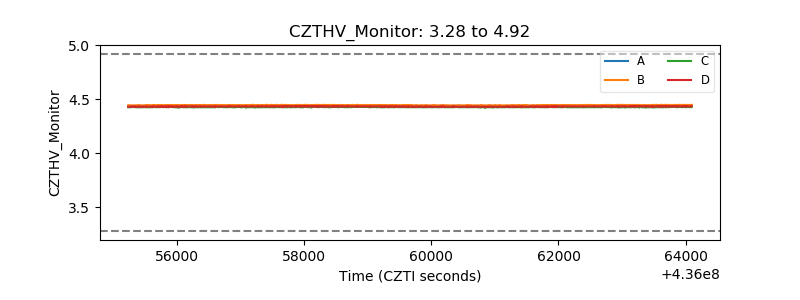 |
| D_VDD | 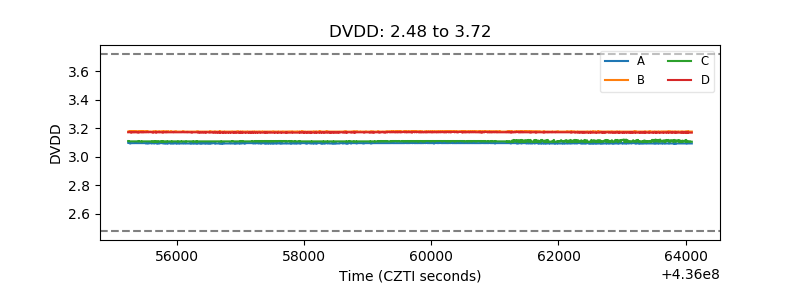 |
| Temperature 1 | 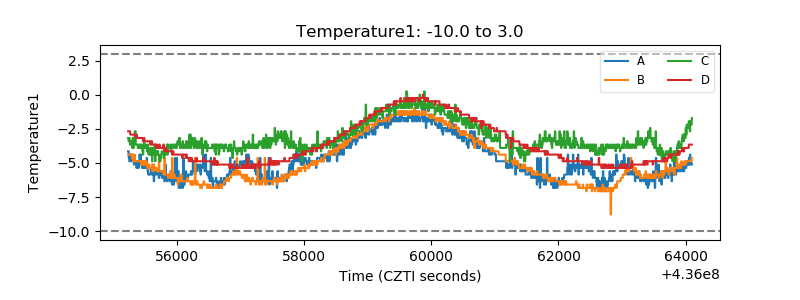 |
| Veto HV Monitor |  |
| Veto LLD | 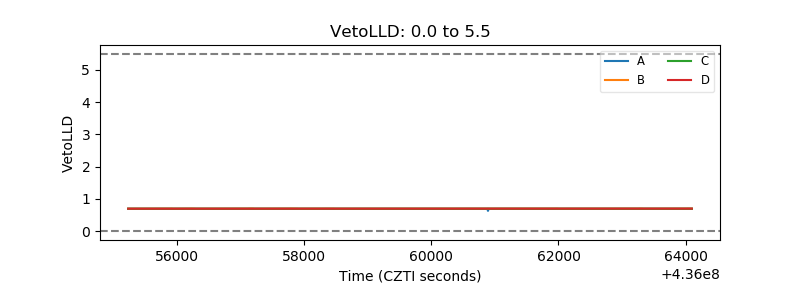 |
| Alpha Counter | 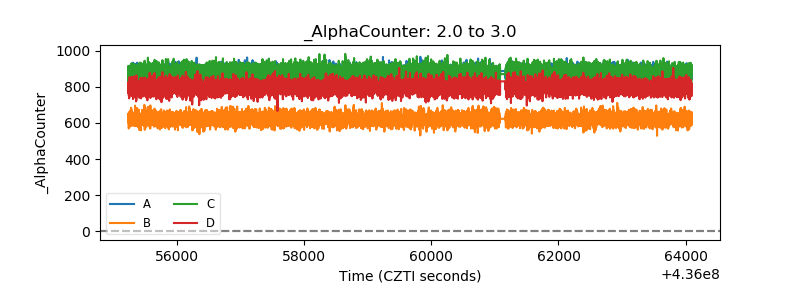 |
| _CPM_Rate | 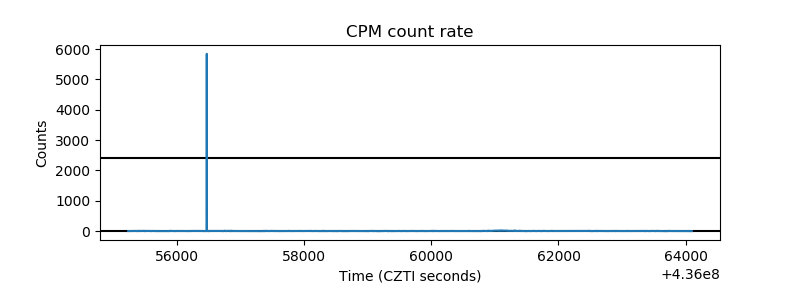 |
| CZT Counter | 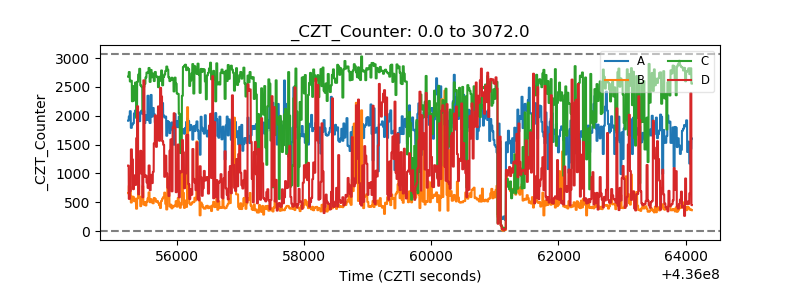 |
| +2.5 Volts monitor | 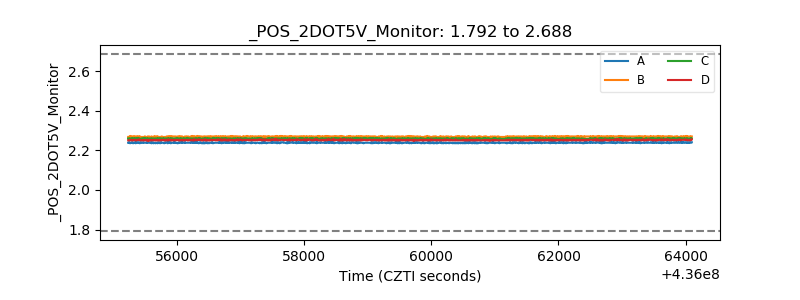 |
| +5 Volts monitor | 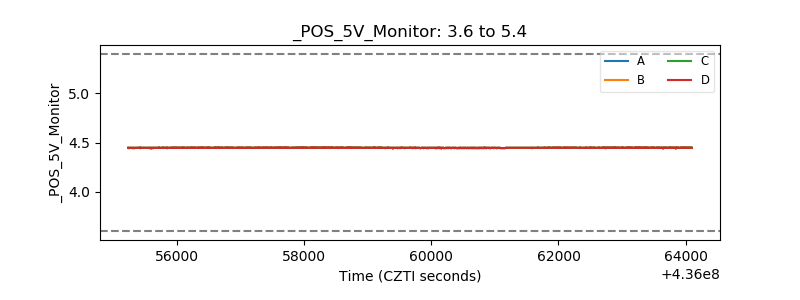 |
| _ROLL_ROT | 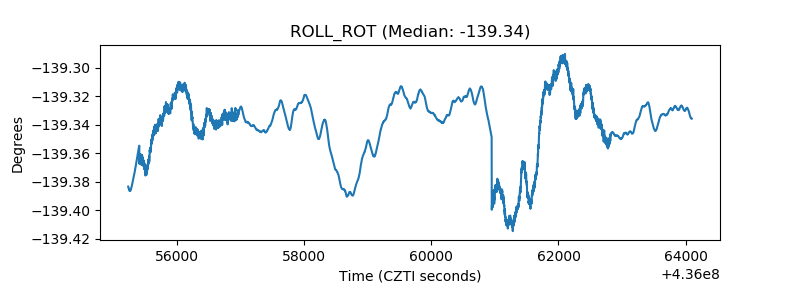 |
| _Roll_DEC | 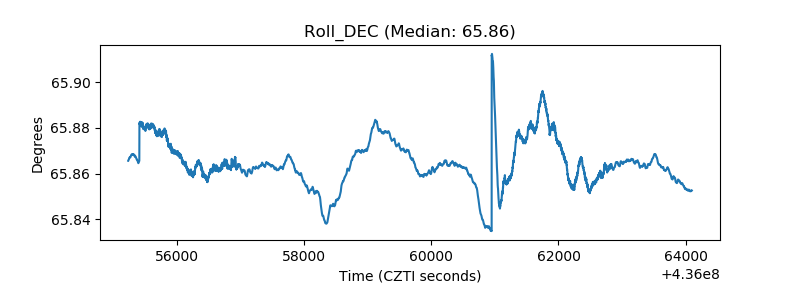 |
| _Roll_RA | 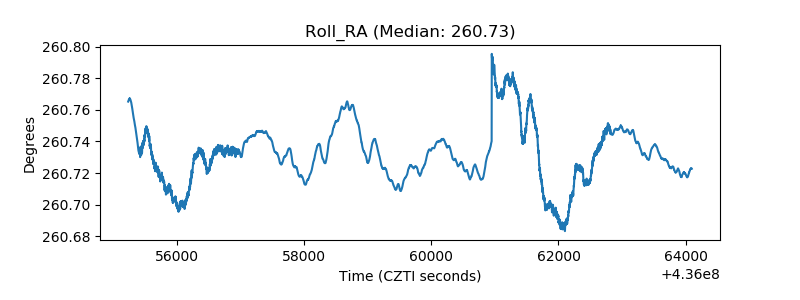 |
| Veto Counter | 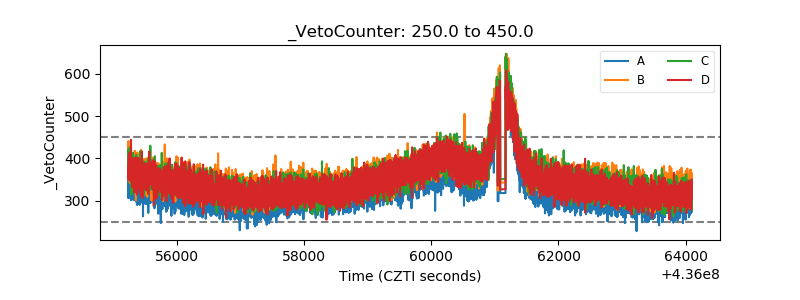 |