| Param | Original file | Final file |
|---|---|---|
| Filename | modeM0/AS1A13_008T01_9000005898_43685cztM0_level2.fits | modeM0/AS1A13_008T01_9000005898_43685cztM0_level2_quad_clean.evt |
| Size (bytes) | 1,265,564,160 | 111,242,880 |
| Size | 1.2 GB | 106.1 MB |
| Events in quadrant A | 15,247,093 | 760,257 |
| Events in quadrant B | 5,033,501 | 847,201 |
| Events in quadrant C | 17,546,219 | 498,798 |
| Events in quadrant D | 8,422,427 | 717,259 |
| Mode M9 | |||
|---|---|---|---|
| Quadrant | BADHDUFLAG | Total packets | Discarded packets |
| A | 0 | 7 | 0 |
| B | 0 | 7 | 0 |
| C | 0 | 7 | 0 |
| D | 0 | 7 | 0 |
| Mode SS | |||
|---|---|---|---|
| Quadrant | BADHDUFLAG | Total packets | Discarded packets |
| A | 0 | 156 | 0 |
| B | 0 | 156 | 0 |
| C | 0 | 156 | 0 |
| D | 0 | 156 | 0 |
| Mode M0 | |||
|---|---|---|---|
| Quadrant | BADHDUFLAG | Total packets | Discarded packets |
| A | 0 | 50625 | 1 |
| B | 0 | 20234 | 1 |
| C | 0 | 57452 | 1 |
| D | 0 | 30420 | 1 |
| Quadrant | Total seconds | Saturated seconds | Saturation percentage |
|---|---|---|---|
| A | 7763 | 4001 | 51.539353% |
| B | 7763 | 369 | 4.753317% |
| C | 7763 | 5944 | 76.568337% |
| D | 7763 | 1238 | 15.947443% |
Noise dominated data is calculated using 1-second bins in cleaned event files. If a bin has >2000 counts, and if more than 50% of those come from <1% of pixels, then it is considered to be noise-dominated and hence unusable.
| Quadrant | # 1 sec bins | Bins with >0 counts | Bins with >2000 counts | High rate bins dominated by noise | Noise dominated (total time) | Noise dominated (detector-on time) | Marked lightcurve |
|---|---|---|---|---|---|---|---|
| A | 8183 | 7764 | 3675 | 3675 | 44.91% | 47.33% | 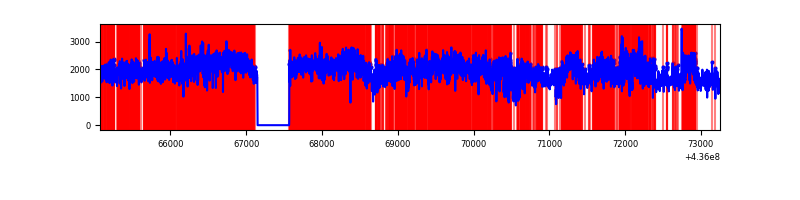 |
| B | 8183 | 7764 | 127 | 127 | 1.55% | 1.64% | 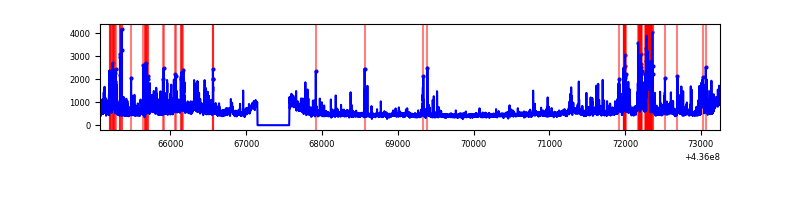 |
| C | 8183 | 7764 | 5416 | 5416 | 66.19% | 69.76% | 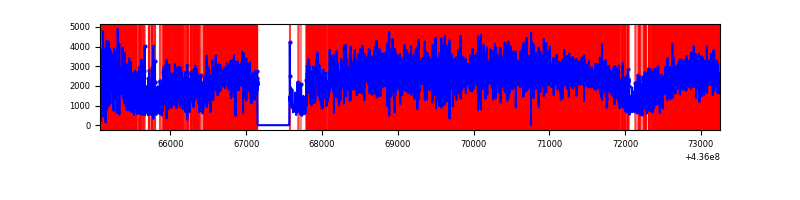 |
| D | 8183 | 7764 | 836 | 836 | 10.22% | 10.77% | 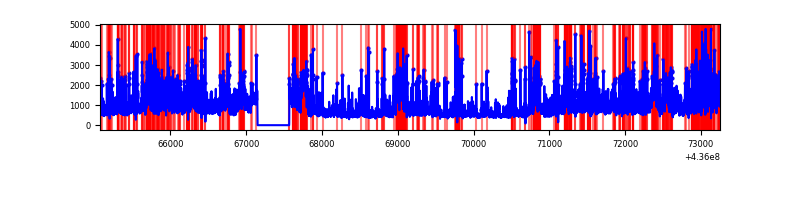 |
Top three noisy pixels from each quadrant. If the there are fewer than three noisy pixels in the level2.evt file, extra rows are filled as -1
| Pixel properties | Quadrant properties | ||||||
|---|---|---|---|---|---|---|---|
| Quadrant | DetID | PixID | Counts | Sigma | Mean | Median | Sigma |
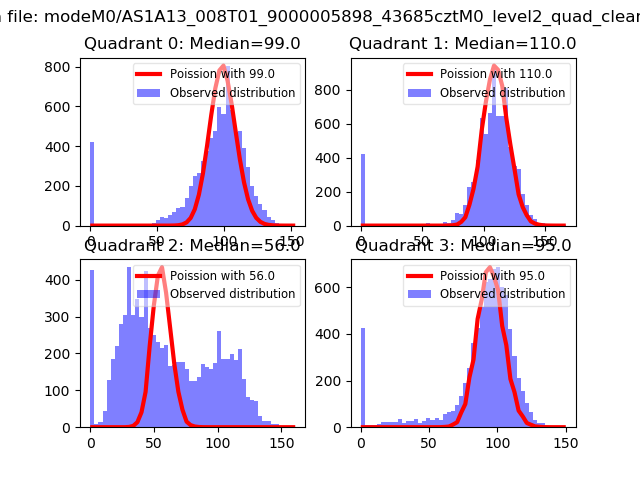
| A | 15 | 222 | 8015890 | 47488.23 | 811 | 794 | 168.8 |
| A | 14 | 63 | 2811583 | 16653.5 | 811 | 794 | 168.8 |
| A | 10 | 83 | 917192 | 5429.52 | 811 | 794 | 168.8 |
| B | 0 | 200 | 425275 | 2409.03 | 893 | 869 | 176.2 |
| B | 5 | 255 | 247195 | 1398.21 | 893 | 869 | 176.2 |
| B | 5 | 235 | 236240 | 1336.02 | 893 | 869 | 176.2 |
| C | 15 | 142 | 13448117 | 104399.49 | 537 | 541 | 128.8 |
| C | 15 | 157 | 803078 | 6230.45 | 537 | 541 | 128.8 |
| C | 15 | 158 | 501762 | 3891.2 | 537 | 541 | 128.8 |
| D | 5 | 235 | 586737 | 2630.45 | 836 | 813 | 222.7 |
| D | 13 | 249 | 540122 | 2421.18 | 836 | 813 | 222.7 |
| D | 14 | 210 | 495650 | 2221.53 | 836 | 813 | 222.7 |
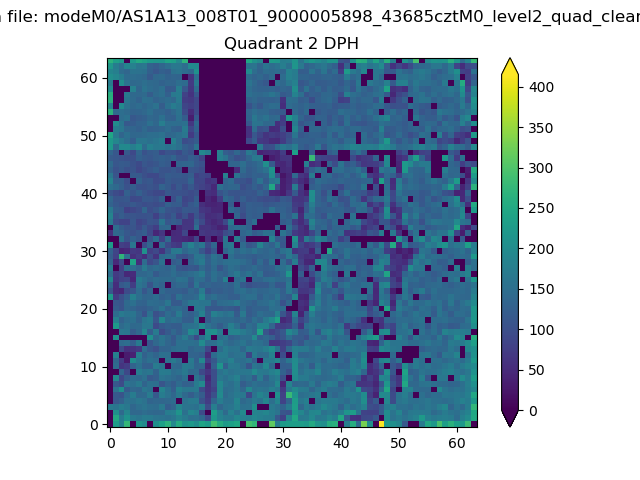
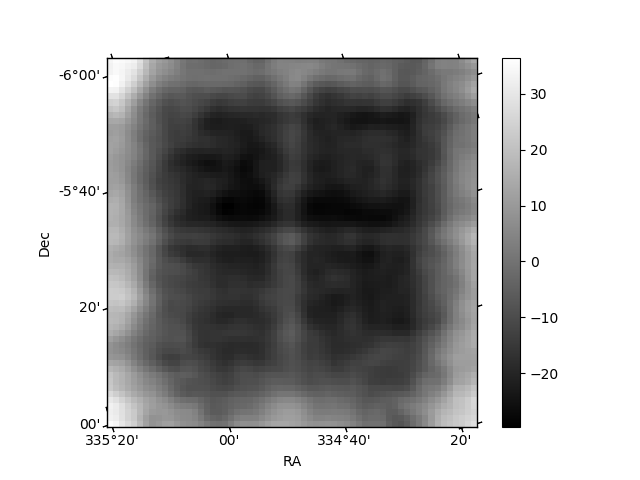
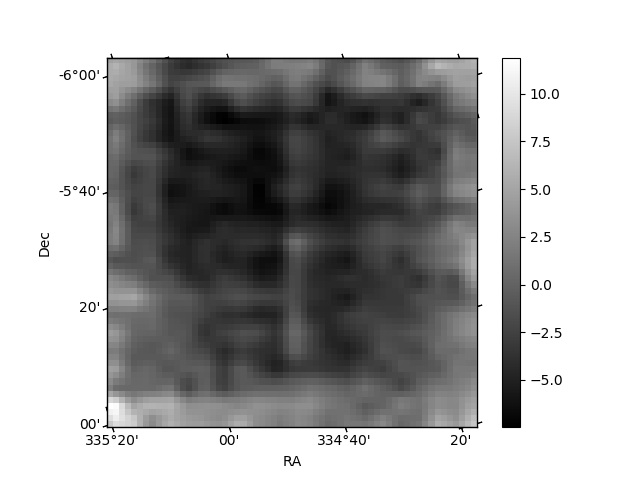
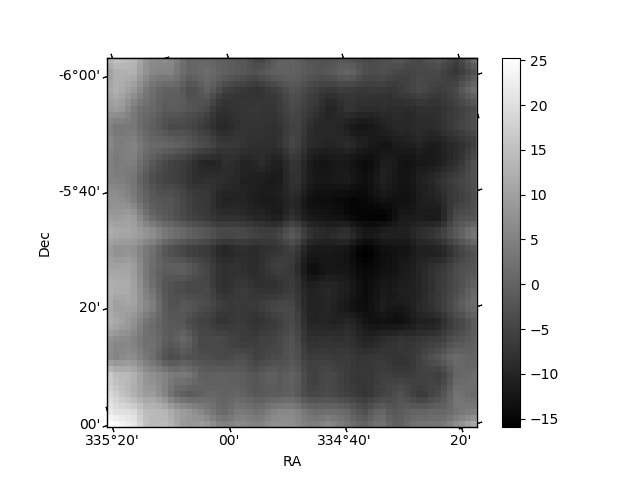
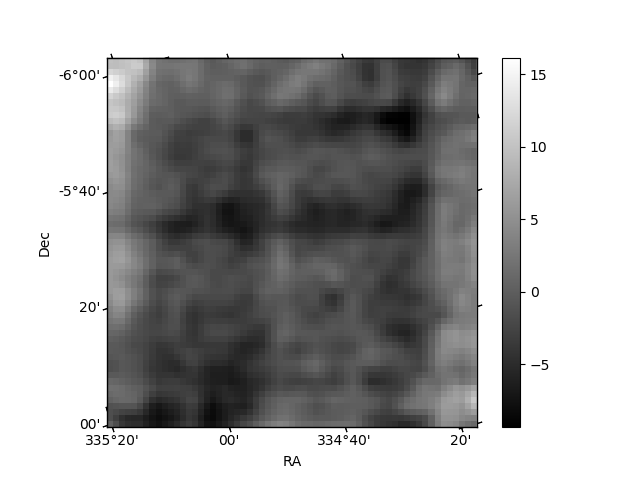
Histogram calculated using DETX and DETY for each event in the final _common_clean file
| Quadrant A | 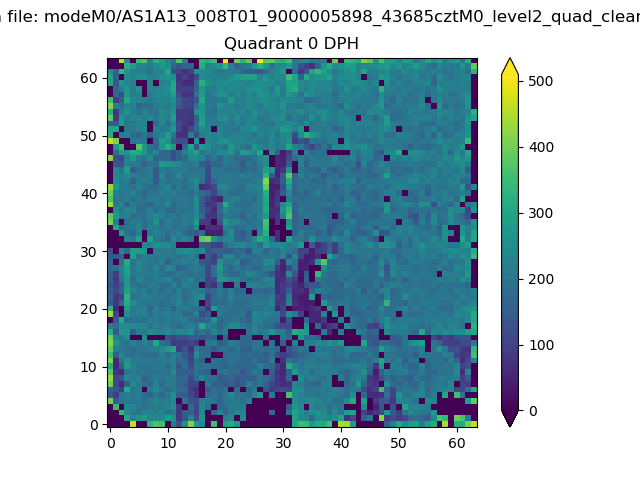 |
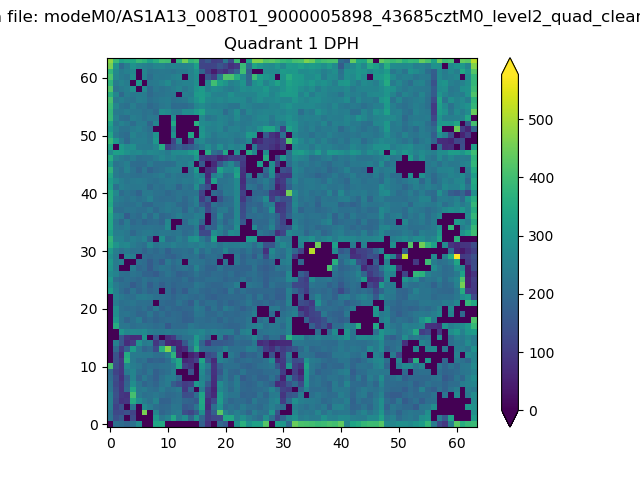 |
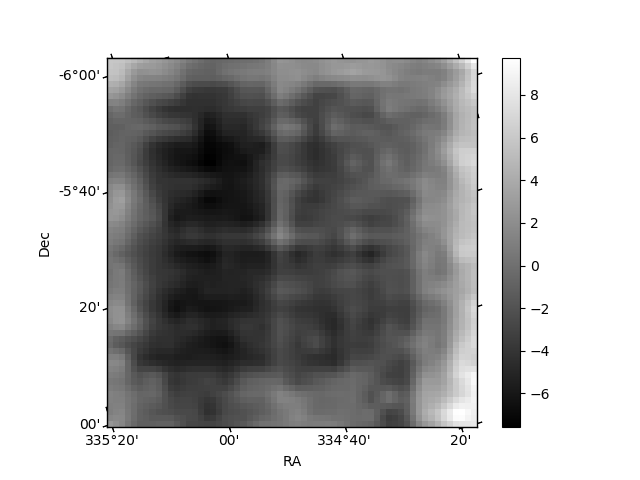
Quadrant B |
|---|---|---|---|
| Quadrant D | 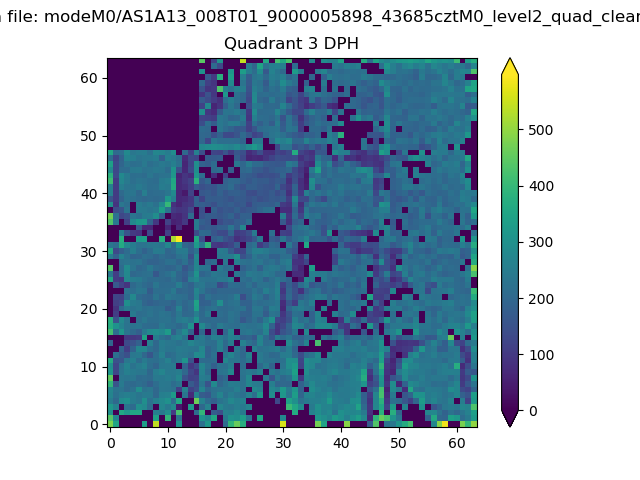 |
 |
Quadrant C |
| Plot type | Count rate plots | Images |
|---|---|---|
| Comparison with Poisson distribution Blue bars denote a histogram of data divided into 1 sec bins. Red curve is a Poisson curve with rate = median count rate of data. |
 |
 |
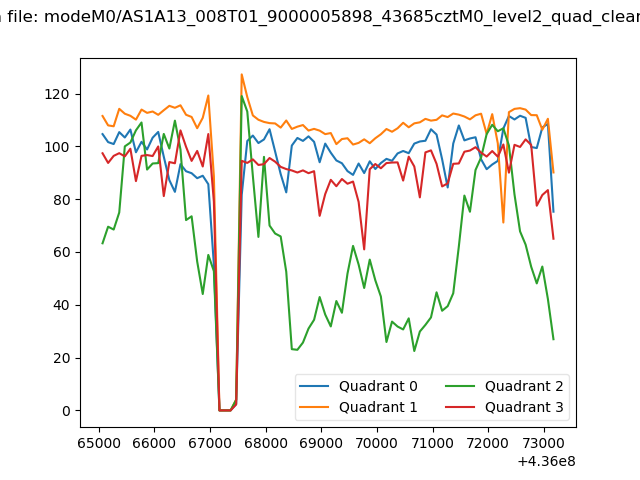
| Quadrant-wise count rates Data is divided into 100 sec bins |
 |
|
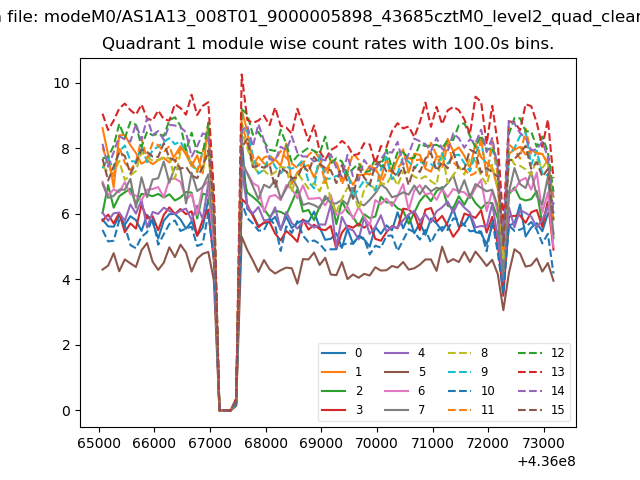
| Module-wise count rates for Quadrant A Data is divided into 100 sec bins |
 |
 |
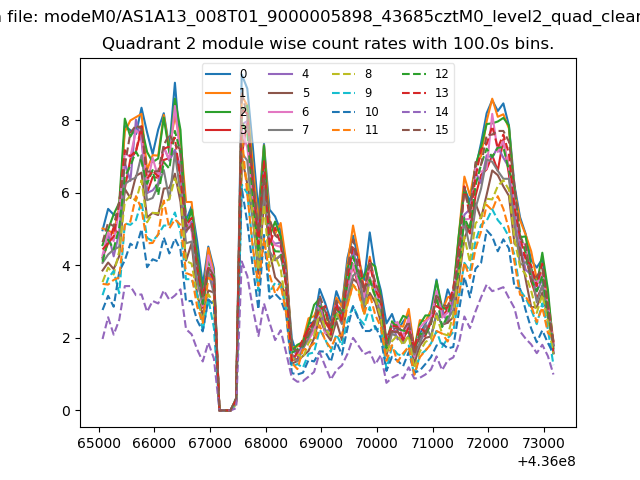
| Module-wise count rates for Quadrant B Data is divided into 100 sec bins |
 |
 |
| Module-wise count rates for Quadrant C Data is divided into 100 sec bins |
 |
 |
| Module-wise count rates for Quadrant D Data is divided into 100 sec bins |
 |
 |
| Parameter | Plot |
|---|---|
| CZT HV Monitor | 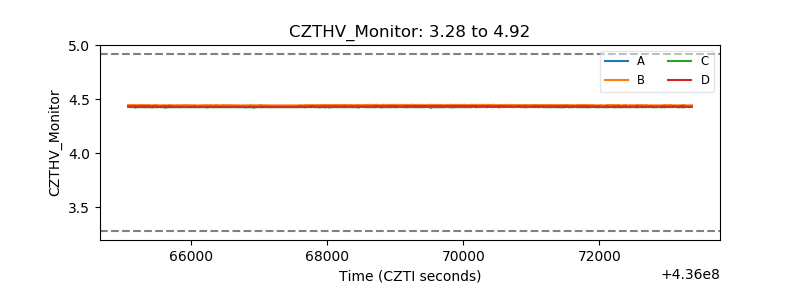 |
| D_VDD | 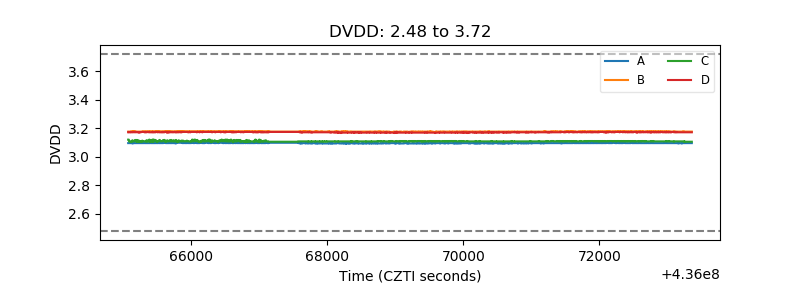 |
| Temperature 1 | 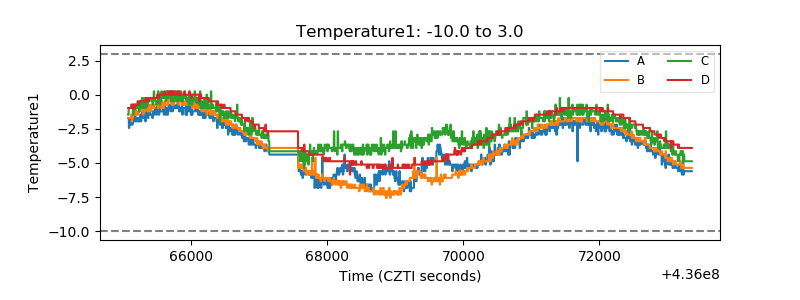 |
| Veto HV Monitor |  |
| Veto LLD | 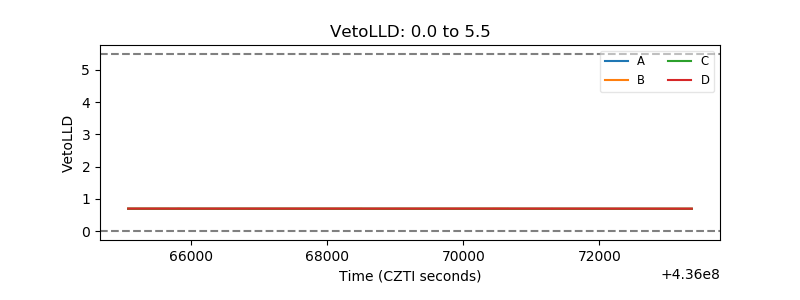 |
| Alpha Counter | 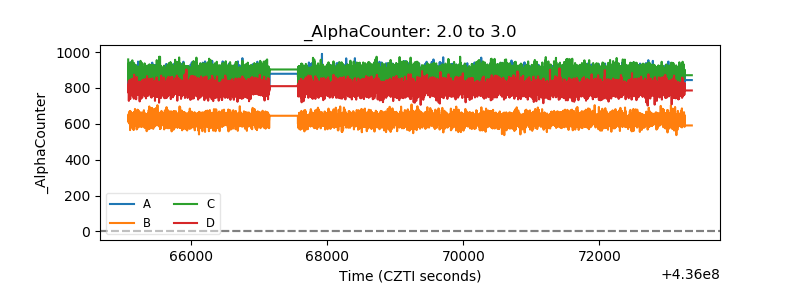 |
| _CPM_Rate | 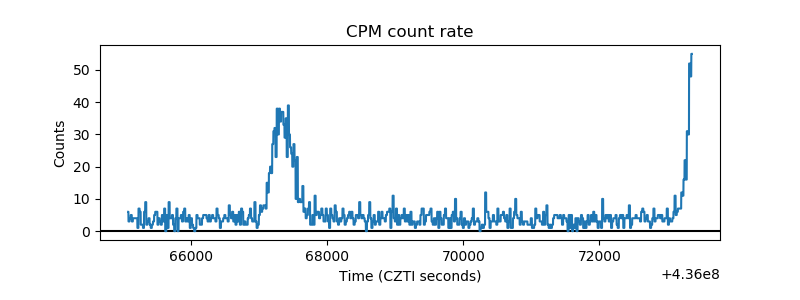 |
| CZT Counter | 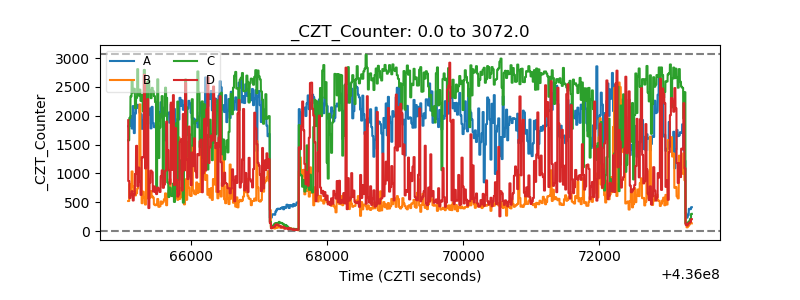 |
| +2.5 Volts monitor | 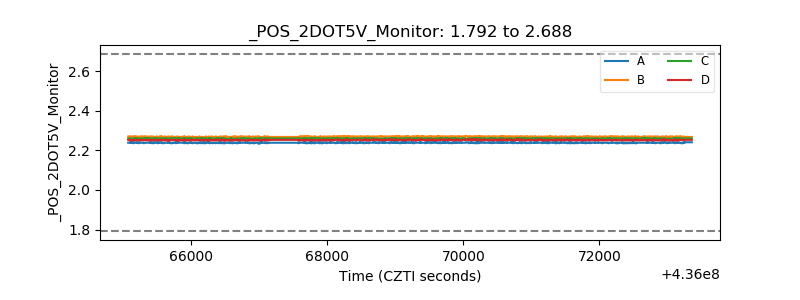 |
| +5 Volts monitor | 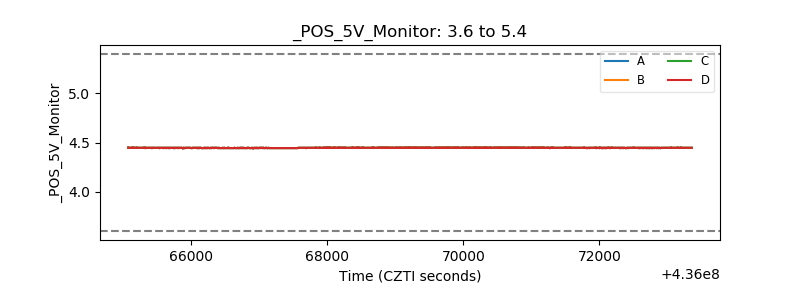 |
| _ROLL_ROT | 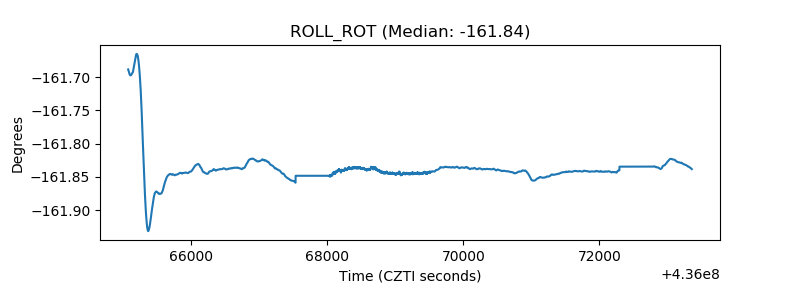 |
| _Roll_DEC | 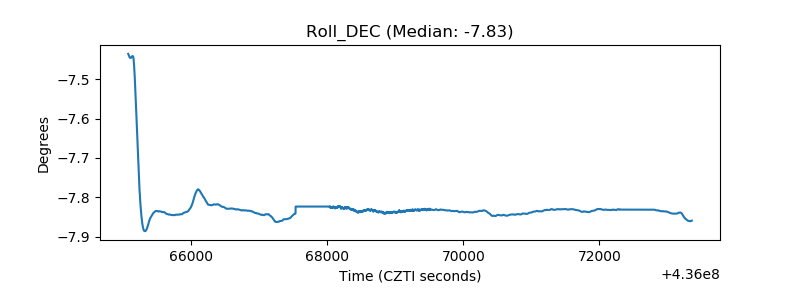 |
| _Roll_RA | 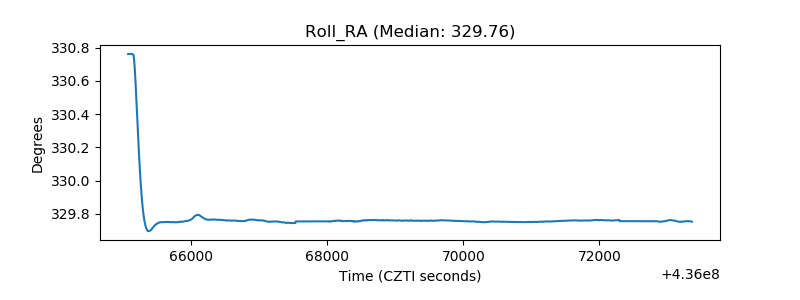 |
| Veto Counter | 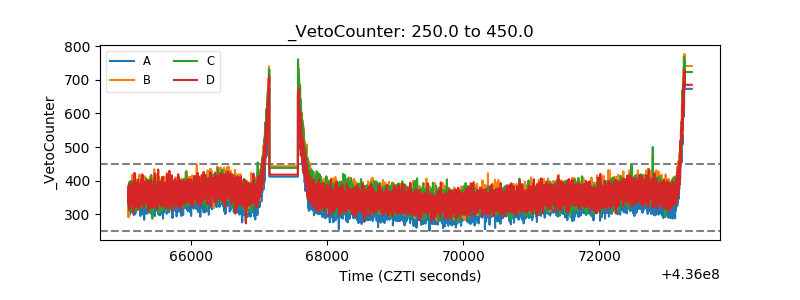 |