| Param | Original file | Final file |
|---|---|---|
| Filename | modeM0/AS1A13_008T01_9000005898_43686cztM0_level2.fits | modeM0/AS1A13_008T01_9000005898_43686cztM0_level2_quad_clean.evt |
| Size (bytes) | 1,033,113,600 | 110,180,160 |
| Size | 985.3 MB | 105.1 MB |
| Events in quadrant A | 10,961,811 | 774,991 |
| Events in quadrant B | 3,955,117 | 826,467 |
| Events in quadrant C | 15,786,956 | 520,249 |
| Events in quadrant D | 6,966,206 | 694,944 |
| Mode M9 | |||
|---|---|---|---|
| Quadrant | BADHDUFLAG | Total packets | Discarded packets |
| A | 0 | 16 | 0 |
| B | 0 | 16 | 0 |
| C | 0 | 16 | 0 |
| D | 0 | 16 | 0 |
| Mode SS | |||
|---|---|---|---|
| Quadrant | BADHDUFLAG | Total packets | Discarded packets |
| A | 0 | 150 | 0 |
| B | 0 | 150 | 0 |
| C | 0 | 150 | 0 |
| D | 0 | 150 | 0 |
| Mode M0 | |||
|---|---|---|---|
| Quadrant | BADHDUFLAG | Total packets | Discarded packets |
| A | 0 | 37772 | 2 |
| B | 0 | 16553 | 2 |
| C | 0 | 52029 | 2 |
| D | 0 | 25784 | 2 |
| Quadrant | Total seconds | Saturated seconds | Saturation percentage |
|---|---|---|---|
| A | 7419 | 1323 | 17.832592% |
| B | 7420 | 142 | 1.913747% |
| C | 7420 | 5240 | 70.619946% |
| D | 7420 | 849 | 11.442049% |
Noise dominated data is calculated using 1-second bins in cleaned event files. If a bin has >2000 counts, and if more than 50% of those come from <1% of pixels, then it is considered to be noise-dominated and hence unusable.
| Quadrant | # 1 sec bins | Bins with >0 counts | Bins with >2000 counts | High rate bins dominated by noise | Noise dominated (total time) | Noise dominated (detector-on time) | Marked lightcurve |
|---|---|---|---|---|---|---|---|
| A | 8934 | 7421 | 959 | 959 | 10.73% | 12.92% | 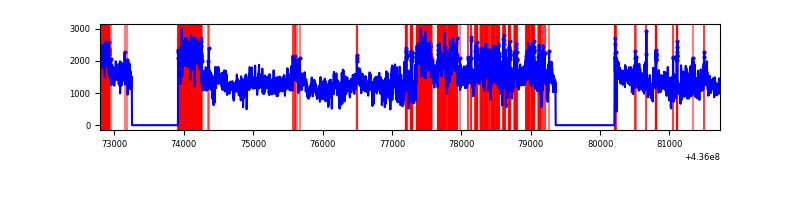 |
| B | 8935 | 7422 | 12 | 12 | 0.13% | 0.16% | 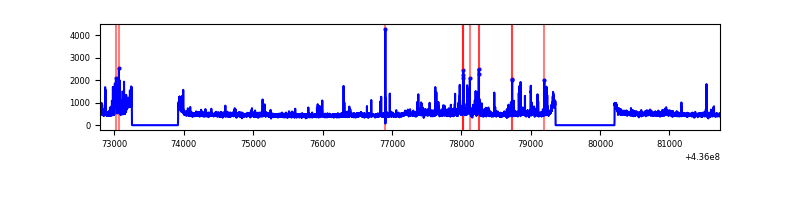 |
| C | 8935 | 7421 | 4399 | 4399 | 49.23% | 59.28% | 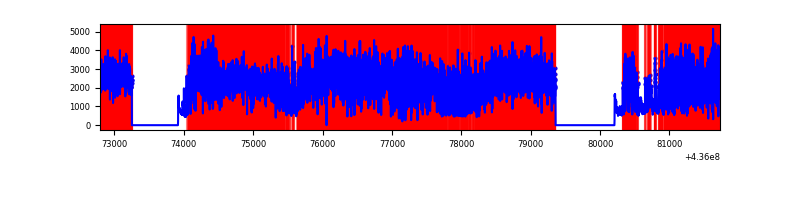 |
| D | 8935 | 7422 | 608 | 608 | 6.80% | 8.19% | 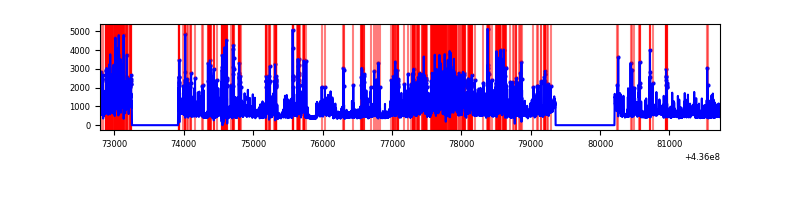 |
Top three noisy pixels from each quadrant. If the there are fewer than three noisy pixels in the level2.evt file, extra rows are filled as -1
| Pixel properties | Quadrant properties | ||||||
|---|---|---|---|---|---|---|---|
| Quadrant | DetID | PixID | Counts | Sigma | Mean | Median | Sigma |
| A | 15 | 222 | 4935314 | 29011.42 | 821 | 803 | 170.1 |
| A | 14 | 63 | 1486663 | 8735.8 | 821 | 803 | 170.1 |
| A | 10 | 83 | 931377 | 5471.11 | 821 | 803 | 170.1 |
| B | 5 | 235 | 127003 | 731.0 | 864 | 839 | 172.6 |
| B | 0 | 200 | 120386 | 692.66 | 864 | 839 | 172.6 |
| B | 0 | 230 | 99137 | 569.54 | 864 | 839 | 172.6 |
| C | 15 | 142 | 9762485 | 72918.62 | 564 | 567 | 133.9 |
| C | 15 | 157 | 3240168 | 24198.86 | 564 | 567 | 133.9 |
| C | 3 | 233 | 351975 | 2624.91 | 564 | 567 | 133.9 |
| D | 5 | 235 | 683784 | 3279.02 | 810 | 785 | 208.3 |
| D | 1 | 52 | 479956 | 2300.46 | 810 | 785 | 208.3 |
| D | 7 | 80 | 326673 | 1564.56 | 810 | 785 | 208.3 |
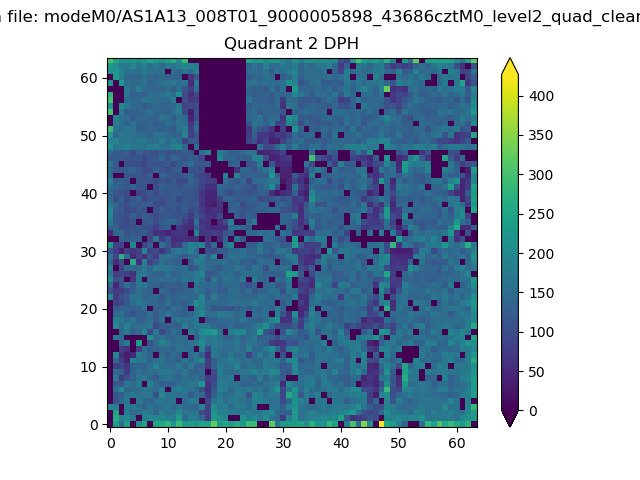
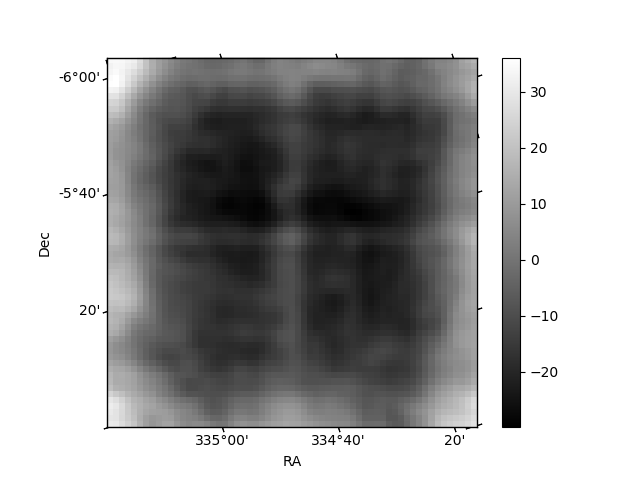
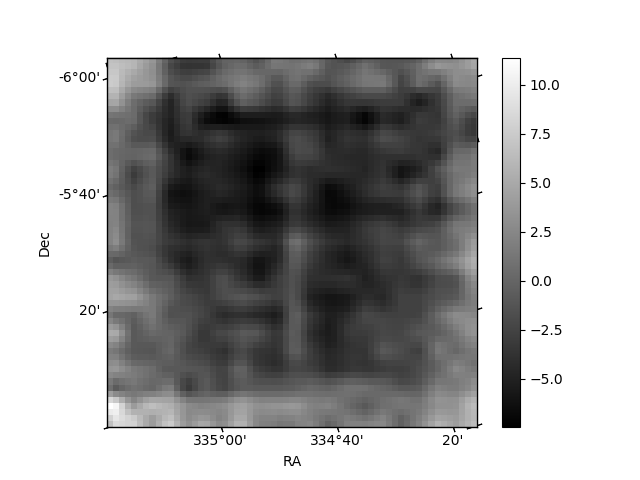
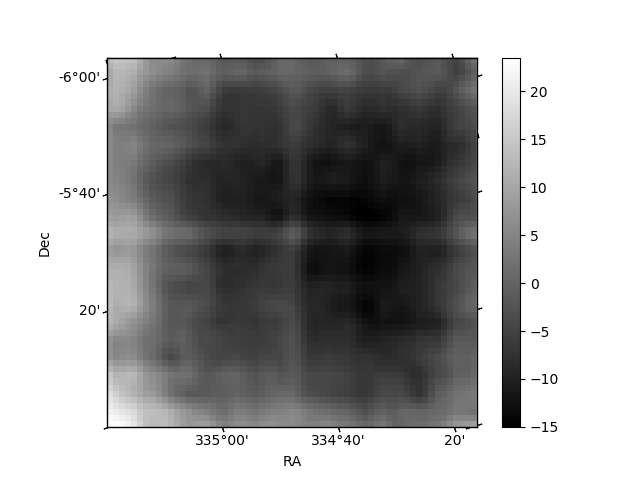
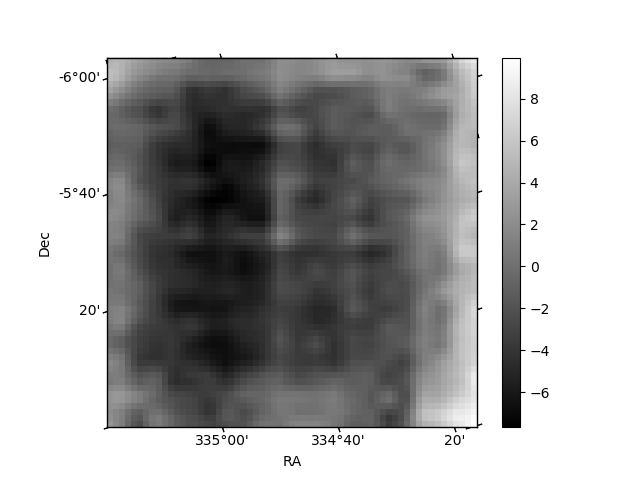
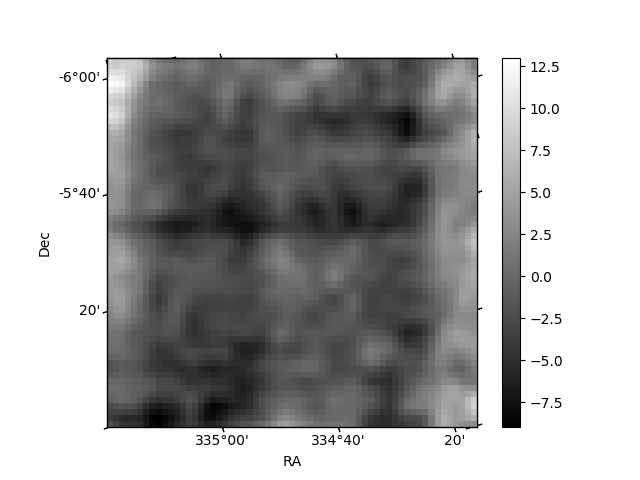
Histogram calculated using DETX and DETY for each event in the final _common_clean file
| Quadrant A | 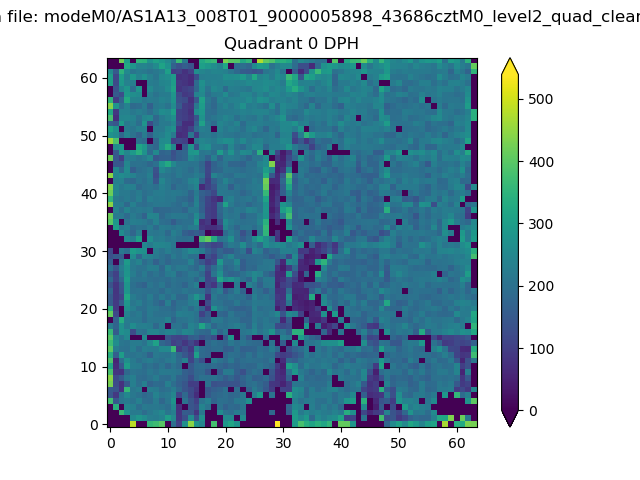 |
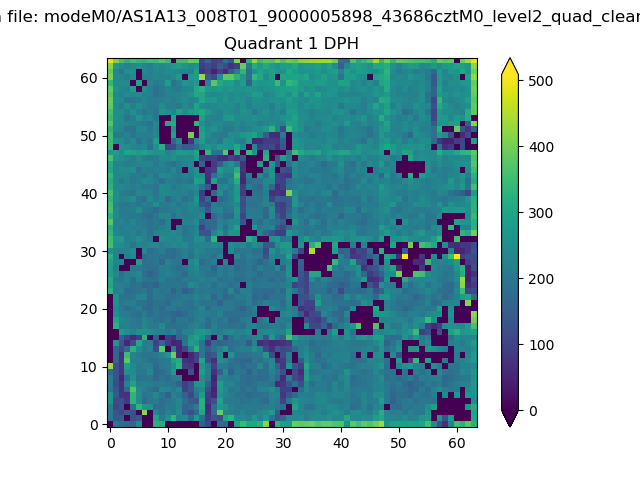 |
Quadrant B |
|---|---|---|---|
| Quadrant D | 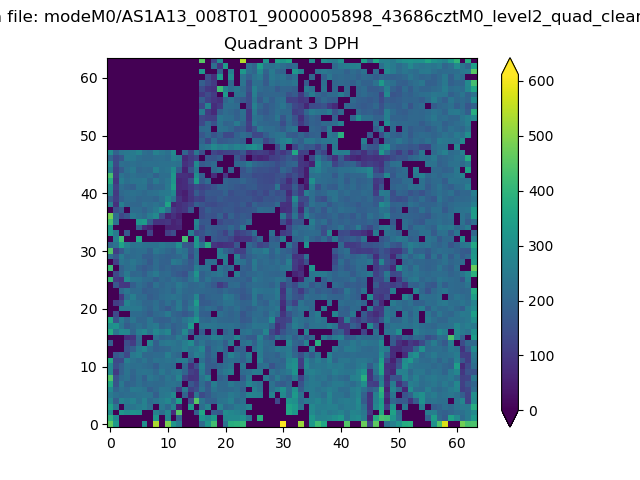 |
 |
Quadrant C |
| Plot type | Count rate plots | Images |
|---|---|---|
| Comparison with Poisson distribution Blue bars denote a histogram of data divided into 1 sec bins. Red curve is a Poisson curve with rate = median count rate of data. |
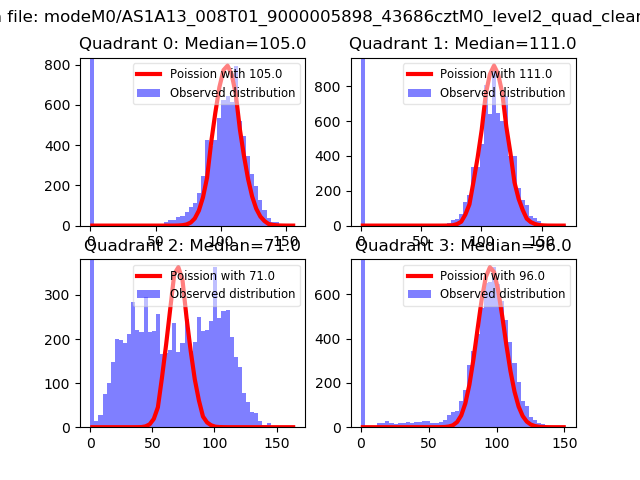 |
 |
| Quadrant-wise count rates Data is divided into 100 sec bins |
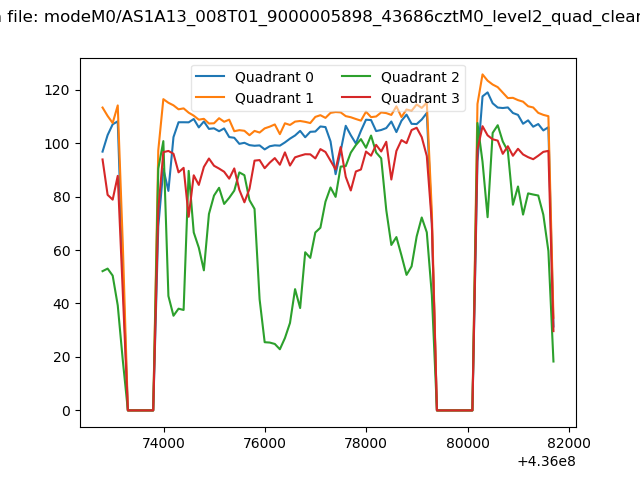 |
|
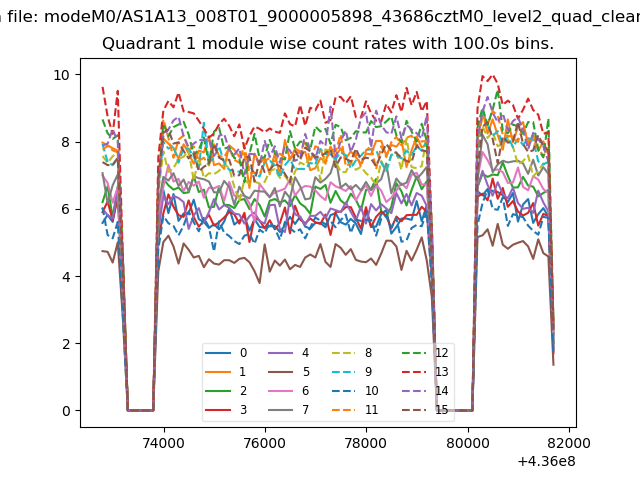
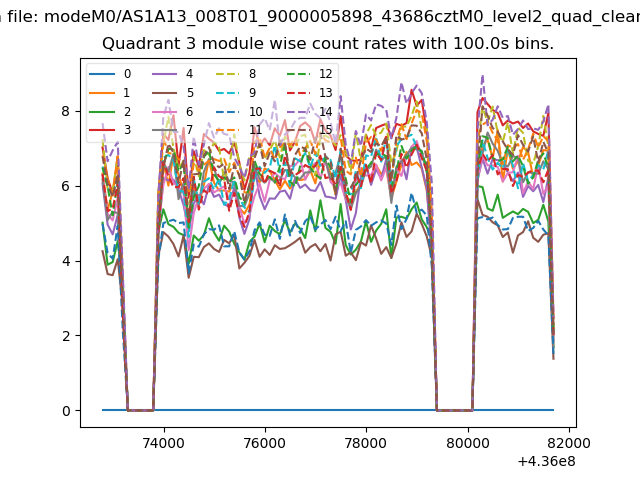
| Module-wise count rates for Quadrant A Data is divided into 100 sec bins |
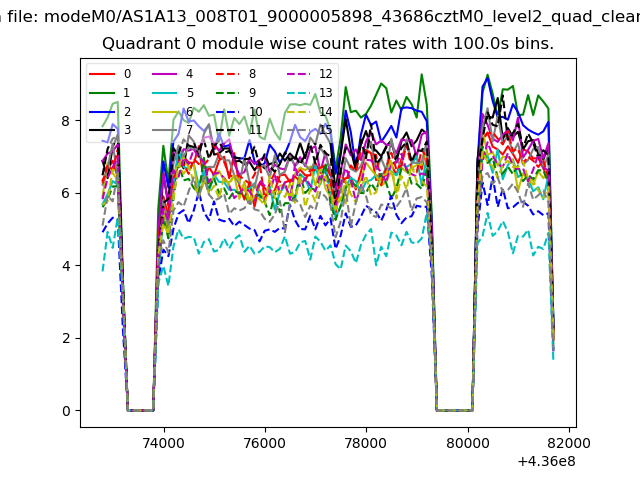 |
 |
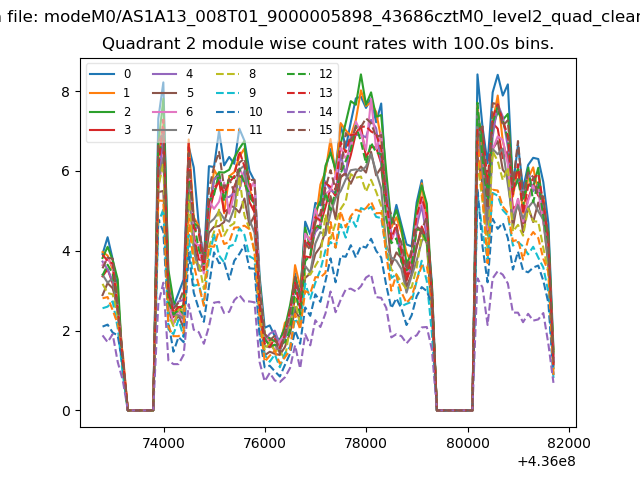
| Module-wise count rates for Quadrant B Data is divided into 100 sec bins |
 |
 |
| Module-wise count rates for Quadrant C Data is divided into 100 sec bins |
 |
 |
| Module-wise count rates for Quadrant D Data is divided into 100 sec bins |
 |
 |
| Parameter | Plot |
|---|---|
| CZT HV Monitor | 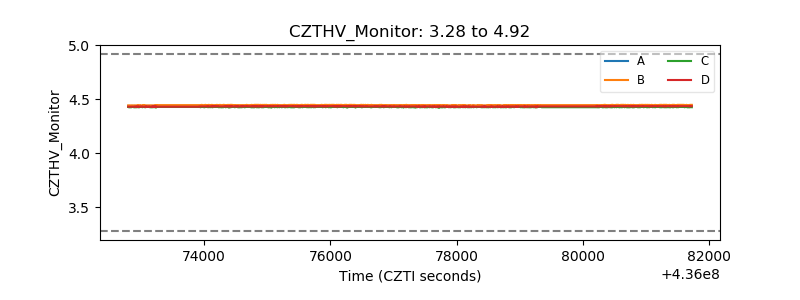 |
| D_VDD | 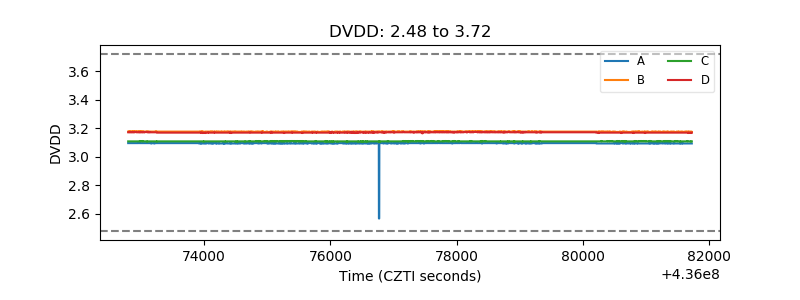 |
| Temperature 1 | 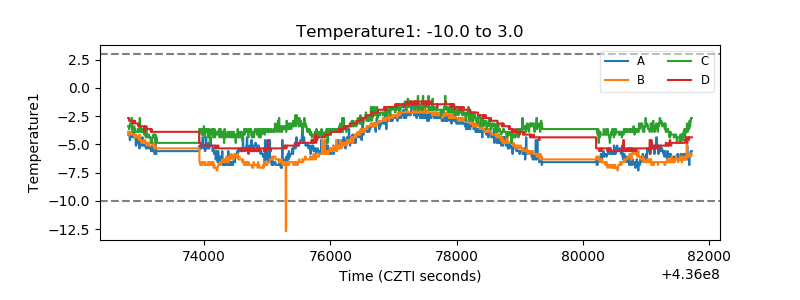 |
| Veto HV Monitor | 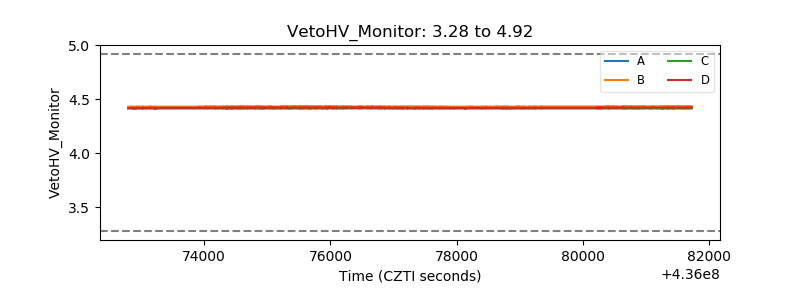 |
| Veto LLD | 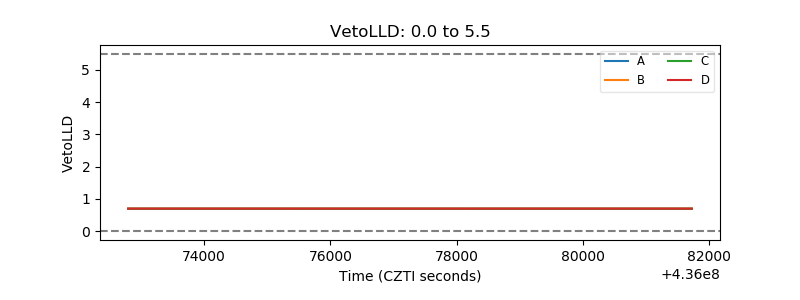 |
| Alpha Counter | 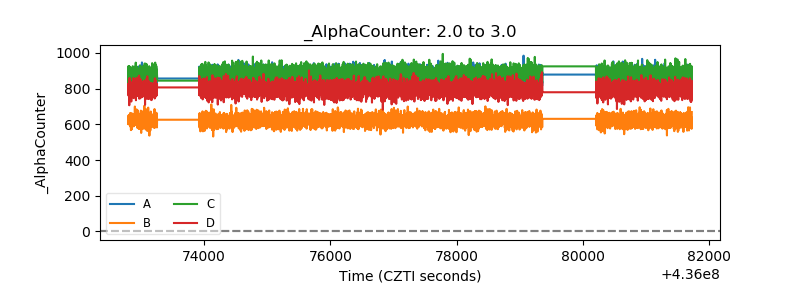 |
| _CPM_Rate | 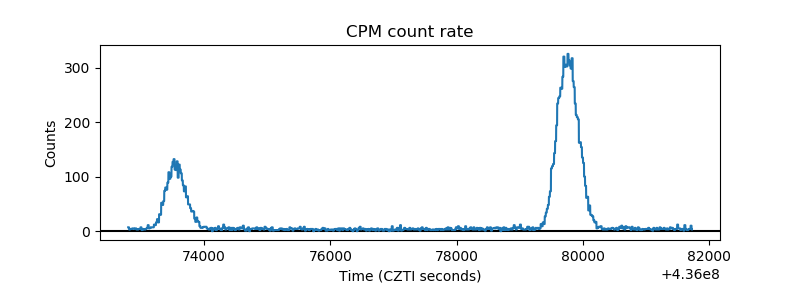 |
| CZT Counter | 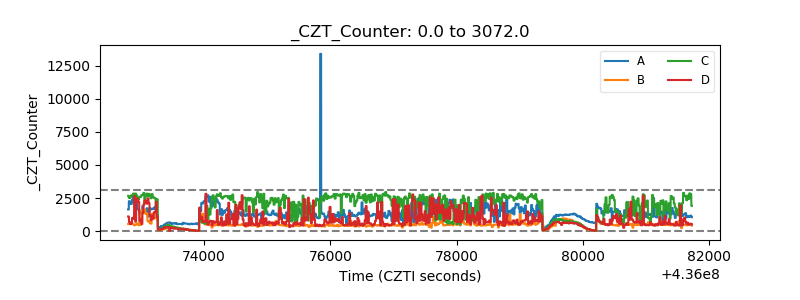 |
| +2.5 Volts monitor | 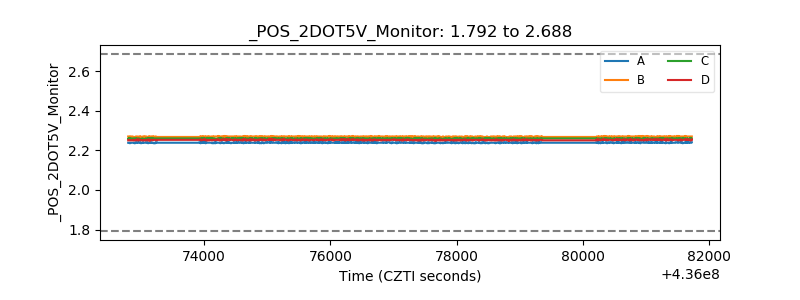 |
| +5 Volts monitor | 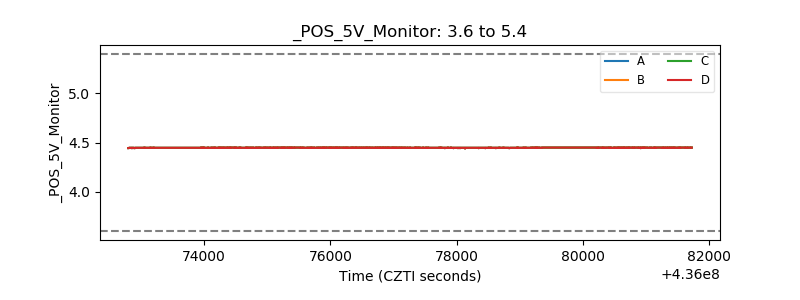 |
| _ROLL_ROT | 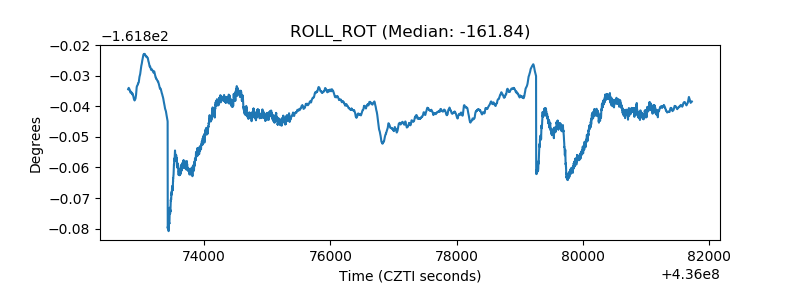 |
| _Roll_DEC |  |
| _Roll_RA | 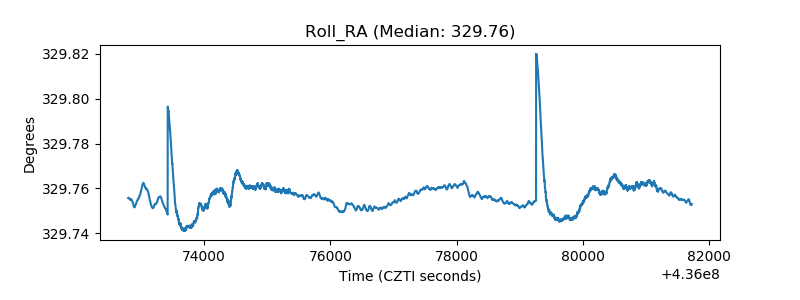 |
| Veto Counter | 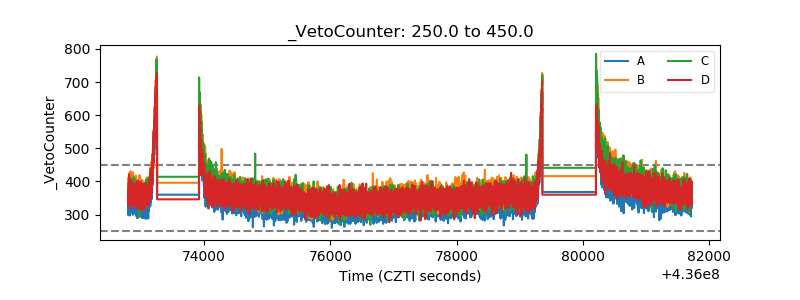 |