| Param | Original file | Final file |
|---|---|---|
| Filename | modeM0/AS1A13_008T01_9000005898_43687cztM0_level2.fits | modeM0/AS1A13_008T01_9000005898_43687cztM0_level2_quad_clean.evt |
| Size (bytes) | 945,092,160 | 102,349,440 |
| Size | 901.3 MB | 97.6 MB |
| Events in quadrant A | 11,406,152 | 685,842 |
| Events in quadrant B | 3,723,269 | 775,434 |
| Events in quadrant C | 13,833,048 | 510,687 |
| Events in quadrant D | 5,505,499 | 657,503 |
| Mode M9 | |||
|---|---|---|---|
| Quadrant | BADHDUFLAG | Total packets | Discarded packets |
| A | 0 | 14 | 0 |
| B | 0 | 15 | 0 |
| C | 0 | 15 | 0 |
| D | 0 | 15 | 0 |
| Mode SS | |||
|---|---|---|---|
| Quadrant | BADHDUFLAG | Total packets | Discarded packets |
| A | 0 | 136 | 0 |
| B | 0 | 136 | 0 |
| C | 0 | 136 | 0 |
| D | 0 | 136 | 0 |
| Mode M0 | |||
|---|---|---|---|
| Quadrant | BADHDUFLAG | Total packets | Discarded packets |
| A | 0 | 38528 | 2 |
| B | 0 | 15289 | 2 |
| C | 0 | 45740 | 4 |
| D | 0 | 20784 | 2 |
| Quadrant | Total seconds | Saturated seconds | Saturation percentage |
|---|---|---|---|
| A | 6685 | 2472 | 36.978310% |
| B | 6685 | 146 | 2.183994% |
| C | 6684 | 4435 | 66.352484% |
| D | 6684 | 518 | 7.749850% |
Noise dominated data is calculated using 1-second bins in cleaned event files. If a bin has >2000 counts, and if more than 50% of those come from <1% of pixels, then it is considered to be noise-dominated and hence unusable.
| Quadrant | # 1 sec bins | Bins with >0 counts | Bins with >2000 counts | High rate bins dominated by noise | Noise dominated (total time) | Noise dominated (detector-on time) | Marked lightcurve |
|---|---|---|---|---|---|---|---|
| A | 7670 | 6686 | 1977 | 1977 | 25.78% | 29.57% | 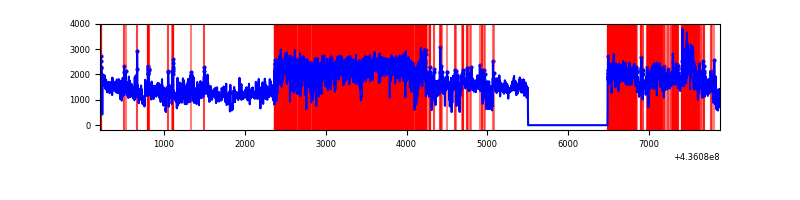 |
| B | 7670 | 6686 | 23 | 23 | 0.30% | 0.34% | 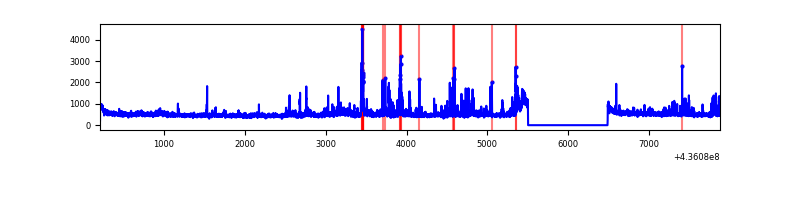 |
| C | 7668 | 6684 | 3686 | 3686 | 48.07% | 55.15% | 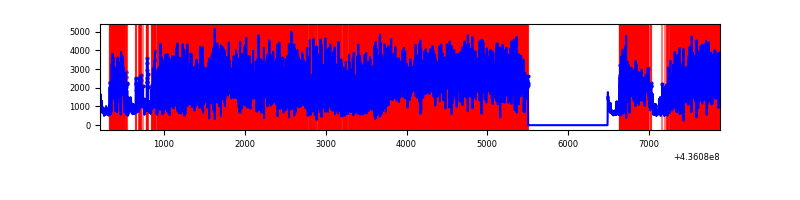 |
| D | 7669 | 6684 | 348 | 348 | 4.54% | 5.21% | 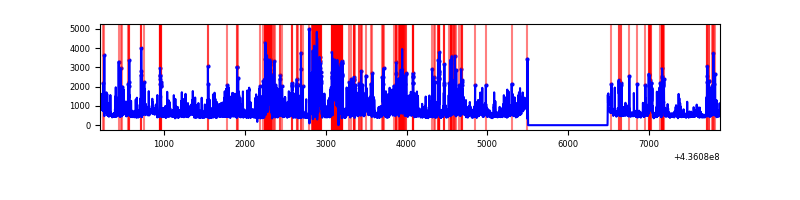 |
Top three noisy pixels from each quadrant. If the there are fewer than three noisy pixels in the level2.evt file, extra rows are filled as -1
| Pixel properties | Quadrant properties | ||||||
|---|---|---|---|---|---|---|---|
| Quadrant | DetID | PixID | Counts | Sigma | Mean | Median | Sigma |
| A | 15 | 222 | 4654351 | 31632.23 | 715 | 701 | 147.1 |
| A | 14 | 63 | 2590406 | 17602.99 | 715 | 701 | 147.1 |
| A | 10 | 83 | 823049 | 5589.74 | 715 | 701 | 147.1 |
| B | 5 | 235 | 171302 | 1104.69 | 787 | 765 | 154.4 |
| B | 4 | 171 | 131063 | 844.03 | 787 | 765 | 154.4 |
| B | 4 | 206 | 87107 | 559.3 | 787 | 765 | 154.4 |
| C | 15 | 142 | 8243912 | 64569.39 | 537 | 540 | 127.7 |
| C | 15 | 157 | 2364385 | 18515.73 | 537 | 540 | 127.7 |
| C | 3 | 233 | 899574 | 7042.03 | 537 | 540 | 127.7 |
| D | 5 | 235 | 415081 | 2138.4 | 754 | 730 | 193.8 |
| D | 12 | 233 | 385404 | 1985.25 | 754 | 730 | 193.8 |
| D | 14 | 210 | 273129 | 1405.81 | 754 | 730 | 193.8 |
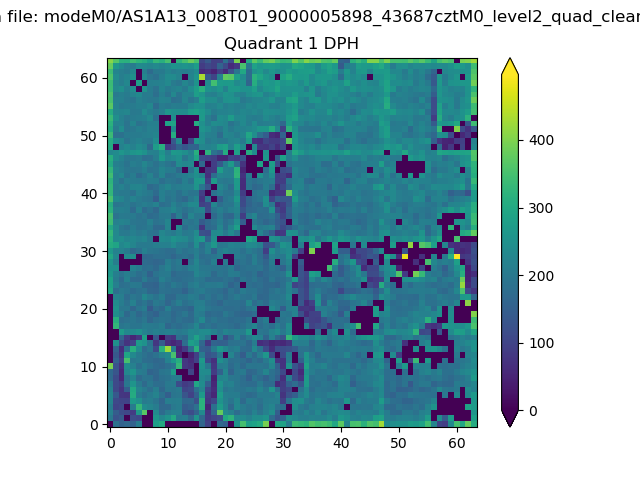
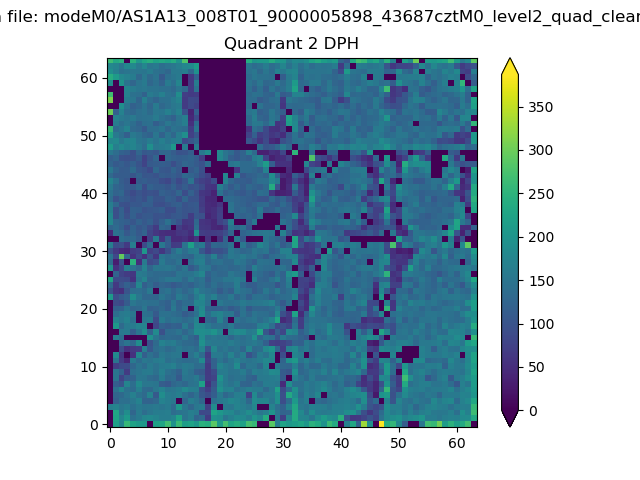
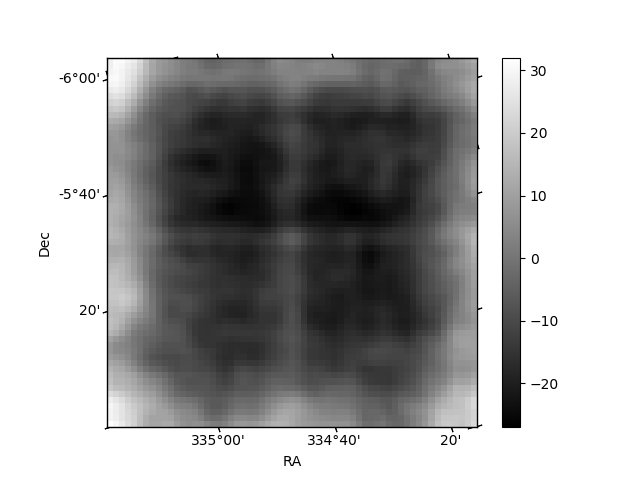
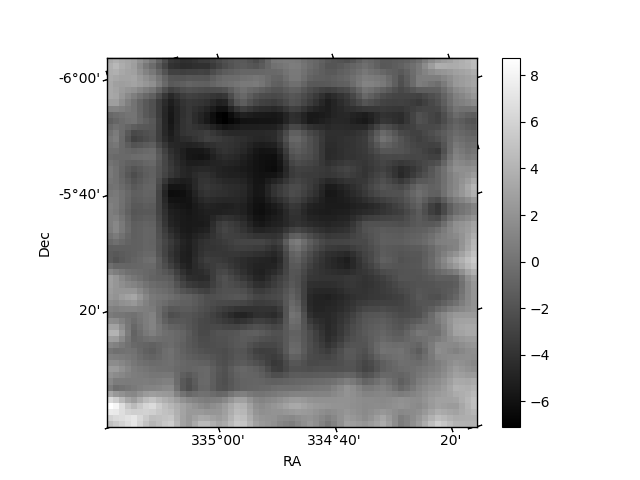
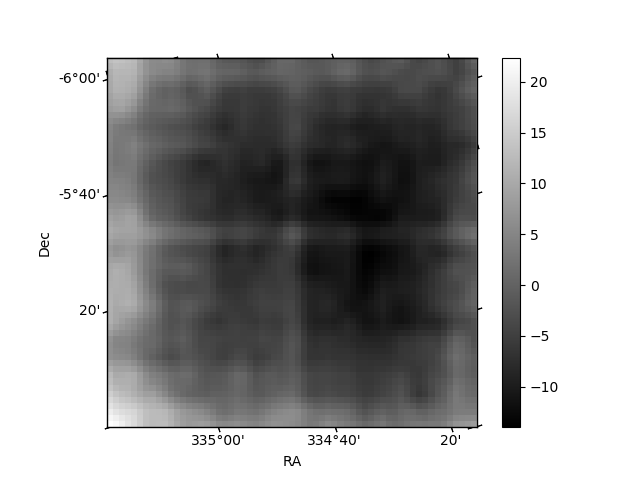
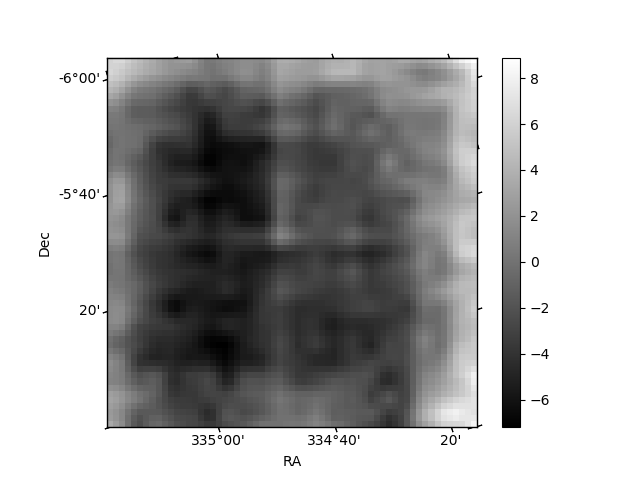
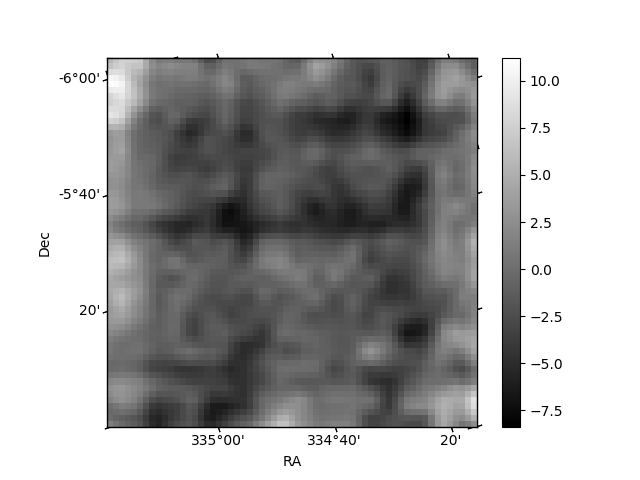
Histogram calculated using DETX and DETY for each event in the final _common_clean file
| Quadrant A |  |
 |
Quadrant B |
|---|---|---|---|
| Quadrant D | 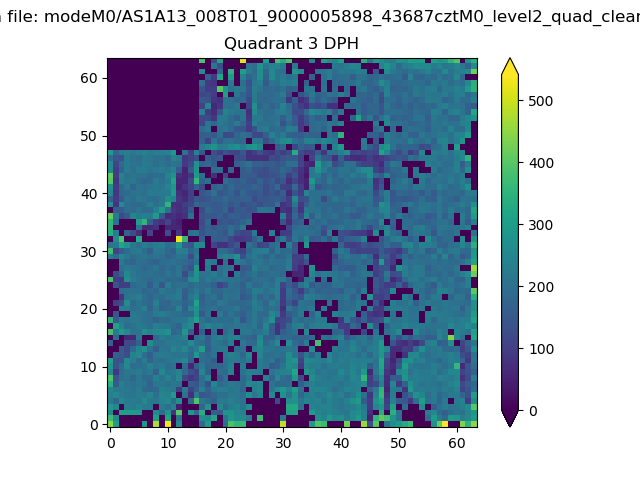 |
 |
Quadrant C |
| Plot type | Count rate plots | Images |
|---|---|---|
| Comparison with Poisson distribution Blue bars denote a histogram of data divided into 1 sec bins. Red curve is a Poisson curve with rate = median count rate of data. |
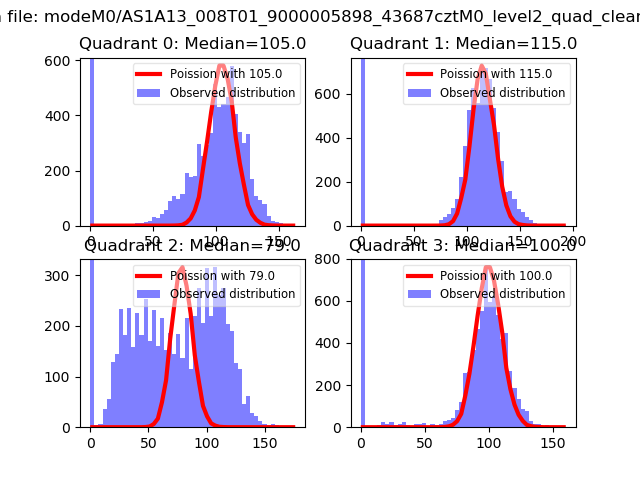 |
 |
| Quadrant-wise count rates Data is divided into 100 sec bins |
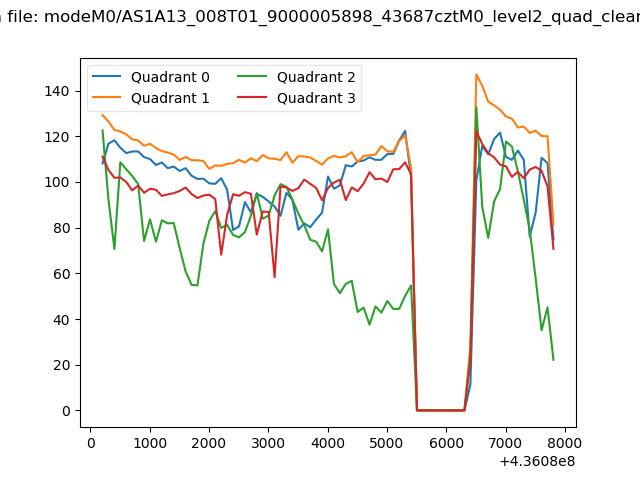 |
|
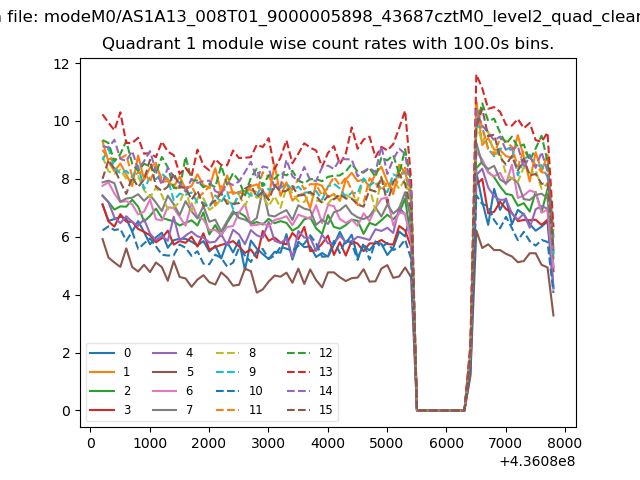
| Module-wise count rates for Quadrant A Data is divided into 100 sec bins |
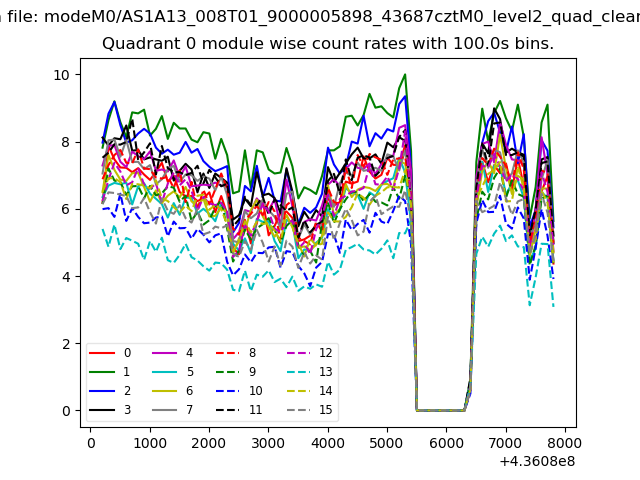 |
 |
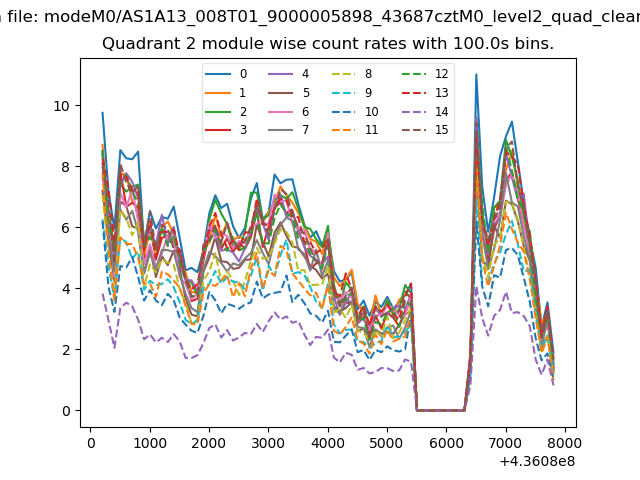
| Module-wise count rates for Quadrant B Data is divided into 100 sec bins |
 |
 |
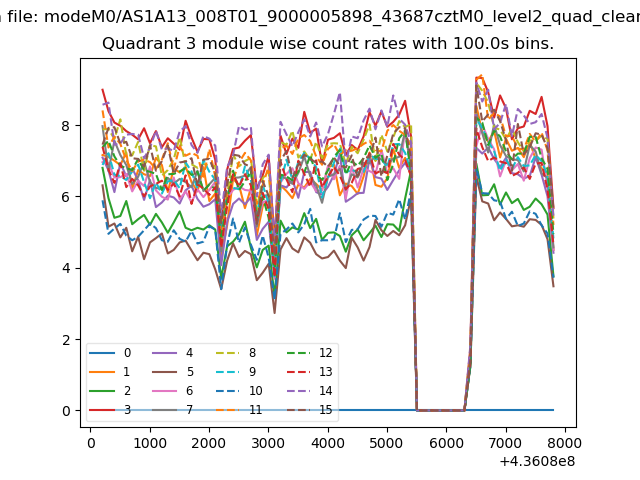
| Module-wise count rates for Quadrant C Data is divided into 100 sec bins |
 |
 |
| Module-wise count rates for Quadrant D Data is divided into 100 sec bins |
 |
 |
| Parameter | Plot |
|---|---|
| CZT HV Monitor | 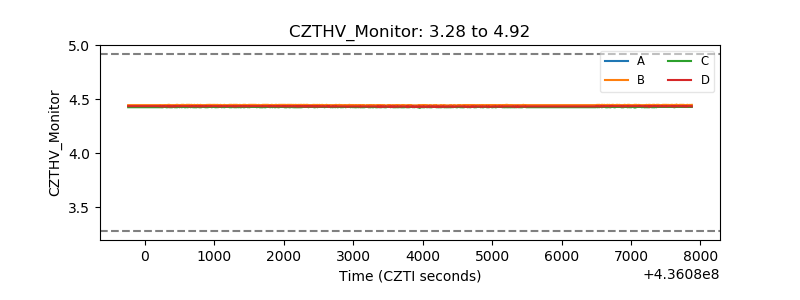 |
| D_VDD | 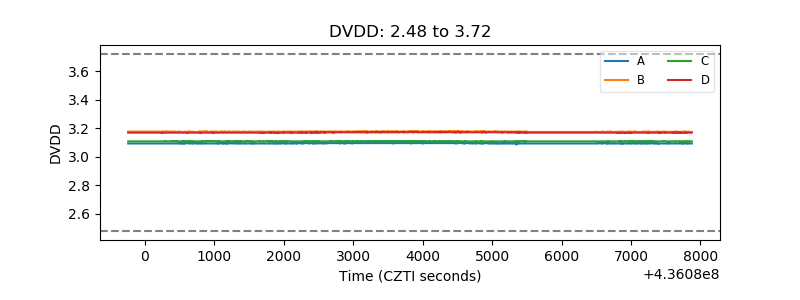 |
| Temperature 1 | 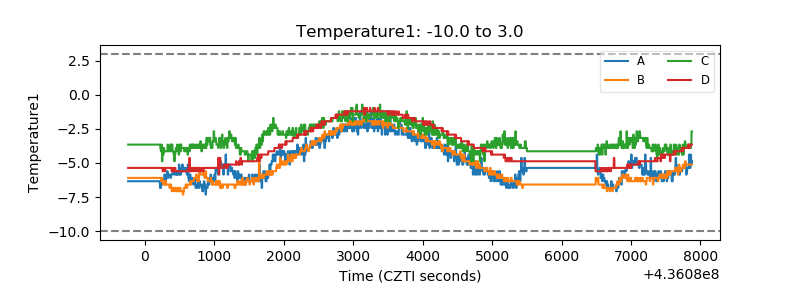 |
| Veto HV Monitor | 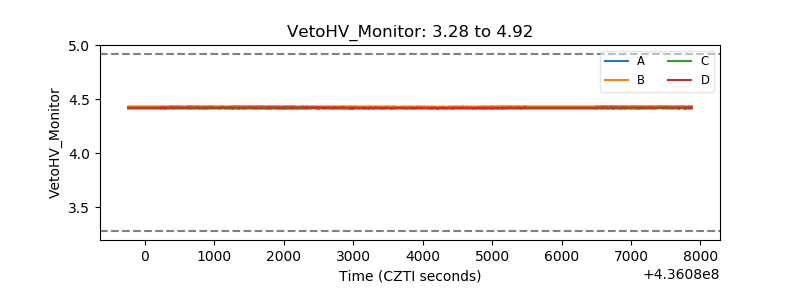 |
| Veto LLD | 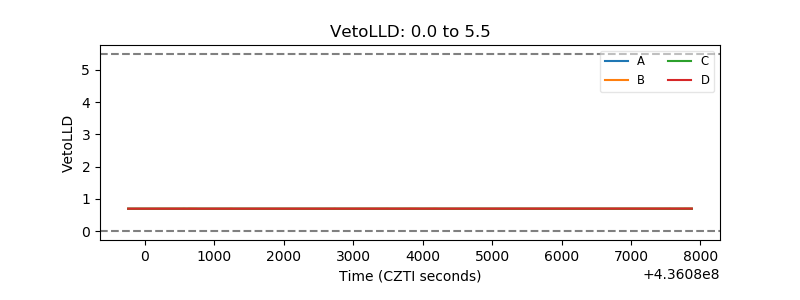 |
| Alpha Counter | 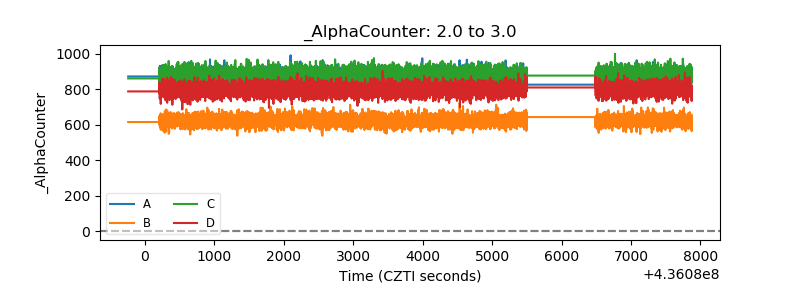 |
| _CPM_Rate | 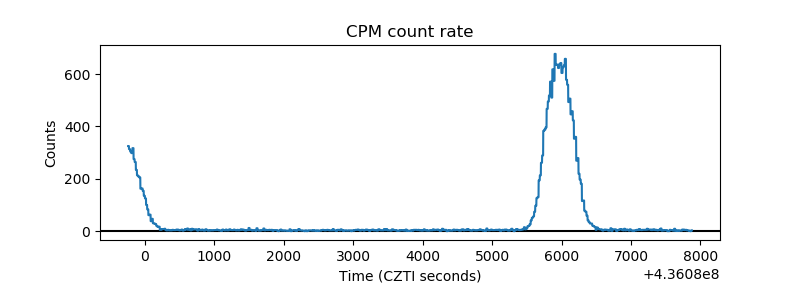 |
| CZT Counter | 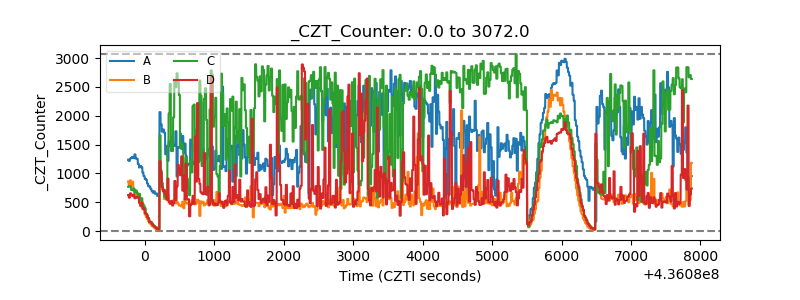 |
| +2.5 Volts monitor | 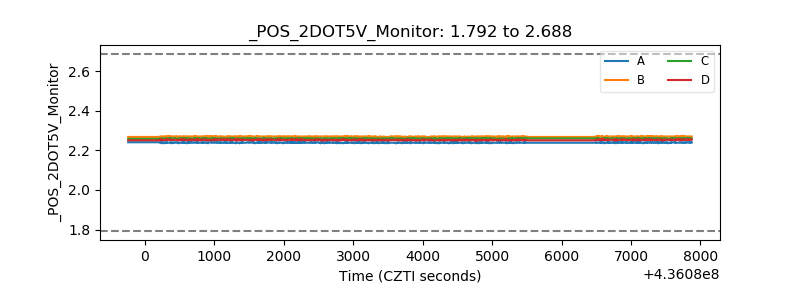 |
| +5 Volts monitor | 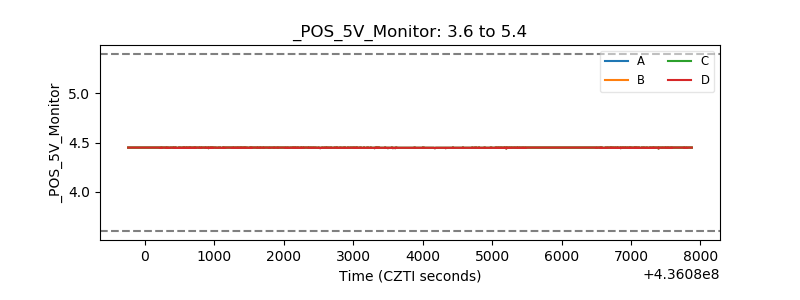 |
| _ROLL_ROT | 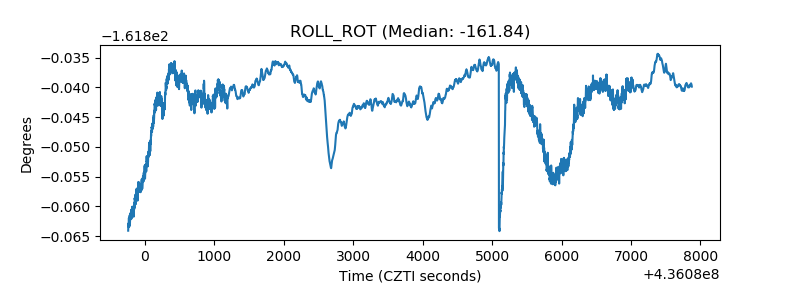 |
| _Roll_DEC | 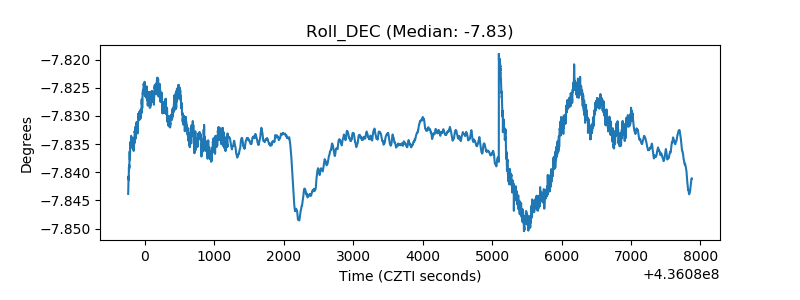 |
| _Roll_RA | 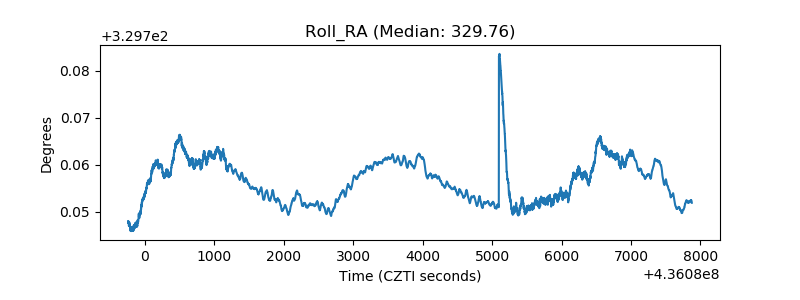 |
| Veto Counter | 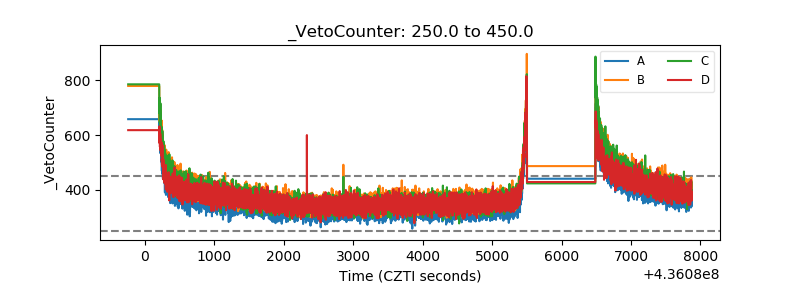 |